


 |
市场调查报告书
商品编码
1892697
需求响应式交通系统市场机会、成长驱动因素、产业趋势分析及预测(2025-2034年)Demand-Responsive Transit Systems Market Opportunity, Growth Drivers, Industry Trend Analysis, and Forecast 2025 - 2034 |
||||||
2024 年全球需求响应式交通系统市场价值为 252 亿美元,预计到 2034 年将以 15.3% 的复合年增长率成长至 1,026 亿美元。
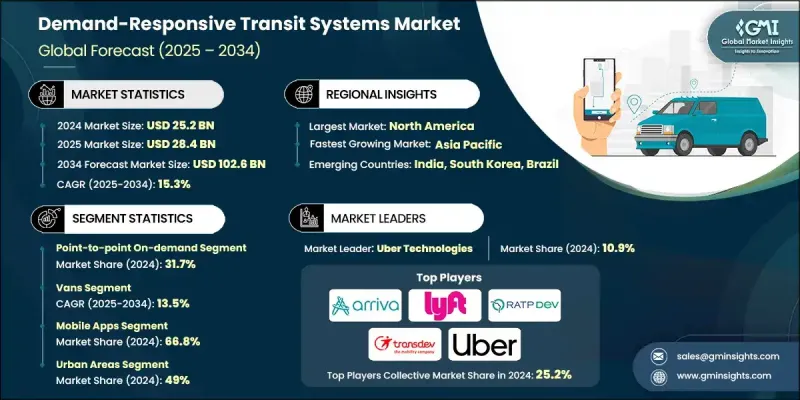
随着各地采用能够适应不同客流量并填补公共交通不足空白的灵活出行服务,需求响应式交通正在蓬勃发展。政府部门的参与度不断提高,各机构也逐渐认识到动态交通模式带来的效率提升,营运评估持续表明,资源利用和出行管理均有所改善。先进技术的应用如今已成为市场成长的核心,即时调度工具、行动预订平台和智慧路线规划软体使营运商能够更有效地管理共乘出行,并减少不必要的行驶里程。这些系统还能在无需扩充车队的情况下提高可靠性,进而为城市和乡村应用打造更有效率、更具可扩展性的服务模式。随着数位化融合重塑交通生态系统,需求响应式网路正成为多个地区现代交通规划的关键组成部分。
| 市场范围 | |
|---|---|
| 起始年份 | 2024 |
| 预测年份 | 2025-2034 |
| 起始值 | 252亿美元 |
| 预测值 | 1026亿美元 |
| 复合年增长率 | 15.3% |
2024年,点对点按需出行市场将占据31.7%的市场。市场之所以领先,是因为乘客越来越重视灵活、直接的出行方案,这些方案能够最大限度地减少等待时间并提供个人化路线。服务提供者则受益于更高的车辆利用率和更低的营运成本,从而支持更永续的服务模式。
2024年,厢型车市场占据主导地位,预计2025年至2034年将以13.5%的复合年增长率成长。厢型车凭藉着适应性强、载客量适宜且价格实惠等优势,仍是首选车型。它们既能行驶于狭窄道路,也能在客流量适中的路段行驶,因此深受希望在满足路线需求的同时优化成本结构的运营商青睐。在需要更有效率客流量管理的地区,小型客车将继续作为厢型车的补充车款。
2024年,美国按需响应式公车系统市场占80.7%的市场份额,市场规模达73亿美元。按需响应式公车在农村和低密度地区迅速普及,为当地居民提供经济实惠的出行方案,并提升交通公平性。多项分析表明,以动态系统取代固定线路服务能够显着降低单次出行成本,并显着提高客流量,从而凸显灵活模式的营运优势。
目录
第一章:方法论
第二章:执行概要
第三章:行业洞察
- 产业生态系分析
- 供应商格局
- 利润率分析
- 成本结构
- 每个阶段的价值增加
- 影响价值链的因素
- 中断
- 产业影响因素
- 成长驱动因素
- 都市化进程加速和微型出行需求增加
- 即时路线规划、动态调度和行动应用的进步
- 政策推动减少壅塞和排放
- 对辅助客运和最后一公里解决方案的需求不断增长
- 产业陷阱与挑战
- 城市间监管框架各不相同
- 公共运输现有业者的阻力及资金限制
- 市场机会
- 与出行即服务平台和交通机构的整合
- 电气化和微型交通(电动接驳车、电动自行车/滑板车)
- 成长驱动因素
- 成长潜力分析
- 监管环境
- 北美洲
- 欧洲
- 亚太地区
- 拉丁美洲
- 中东和非洲
- 波特的分析
- PESTEL分析
- 技术与创新格局
- 当前技术趋势
- 新兴技术
- 定价分析
- 软体即服务 (SaaS) 定价模式
- 依行程及依乘车次数定价结构
- 交钥匙解决方案定价
- 总拥有成本分析
- 成本細項分析
- 专利与智慧财产权分析
- 动态路由演算法专利
- 需求预测与匹配技术专利
- 无障碍技术专利
- 永续性和环境方面
- 永续实践
- 减少废弃物策略
- 生产中的能源效率
- 环保倡议
- 碳足迹考量
- 用例
- 最佳情况
- 投资与融资分析
- 创投与私募股权投资
- 政府拨款及补贴(《联邦税法》第5310、5311条)
- 公私合作模式
- 使用者采纳障碍与数位落差评估
- 科技素养与人口挑战
- 智慧型手机普及率和设备可访问性
- 多通路预订要求(应用程式、网页、互动式语音应答系统、简讯、呼叫中心)
- 语言和文化障碍
- 信任和隐私问题
- 包容性服务设计策略
- 按服务模式分類的营运成本结构与经济效益
- 辅助客运单次行程成本分析
- 微型公车每乘客英里成本
- 固定线路与按需响应式成本比较
- 人工成本构成(司机、调度员、呼叫中心)
- 技术和软体授权成本
- 车辆购置及维修成本
- 燃料与能源成本(内燃机汽车与电动车)
- 行政和管理费用分配
- 补贴要求及票款回收率
第四章:竞争格局
- 介绍
- 公司市占率分析
- 北美洲
- 欧洲
- 亚太地区
- 拉丁美洲
- MEA
- 主要市场参与者的竞争分析
- 竞争定位矩阵
- 战略展望矩阵
- 关键进展
- 併购
- 合作伙伴关係与合作
- 新产品发布
- 扩张计划和资金
第五章:市场估计与预测:依服务业划分,2021-2034年
- 辅助客运
- 微型公车
- 预约乘车服务
- 路线偏离服务
- 点对点按需
- 订阅式服务
- 其他的
第六章:市场估价与预测:依车辆类型划分,2021-2034年
- 范斯
- 敞篷巴士
- 小巴
- 轿车和汽车
- 电动车(EV)
- 自动驾驶汽车(AV)
第七章:市场估计与预测:依技术划分,2021-2034年
- 传统预约系统
- 行动应用
- 其他的
第八章:市场估算与预测:依应用领域划分,2021-2034年
- 都市地区
- 农村地区
- 公司的
- 公部门
- 其他的
第九章:市场估计与预测:依地区划分,2021-2034年
- 北美洲
- 我们
- 加拿大
- 欧洲
- 德国
- 英国
- 法国
- 义大利
- 西班牙
- 北欧
- 俄罗斯
- 亚太地区
- 中国
- 印度
- 日本
- 澳洲
- 韩国
- 新加坡
- 马来西亚
- 泰国
- 拉丁美洲
- 巴西
- 墨西哥
- 阿根廷
- MEA
- 南非
- 沙乌地阿拉伯
- 阿联酋
第十章:公司简介
- 全球参与者
- Ecolane
- Lyft
- Masabi
- Moovit
- Optibus
- Spare Labs
- TransLoc
- Trapeze
- Uber Technologies
- Via Transportation
- 区域玩家
- Arriva
- Go-Ahead
- Keolis
- Padam Mobility
- RATP Dev
- Transdev
- 新兴及小众玩家
- Clever Devices
- Remix
- Routematch
- TripSpark Technologies
The Global Demand-Responsive Transit Systems Market was valued at USD 25.2 billion in 2024 and is estimated to grow at a CAGR of 15.3% to reach USD 102.6 billion by 2034.
Demand-responsive transit is expanding as regions adopt flexible mobility services capable of adapting to varying passenger volumes and filling gaps where public transportation remains limited. Government involvement continues to strengthen as agencies recognize the efficiency gains of dynamic transportation models, with operational assessments consistently demonstrating improvements in resource use and trip management. The adoption of advanced technology is now central to market growth, as real-time dispatching tools, mobile booking platforms, and intelligent routing software allow operators to manage pooled trips more effectively and reduce unnecessary miles traveled. These systems also increase reliability without requiring fleets to expand, creating a more efficient and scalable service model for both urban and rural applications. As digital integration reshapes the transit ecosystem, demand-responsive networks are becoming a critical component in modern transportation planning across multiple regions.
| Market Scope | |
|---|---|
| Start Year | 2024 |
| Forecast Year | 2025-2034 |
| Start Value | $25.2 Billion |
| Forecast Value | $102.6 Billion |
| CAGR | 15.3% |
The point-to-point on-demand segment held a 31.7% share in 2024. This segment leads because passengers increasingly value flexible, direct travel solutions that minimize wait times and provide tailored routing. Service providers benefit through higher vehicle utilization and lower operating costs, which support more sustainable service models.
The vans segment dominated in 2024 and is forecast to grow at 13.5% CAGR from 2025 to 2034. Vans remain the preferred vehicle type due to their adaptability, suitable passenger capacity, and affordability. Their ability to navigate both narrow roads and moderate-demand corridors makes them popular for operators looking to match route needs with optimized cost structures. In areas requiring greater passenger volume management, cutaway buses continue to complement van-based deployments.
US Demand-Responsive Transit Systems Market accounted for 80.7% share and generated USD 7.3 billion in 2024. Demand-responsive transit has gained traction across rural and lower-density regions, where it provides an economical mobility solution and enhances transportation equity. In multiple analyses, replacing fixed-route services with dynamic systems has demonstrated significant reductions in per-trip costs and notable increases in ridership, reinforcing the operational advantages of flexible models.
Major companies in the Demand-Responsive Transit Systems Market include Arriva, Go-Ahead, Keolis, Lyft, Moovit, Padam Mobility, RATP Dev, Transdev, Uber Technologies, and Via Transportation. Companies in the Demand-Responsive Transit Systems Market are strengthening their market position by expanding digital platforms, enhancing real-time routing algorithms, and investing in integrated mobility solutions that connect multiple transportation modes. Many organizations are partnering with municipalities and transit agencies to deploy turnkey systems that streamline booking, dispatch, and fleet coordination. Strategic emphasis is placed on lowering operational costs through advanced data analytics, which improves load balancing and reduces unnecessary mileage. Firms are also creating modular service models tailored to suburban, urban, and rural environments to broaden their customer base.
Table of Contents
Chapter 1 Methodology
- 1.1 Market scope and definition
- 1.2 Research design
- 1.2.1 Research approach
- 1.2.2 Data collection methods
- 1.3 Data mining sources
- 1.3.1 Global
- 1.3.2 Regional/Country
- 1.4 Base estimates and calculations
- 1.4.1 Base year calculation
- 1.4.2 Key trends for market estimation
- 1.5 Primary research and validation
- 1.5.1 Primary sources
- 1.6 Forecast
- 1.7 Research assumptions and limitations
Chapter 2 Executive Summary
- 2.1 Industry 360° synopsis, 2021 - 2034
- 2.2 Key market trends
- 2.2.1 Regional
- 2.2.2 Service
- 2.2.3 Vehicle
- 2.2.4 Technology
- 2.2.5 Application
- 2.3 TAM Analysis, 2025-2034
- 2.4 CXO perspectives: Strategic imperatives
- 2.4.1 Executive decision points
- 2.4.2 Critical success factors
- 2.5 Future outlook and strategic recommendations
Chapter 3 Industry Insights
- 3.1 Industry ecosystem analysis
- 3.1.1 Supplier landscape
- 3.1.2 Profit margin analysis
- 3.1.3 Cost structure
- 3.1.4 Value addition at each stage
- 3.1.5 Factor affecting the value chain
- 3.1.6 Disruptions
- 3.2 Industry impact forces
- 3.2.1 Growth drivers
- 3.2.1.1 Growing urbanization and micro-mobility demand
- 3.2.1.2 Advances in real-time routing, dynamic dispatch & mobile apps
- 3.2.1.3 Policy push towards reducing congestion & emissions
- 3.2.1.4 Rising demand for paratransit and first/last-mile solutions
- 3.2.2 Industry pitfalls and challenges
- 3.2.2.1 Variable regulatory frameworks across cities
- 3.2.2.2 Public transit incumbents’ resistance & funding limits
- 3.2.3 Market opportunities
- 3.2.3.1 Integration with MaaS platforms and transit agencies
- 3.2.3.2 Electrification and micro-transit (EV shuttles, e-bikes/scooters)
- 3.2.1 Growth drivers
- 3.3 Growth potential analysis
- 3.4 Regulatory landscape
- 3.4.1 North America
- 3.4.2 Europe
- 3.4.3 Asia Pacific
- 3.4.4 Latin America
- 3.4.5 Middle East & Africa
- 3.5 Porter's analysis
- 3.6 Pestel analysis
- 3.7 Technology and innovation landscape
- 3.7.1 Current technological trends
- 3.7.2 Emerging technologies
- 3.8 Pricing analysis
- 3.8.1 Software-as-a-service (SaaS) pricing models
- 3.8.2 Per-trip and per-ride pricing structures
- 3.8.3 Turnkey solution pricing
- 3.8.4 Total cost of ownership analysis
- 3.9 Cost breakdown analysis
- 3.10 Patent & intellectual property analysis
- 3.10.1 Dynamic routing algorithm patents
- 3.10.2 Demand prediction and matching technology patents
- 3.10.3 Accessibility technology patents
- 3.11 Sustainability and environmental aspects
- 3.11.1 Sustainable practices
- 3.11.2 Waste reduction strategies
- 3.11.3 Energy efficiency in production
- 3.11.4 Eco-friendly Initiatives
- 3.11.5 Carbon footprint considerations
- 3.12 Use cases
- 3.13 Best-case scenario
- 3.14 Investment & funding analysis
- 3.14.1 Venture capital and private equity investments
- 3.14.2 Government grants and subsidies (FTA section 5310, 5311)
- 3.14.3 Public-private partnership models
- 3.15 User adoption barriers & digital divide assessment
- 3.15.1 Technology literacy and demographic challenges
- 3.15.2 Smartphone penetration and device accessibility
- 3.15.3 Multi-channel booking requirements (app, web, IVR, SMS, call center)
- 3.15.4 Language and cultural barriers
- 3.15.5 Trust and privacy concerns
- 3.15.6 Strategies for inclusive service design
- 3.16 Operational cost structure & economics by service model
- 3.16.1 Paratransit cost per trip analysis
- 3.16.2 Microtransit cost per passenger mile
- 3.16.3 Fixed-route vs. demand-responsive cost comparison
- 3.16.4 Labor cost components (driver, dispatch, call center)
- 3.16.5 Technology and software licensing costs
- 3.16.6 Vehicle acquisition and maintenance costs
- 3.16.7 Fuel and energy costs (ICE vs. EV)
- 3.16.8 Administrative and overhead allocation
- 3.16.9 Subsidy requirements and farebox recovery ratios
Chapter 4 Competitive Landscape, 2024
- 4.1 Introduction
- 4.2 Company market share analysis
- 4.2.1 North America
- 4.2.2 Europe
- 4.2.3 Asia Pacific
- 4.2.4 LATAM
- 4.2.5 MEA
- 4.3 Competitive analysis of major market players
- 4.4 Competitive positioning matrix
- 4.5 Strategic outlook matrix
- 4.6 Key developments
- 4.6.1 Mergers & acquisitions
- 4.6.2 Partnerships & collaborations
- 4.6.3 New product launches
- 4.6.4 Expansion plans and funding
Chapter 5 Market Estimates & Forecast, By Services, 2021 - 2034 ($Mn)
- 5.1 Key trends
- 5.2 Paratransit
- 5.3 Microtransit
- 5.4 Dial-a-Ride
- 5.5 Route Deviation Services
- 5.6 Point-to-Point On-Demand
- 5.7 Subscription-Based Services
- 5.8 Others
Chapter 6 Market Estimates & Forecast, By Vehicle, 2021 - 2034 ($Mn)
- 6.1 Key trends
- 6.2 Vans
- 6.3 Cutaway Buses
- 6.4 Minibuses
- 6.5 Sedans & Cars
- 6.6 Electric Vehicles (EVs)
- 6.7 Autonomous Vehicles (AVs)
Chapter 7 Market Estimates & Forecast, By Technology, 2021 - 2034 ($Mn)
- 7.1 Key trends
- 7.2 Traditional booking system
- 7.3 Mobile apps
- 7.4 Others
Chapter 8 Market Estimates & Forecast, By Application, 2021 - 2034 ($Mn)
- 8.1 Key trends
- 8.2 Urban areas
- 8.3 Rural areas
- 8.4 Corporate
- 8.5 Public sector
- 8.6 Others
Chapter 9 Market Estimates & Forecast, By Region, 2021 - 2034 ($Mn)
- 9.1 Key trends
- 9.2 North America
- 9.2.1 US
- 9.2.2 Canada
- 9.3 Europe
- 9.3.1 Germany
- 9.3.2 UK
- 9.3.3 France
- 9.3.4 Italy
- 9.3.5 Spain
- 9.3.6 Nordics
- 9.3.7 Russia
- 9.4 Asia Pacific
- 9.4.1 China
- 9.4.2 India
- 9.4.3 Japan
- 9.4.4 Australia
- 9.4.5 South Korea
- 9.4.6 Singapore
- 9.4.7 Malaysia
- 9.4.8 Thailand
- 9.5 Latin America
- 9.5.1 Brazil
- 9.5.2 Mexico
- 9.5.3 Argentina
- 9.6 MEA
- 9.6.1 South Africa
- 9.6.2 Saudi Arabia
- 9.6.3 UAE
Chapter 10 Company Profiles
- 10.1 Global Players
- 10.1.1 Ecolane
- 10.1.2 Lyft
- 10.1.3 Masabi
- 10.1.4 Moovit
- 10.1.5 Optibus
- 10.1.6 Spare Labs
- 10.1.7 TransLoc
- 10.1.8 Trapeze
- 10.1.9 Uber Technologies
- 10.1.10 Via Transportation
- 10.2 Regional Players
- 10.2.1 Arriva
- 10.2.2 Go-Ahead
- 10.2.3 Keolis
- 10.2.4 Padam Mobility
- 10.2.5 RATP Dev
- 10.2.6 Transdev
- 10.3 Emerging & Niche Players
- 10.3.1 Clever Devices
- 10.3.2 Remix
- 10.3.3 Routematch
- 10.3.4 TripSpark Technologies
 全球需求响应型交通运输市场
 需求响应型运输市场机会、成长动力、产业趋势分析及 2024 年至 2032 年预测
 全球按需运输市场:市场规模和占有率分析 - 趋势、驱动因素、竞争格局和预测(2024-2030年)