


 |
市场调查报告书
商品编码
1892726
电力系统模拟器市场机会、成长驱动因素、产业趋势分析及预测(2025-2034年)Power System Simulator Market Opportunity, Growth Drivers, Industry Trend Analysis, and Forecast 2025 - 2034 |
||||||
2024 年全球电力系统模拟器市值为 8.321 亿美元,预计到 2034 年将以 3.9% 的复合年增长率成长至 12.2 亿美元。
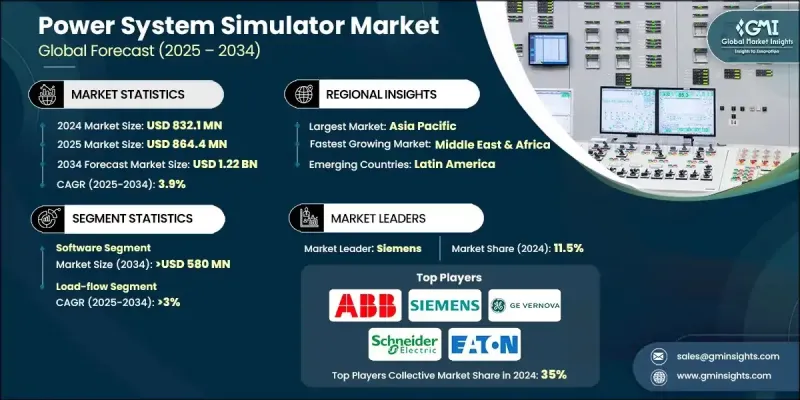
市场扩张的驱动力来自日益复杂的电网和再生能源资源的加速部署。随着越来越多的国家向永续能源转型,模拟工具在评估设计、执行压力测试以及在不影响实际资产的情况下保障电网稳定性方面变得不可或缺。公共措施也正在加速市场发展,政策框架强调改善规划、增强韧性和提高运作可靠性,而这些领域都高度依赖精确的模拟技术。电力公司和研究机构越来越多地采用即时数位模拟平台和硬体在环系统来验证保护配置,并在再生能源变化的条件下评估基于逆变器的资源。数位孪生技术的发展势头也日益强劲,使营运商能够建立其网路的虚拟模型,用于预测性诊断和效能最佳化。随着全球能源网路的扩展和互联,对先进模拟软体的需求持续增长,这凸显了复杂可再生能源併网场景下使用精密工具的重要性。
| 市场范围 | |
|---|---|
| 起始年份 | 2024 |
| 预测年份 | 2025-2034 |
| 起始值 | 8.321亿美元 |
| 预测值 | 12.2亿美元 |
| 复合年增长率 | 3.9% |
预计到2034年,软体市场规模将达到5.8亿美元。这一成长与分散式能源、储能技术和可变再生能源系统日益普及,导致电网复杂性不断增加密切相关。基于软体的模拟平台具有高度的适应性和对精确建模的支持,能够帮助营运商优化应急策略,提升系统整体性能,同时规避物理基础设施风险。
预计到 2034 年,短路模拟类别的市场规模将达到 2.9 亿美元。该模组在评估故障事件期间的系统响应和计算故障电流方面发挥着至关重要的作用,确保正确选择保护装置,并验证组件能否承受故障引起的应力。
2024年,美国电力系统模拟器市场规模预估为2.14亿美元。其持续成长与再生能源的扩张、交通电气化以及电网基础设施的现代化密切相关。公用事业公司、科技公司和政府机构之间的紧密合作,促进了先进模拟系统的应用,而对智慧电网、计量技术和分散式资源整合的投资也进一步推动了这一趋势。
目录
第一章:方法论与范围
第二章:执行概要
第三章:行业洞察
- 产业生态系分析
- 监管环境
- 产业影响因素
- 成长驱动因素
- 产业陷阱与挑战
- 成长潜力分析
- 波特的分析
- PESTEL 分析
- 新兴机会与趋势
- 数位化与物联网集成
- 新兴市场渗透
- 投资分析及未来展望
第四章:竞争格局
- 介绍
- 按地区分類的公司市占率分析
- 北美洲
- 欧洲
- 亚太地区
- 中东和非洲
- 拉丁美洲
- 策略倡议
- 竞争基准描述
- 策略仪錶板
- 创新与技术格局
第五章:市场规模及预测:依产品类型划分,2021-2034年
- 硬体
- 软体
- 服务
第六章:市场规模及预测:依模组划分,2021-2034年
- 负荷流
- 短路
- 电弧闪光
- 装置配位选择性
- 谐波
- 其他的
第七章:市场规模及预测:依应用领域划分,2021-2034年
- 发电
- 输配电
- 石油和天然气
- 製造业
- 金属与矿业
- 其他的
第八章:市场规模及预测:依地区划分,2021-2034年
- 北美洲
- 我们
- 加拿大
- 墨西哥
- 欧洲
- 英国
- 法国
- 德国
- 义大利
- 俄罗斯
- 西班牙
- 亚太地区
- 中国
- 澳洲
- 印度
- 日本
- 韩国
- 中东和非洲
- 沙乌地阿拉伯
- 阿联酋
- 土耳其
- 南非
- 埃及
- 拉丁美洲
- 巴西
- 阿根廷
第九章:公司简介
- ABB
- AspenTech
- CORYS
- EATAP
- Eaton
- Fuji Electric
- GE Vernova
- Mathworks
- MATPOWER
- Nayak Corporation
- Neplan
- OPAL-RT
- PowerWorld
- Protasis
- RTDS Technologies
- Schneider Electric
- Siemens
- Vicor Corporation
The Global Power System Simulator Market was valued at USD 832.1 million in 2024 and is estimated to grow at a CAGR of 3.9% to reach USD 1.22 billion by 2034.
Market expansion is fueled by the growing complexity of electric grids and the accelerating deployment of renewable energy resources. As more nations transition toward sustainable power, simulation tools are becoming indispensable for evaluating designs, executing stress tests, and protecting grid stability without impacting real-world assets. Public initiatives are also accelerating market momentum, with policy frameworks emphasizing improved planning, resilience, and operational reliability areas that depend heavily on accurate simulation technologies. Utilities and research bodies are increasingly turning to real-time digital simulation platforms and hardware-in-the-loop systems to validate protection configurations and assess inverter-based resources under variable renewable conditions. Momentum around digital twins is also escalating, enabling operators to build virtual models of their networks for predictive diagnostics and performance refinement. As global energy networks expand and interconnect, the demand for advanced simulation software continues to grow, reinforcing the importance of sophisticated tools to support complex renewable integration scenarios.
| Market Scope | |
|---|---|
| Start Year | 2024 |
| Forecast Year | 2025-2034 |
| Start Value | $832.1 Million |
| Forecast Value | $1.22 Billion |
| CAGR | 3.9% |
The software segment is expected to reach USD 580 million by 2034. This growth is tied to rising grid complexity as distributed energy, storage technologies, and variable renewable systems become more prevalent. Software-based simulation platforms offer adaptability and support accurate modeling, helping operators refine contingency strategies and improve overall system performance while avoiding physical infrastructure risks.
The short-circuit simulation category is projected to reach USD 290 million by 2034. This module plays an essential role in evaluating system response during fault events and calculating fault currents, ensuring proper protection-device selection and verifying that components can withstand fault-induced stress.
United States Power System Simulator Market was valued at USD 214 million in 2024. Continued growth is closely linked to renewable energy expansion, transportation electrification, and the modernization of grid infrastructure. Strong cooperation between utilities, technology firms, and government bodies strengthens the adoption of advanced simulation systems, further supported by investments in smart grids, metering technologies, and distributed resource integration.
Key players in the Global Power System Simulator Market include Nayak Corporation, Neplan, Eaton, Protasis, AspenTech, PowerWorld, Onsemi, ABB, Opal-RT, GE Vernova, Siemens, MATPOWER, Vicor Corporation, Schneider Electric, NuScale Power Corporation, RTDS Technologies, Fuji Electric, EATAP, CORYS, and Mathworks. Companies participating in the Global Power System Simulator Market are using strategic initiatives to reinforce their global positioning. Many are investing in advanced simulation algorithms, cloud-based platforms, and modular software architectures to meet rising demands for flexible, real-time modeling. Firms are strengthening collaborations with utilities, research institutes, and grid operators to co-develop customized solutions tailored to renewable integration and grid modernization goals. Investments in digital twin platforms, cybersecurity enhancements, and high-fidelity HIL systems are supporting more accurate scenario analysis. Companies are expanding global service networks, offering training programs, and integrating AI-based analytics to differentiate their offerings.
Table of Contents
Chapter 1 Methodology & Scope
- 1.1 Research design
- 1.2 Market estimates & forecast parameters
- 1.3 Forecast calculation
- 1.4 Data sources
- 1.4.1 Primary
- 1.4.2 Secondary
- 1.4.2.1 Paid
- 1.4.2.2 Public
Chapter 2 Executive Summary
- 2.1 Industry synopsis, 2021 - 2034
Chapter 3 Industry Insights
- 3.1 Industry ecosystem analysis
- 3.2 Regulatory landscape
- 3.3 Industry impact forces
- 3.3.1 Growth drivers
- 3.3.2 Industry pitfalls & challenges
- 3.4 Growth potential analysis
- 3.5 Porter's analysis
- 3.5.1 Bargaining power of suppliers
- 3.5.2 Bargaining power of buyers
- 3.5.3 Threat of new entrants
- 3.5.4 Threat of substitutes
- 3.6 PESTEL analysis
- 3.6.1 Political factors
- 3.6.2 Economic factors
- 3.6.3 Social factors
- 3.6.4 Technological factors
- 3.6.5 Legal factors
- 3.6.6 Environmental factors
- 3.7 Emerging opportunities & trends
- 3.7.1 Digitalization & IoT integration
- 3.7.2 Emerging market penetration
- 3.8 Investment analysis & future outlook
Chapter 4 Competitive Landscape, 2025
- 4.1 Introduction
- 4.2 Company market share analysis, by Region, 2024
- 4.2.1 North America
- 4.2.2 Europe
- 4.2.3 Asia Pacific
- 4.2.4 Middle East & Africa
- 4.2.5 Latin America
- 4.3 Strategic initiatives
- 4.4 Competitive benchmarking depictions
- 4.5 Strategy dashboard
- 4.6 Innovation & technology landscape
Chapter 5 Market Size and Forecast, By Offering, 2021 - 2034 (USD Million)
- 5.1 Key trends
- 5.2 Hardware
- 5.3 Software
- 5.4 Services
Chapter 6 Market Size and Forecast, By Modules, 2021 - 2034 (USD Million)
- 6.1 Key trends
- 6.2 Load flow
- 6.3 Short circuit
- 6.4 Arc flash
- 6.5 Device coordination selectivity
- 6.6 Harmonics
- 6.7 Others
Chapter 7 Market Size and Forecast, By Application, 2021 - 2034 (USD Million)
- 7.1 Key trends
- 7.2 Power generation
- 7.3 Transmission & distribution
- 7.4 Oil & gas
- 7.5 Manufacturing
- 7.6 Metals & mining
- 7.7 Others
Chapter 8 Market Size and Forecast, By Region, 2021 - 2034 (USD Million)
- 8.1 Key trends
- 8.2 North America
- 8.2.1 U.S.
- 8.2.2 Canada
- 8.2.3 Mexico
- 8.3 Europe
- 8.3.1 UK
- 8.3.2 France
- 8.3.3 Germany
- 8.3.4 Italy
- 8.3.5 Russia
- 8.3.6 Spain
- 8.4 Asia Pacific
- 8.4.1 China
- 8.4.2 Australia
- 8.4.3 India
- 8.4.4 Japan
- 8.4.5 South Korea
- 8.5 Middle East & Africa
- 8.5.1 Saudi Arabia
- 8.5.2 UAE
- 8.5.3 Turkey
- 8.5.4 South Africa
- 8.5.5 Egypt
- 8.6 Latin America
- 8.6.1 Brazil
- 8.6.2 Argentina
Chapter 9 Company Profiles
- 9.1 ABB
- 9.2 AspenTech
- 9.3 CORYS
- 9.4 EATAP
- 9.5 Eaton
- 9.6 Fuji Electric
- 9.7 GE Vernova
- 9.8 Mathworks
- 9.9 MATPOWER
- 9.10 Nayak Corporation
- 9.11 Neplan
- 9.12 OPAL-RT
- 9.13 PowerWorld
- 9.14 Protasis
- 9.15 RTDS Technologies
- 9.16 Schneider Electric
- 9.17 Siemens
- 9.18 Vicor Corporation
 2026年全球电力系统模拟软体市场报告
 电力系统模拟器市场 - 全球产业规模、份额、趋势、机会及预测(按模组、组件、最终用户、地区和竞争格局划分,2021-2031年)
 太阳能板保护市场按产品类型、安装类型、技术、应用和分销管道划分,全球预测(2026-2032年)
 电力系统模拟器市场规模、份额及成长分析(按组件、模组、最终用途和地区划分)-2026-2033年产业预测太阳能沼气混合发电系统市场-全球产业规模、份额、趋势、机会和预测(按技术、应用、最终用户、系统配置、地区和竞争细分,2020-2030 年预测)
 2026 年至 2032 年电力系统模拟器市场(按模组、产品、最终用户和地区划分)
 太阳能-沼气混合发电系统市场预测至 2030 年:按组件、燃料类型、系统类型、容量、技术、最终用户和地区进行的全球分析
 亚太电力系统模拟软体市场:按应用、按产品、按国家 - 分析和预测(2023-2033)
 欧洲电力系统模拟软体市场:按应用、按产品、按国家 - 分析和预测(2023-2033 年)
 电力系统模拟器市场:2024-2031年全球产业分析、规模、占有率、成长、趋势、预测