


 |
市场调查报告书
商品编码
1892778
自动化细胞计数器市场机会、成长驱动因素、产业趋势分析及预测(2026-2035年)Automated Cell Counter Market Opportunity, Growth Drivers, Industry Trend Analysis, and Forecast 2026 - 2035 |
||||||
2025 年全球自动细胞计数器市场价值为 71 亿美元,预计到 2035 年将以 6% 的复合年增长率增长至 125 亿美元。
市场扩张的驱动因素包括长期疾病和传染性疾病发病率的上升、全球研究投入的增加以及自动化细胞分析解决方案技术的持续进步。随着医疗保健系统日益重视早期诊断、精准医疗和大规模筛检,对快速、准确的细胞分析的需求持续成长。自动化细胞计数器支援高通量工作流程,同时最大限度地减少人为操作的差异,从而提高了诊断、临床和研究环境中的可靠性。对效率、可重复性和资料准确性的日益重视,进一步推动了全球实验室对这些系统的采用。由于这些系统能够大规模地提供一致的结果,因此它们正成为现代医疗保健和生命科学研究不可或缺的一部分,既支持常规检测,也支持前沿科学研究。
| 市场范围 | |
|---|---|
| 起始年份 | 2025 |
| 预测年份 | 2026-2035 |
| 起始值 | 71亿美元 |
| 预测值 | 125亿美元 |
| 复合年增长率 | 6% |
流式细胞仪市场预计在2025年将创造39亿美元的收入,占市场份额的55%。流式细胞仪技术能够同时评估多种细胞特征,从而快速分析大量细胞群。其高速处理和多参数评估能力使其成为临床诊断和科研实验室中先进细胞测量应用的核心工具。
预计2025年,血液细胞分析市场规模将达34亿美元。血液细胞检测仍然是最常用的诊断程序之一,为疾病检测、治疗监测和临床研究提供支援。自动化系统能够提高检测准确性和缩短週转时间,同时减轻医疗机构的营运负担。
预计到2024年,製药和生技公司将占据29.4%的市场。这些公司依赖自动化细胞计数器来支援药物研发、生物製剂生产和品质保证流程。对生物製剂和个人化疗法的日益重视,持续推高了对精准且可扩展的细胞计数技术的需求。
2024年,北美自动化细胞数市场占据38%的份额。强大的医疗基础设施、先进的实验室能力以及对精准诊断工具日益增长的需求,支撑着该地区自动化细胞计数技术的持续普及。对效率和数据驱动型医疗的重视,也进一步加速了自动化解决方案的应用。
目录
第一章:方法论与范围
第二章:执行概要
第三章:行业洞察
- 产业生态系分析
- 产业影响因素
- 成长驱动因素
- 慢性病和传染病症率不断上升
- 全球研发支出不断增加
- 自动化细胞计数产业的技术进步
- 干细胞和再生医学的扩展
- 产业陷阱与挑战
- 自动细胞计数设备成本高昂
- 缺乏熟练劳动力
- 市场机会
- 细胞治疗生产规模扩大
- 成长驱动因素
- 成长潜力分析
- 监管环境
- 技术进步
- 当前技术趋势
- 新兴技术
- 2024年定价分析
- 未来市场趋势
- 波特的分析
- PESTEL 分析
第四章:竞争格局
- 介绍
- 公司市占率分析
- 公司矩阵分析
- 主要市场参与者的竞争分析
- 竞争定位矩阵
- 关键进展
- 併购
- 伙伴关係与合作
- 新产品发布
- 扩张计划
第五章:市场估算与预测:依产品划分,2022-2035年
- 流式细胞仪
- 基于萤光影像的细胞计数器
- 库尔特计数器
第六章:市场估算与预测:依应用领域划分,2022-2035年
- 血球
- 细胞系
- 微生物细胞
- 其他应用
第七章:市场估算与预测:依最终用途划分,2022-2035年
- 製药和生物技术公司
- 医院
- 诊断实验室
- 研究机构
- 其他最终用途
第八章:市场估算与预测:依地区划分,2021-2034年
- 北美洲
- 我们
- 加拿大
- 欧洲
- 德国
- 英国
- 法国
- 西班牙
- 义大利
- 荷兰
- 亚太地区
- 中国
- 印度
- 日本
- 澳洲
- 韩国
- 拉丁美洲
- 巴西
- 墨西哥
- 阿根廷
- 中东和非洲
- 沙乌地阿拉伯
- 南非
- 阿联酋
第九章:公司简介
- Thermo Fisher Scientific
- PerkinElmer
- Bio-Rad Laboratories
- Abbott Laboratories
- Sysmex Corporation
- NanoEnTek
- F. Hoffmann-La Roche Ltd
- Danaher (Beckman Coulter Inc. and Radiometer)
- Agilent Technologies
- Merck KGaA
- ChemoMetec A/S
- Logos Biosystems
- Nexcelom Bioscience (Revvity)
- DeNovix
- Curiosis
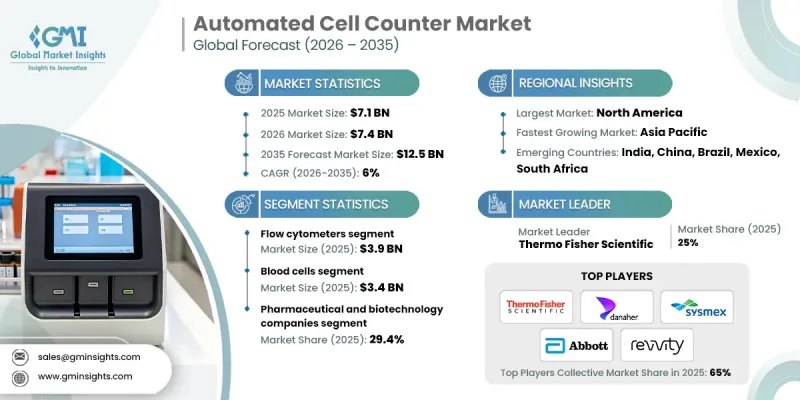
The Global Automated Cell Counter Market was valued at USD 7.1 billion in 2025 and is estimated to grow at a CAGR of 6% to reach USD 12.5 billion by 2035.
Market expansion is driven by the rising incidence of long-term and infectious health conditions, increasing global investment in research activities, and continuous technological progress within automated cell analysis solutions. As healthcare systems emphasize early diagnosis, precision medicine, and large-scale screening initiatives, demand for fast and accurate cell analysis continues to increase. Automated cell counters support high-throughput workflows while minimizing manual variability, which enhances reliability across diagnostic, clinical, and research environments. Growing emphasis on efficiency, reproducibility, and data accuracy is reinforcing their adoption across laboratories worldwide. These systems are becoming integral to modern healthcare and life science research due to their ability to deliver consistent results at scale, supporting both routine testing and advanced scientific studies.
| Market Scope | |
|---|---|
| Start Year | 2025 |
| Forecast Year | 2026-2035 |
| Start Value | $7.1 Billion |
| Forecast Value | $12.5 Billion |
| CAGR | 6% |
The flow cytometry segment generated USD 3.9 billion in 2025 and accounted for 55% share. Flow cytometry technology enables rapid analysis of large cell populations by evaluating multiple cellular characteristics simultaneously. Its high-speed processing and multi-parameter assessment capabilities make it a core tool in advanced cell measurement applications across clinical diagnostics and research laboratories.
The blood cell analysis segment was valued at USD 3.4 billion in 2025. Blood cell measurement remains one of the most frequently performed diagnostic procedures, supporting disease detection, treatment monitoring, and clinical research. Automated systems improve accuracy and turnaround time while reducing operational burden across healthcare facilities.
The pharmaceutical and biotechnology companies held a 29.4% share in 2024. These organizations rely on automated cell counters to support drug development, biologics manufacturing, and quality assurance processes. Increasing focus on biologics and individualized therapies continues to elevate demand for precise and scalable cell counting technologies.
North America Automated Cell Counter Market held a 38% share in 2024. Strong healthcare infrastructure, advanced laboratory capabilities, and growing demand for accurate diagnostic tools support sustained adoption across the region. Emphasis on efficiency and data-driven care continues to accelerate the use of automated solutions.
Key companies active in the Global Automated Cell Counter Market include Thermo Fisher Scientific, Sysmex Corporation, Abbott Laboratories, Bio-Rad Laboratories, Danaher, Merck KGaA, Agilent Technologies, PerkinElmer, F. Hoffmann-La Roche Ltd, NanoEnTek, ChemoMetec A/S, Logos Biosystems, Nexcelom Bioscience (Revvity), DeNovix, and Curiosis. Companies in the Global Automated Cell Counter Market implement strategic initiatives to strengthen their competitive position. Continuous investment in research and product innovation enables the development of faster, more accurate, and user-friendly systems. Firms expand their portfolios to address diverse application needs across diagnostics, research, and bioprocessing. Strategic partnerships and acquisitions help broaden geographic presence and technical capabilities. Companies also focus on automation, software integration, and data analytics to enhance system value.
Table of Contents
Chapter 1 Methodology and Scope
- 1.1 Market scope and definition
- 1.2 Research design
- 1.2.1 Research approach
- 1.2.2 Data collection methods
- 1.3 Data mining sources
- 1.3.1 Global
- 1.3.2 Regional/Country
- 1.4 Base estimates and calculations
- 1.4.1 Base year calculation
- 1.4.2 Key trends for market estimation
- 1.5 Primary research and validation
- 1.5.1 Primary sources
- 1.6 Forecast model
- 1.7 Research assumptions and limitations
Chapter 2 Executive Summary
- 2.1 Industry 3600 synopsis
- 2.2 Key market trends
- 2.2.1 Regional trends
- 2.2.2 Product type trends
- 2.2.3 Application trends
- 2.2.4 End use trends
- 2.3 CXO perspectives: Strategic imperatives
- 2.3.1 Key decision points for industry executives
- 2.3.2 Critical success factors for market players
- 2.4 Future outlook and strategic recommendations
Chapter 3 Industry Insights
- 3.1 Industry ecosystem analysis
- 3.2 Industry impact forces
- 3.2.1 Growth drivers
- 3.2.1.1 Increasing prevalence of chronic and infectious diseases
- 3.2.1.2 Increasing research and development expenditure worldwide
- 3.2.1.3 Technological advancements in automated cell counter industry
- 3.2.1.4 Expansion of stem cell and regenerative medicine
- 3.2.2 Industry pitfalls and challenges
- 3.2.2.1 High cost of automated cell counter devices
- 3.2.2.2 Lack of skilled workforce
- 3.2.3 Market opportunities
- 3.2.3.1 Expansion in cell therapy manufacturing
- 3.2.1 Growth drivers
- 3.3 Growth potential analysis
- 3.4 Regulatory landscape
- 3.4.1 North America
- 3.4.2 Europe
- 3.4.3 Asia Pacific
- 3.4.4 Latin America
- 3.4.5 Middle East and Africa
- 3.5 Technological advancements
- 3.5.1 Current technological trends
- 3.5.2 Emerging technologies
- 3.6 Pricing analysis, 2024
- 3.7 Future market trends
- 3.8 Porter's analysis
- 3.9 PESTEL analysis
Chapter 4 Competitive Landscape, 2024
- 4.1 Introduction
- 4.2 Company market share analysis
- 4.3 Company matrix analysis
- 4.4 Competitive analysis of major market players
- 4.5 Competitive positioning matrix
- 4.6 Key developments
- 4.6.1 Mergers and acquisitions
- 4.6.2 Partnerships and collaborations
- 4.6.3 New product launches
- 4.6.4 Expansion plans
Chapter 5 Market Estimates and Forecast, By Product, 2022 - 2035 ($ Mn)
- 5.1 Key trends
- 5.2 Flow cytometers
- 5.3 Fluorescence image-based cell counter
- 5.4 Coulter counter
Chapter 6 Market Estimates and Forecast, By Application, 2022 - 2035 ($ Mn)
- 6.1 Key trends
- 6.2 Blood cells
- 6.3 Cell lines
- 6.4 Microbial cells
- 6.5 Other applications
Chapter 7 Market Estimates and Forecast, By End Use, 2022 - 2035 ($ Mn)
- 7.1 Key trends
- 7.2 Pharmaceutical & biotechnology companies
- 7.3 Hospitals
- 7.4 Diagnostic laboratories
- 7.5 Research institutes
- 7.6 Other end use
Chapter 8 Market Estimates and Forecast, By Region, 2021 - 2034 ($ Mn)
- 8.1 Key trends
- 8.2 North America
- 8.2.1 U.S.
- 8.2.2 Canada
- 8.3 Europe
- 8.3.1 Germany
- 8.3.2 UK
- 8.3.3 France
- 8.3.4 Spain
- 8.3.5 Italy
- 8.3.6 Netherlands
- 8.4 Asia Pacific
- 8.4.1 China
- 8.4.2 India
- 8.4.3 Japan
- 8.4.4 Australia
- 8.4.5 South Korea
- 8.5 Latin America
- 8.5.1 Brazil
- 8.5.2 Mexico
- 8.5.3 Argentina
- 8.6 Middle East and Africa
- 8.6.1 Saudi Arabia
- 8.6.2 South Africa
- 8.6.3 UAE
Chapter 9 Company Profiles
- 9.1 Thermo Fisher Scientific
- 9.2 PerkinElmer
- 9.3 Bio-Rad Laboratories
- 9.4 Abbott Laboratories
- 9.5 Sysmex Corporation
- 9.6 NanoEnTek
- 9.7 F. Hoffmann-La Roche Ltd
- 9.8 Danaher (Beckman Coulter Inc. and Radiometer)
- 9.9 Agilent Technologies
- 9.10 Merck KGaA
- 9.11 ChemoMetec A/S
- 9.12 Logos Biosystems
- 9.13 Nexcelom Bioscience (Revvity)
- 9.14 DeNovix
- 9.15 Curiosis
 压力感测菌落计数器市场:依产品类型、技术、销售管道、应用、最终用户划分,全球预测(2026-2032年)细胞计数载玻片市场按技术、产品类型、应用、最终用户和分销管道划分,全球预测(2026-2032年)
 2026年全球细胞计数市场报告2026年全球自动化细胞计数器市场报告
 细胞计数市场 - 全球产业规模、份额、趋势、机会及预测(按产品、应用、最终用途、地区和竞争格局划分,2021-2031年)细菌菌落计数器市场 - 全球产业规模、份额、趋势、机会、预测:按类型、应用、最终用户、地区和竞争对手划分,2021-2031年自动化细胞计数市场 - 全球产业规模、份额、趋势、机会及预测(按产品、应用、最终用途、地区和竞争格局划分,2021-2031年)细胞计数和分析仪器市场(按产品类型、技术、细胞类型、应用、最终用户和销售管道),全球预测,2026-2032年
 细胞计数市场规模、份额及成长分析(按产品、应用、最终用户及地区划分)-2026-2033年产业预测血液学仪器市场按产品类型、最终用户、应用和分销管道划分 - 全球预测 2025-2032