


 |
市场调查报告书
商品编码
1892793
汽车微型马达市场机会、成长驱动因素、产业趋势分析及预测(2026-2035年)Automotive Micro Motors Market Opportunity, Growth Drivers, Industry Trend Analysis, and Forecast 2026 - 2035 |
||||||
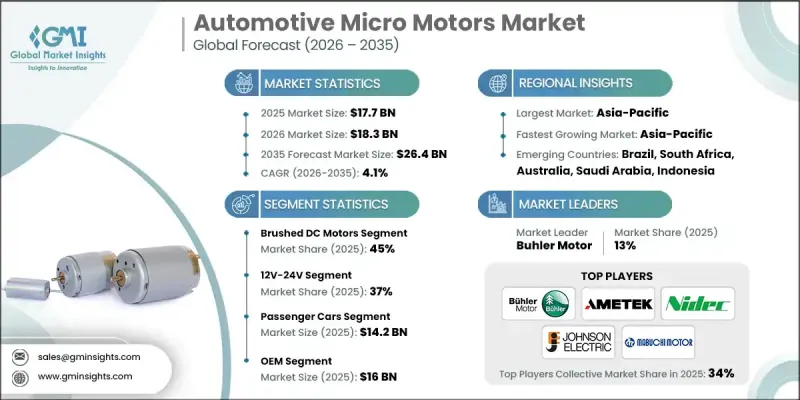
2025年全球汽车微型马达市场价值为177亿美元,预计2035年将以4.1%的复合年增长率成长至264亿美元。
电机技术的进步、生产方式的变革以及行业需求的演变正在重塑微型电机的设计和製造方式。从有刷直流马达到无刷直流(BLDC)马达的转变代表着重大的技术变革,其驱动力在于BLDC系统更高的效率、更长的使用寿命和更低的维护需求。随着半导体成本的下降和大规模生产的增加,BLDC马达在汽车应用中的成本效益日益凸显。全球电机生产商不断扩大的产能进一步提高了产品的可用性,并降低了整体生产成本,从而促进了先进电机技术在汽车行业的广泛应用。
| 市场范围 | |
|---|---|
| 起始年份 | 2025 |
| 预测年份 | 2026-2035 |
| 起始值 | 177亿美元 |
| 预测值 | 264亿美元 |
| 复合年增长率 | 4.1% |
包括NIDEC、Johnson Electric和Buhler Motor在内的多家领先的无刷直流马达製造商已提高产能,以满足汽车製造商日益增长的需求。这包括建立专门用于供应汽车应用微型马达的额外工厂,从而强化了产业向新型电机技术的转型。
2025年,有刷直流马达市占率占比45%,预计2026年至2035年将以3.2%的复合年增长率成长。这些马达仍然广泛应用于各种汽车零件,包括车窗系统、后视镜定位和座椅机构,尤其是在对成本较为敏感的车型类别中。然而,其机械换向方式存在固有的性能限制。
12V-24V马达类别在2025年占据37%的市场份额,预计到2035年将以3.5%的复合年增长率成长。此电压范围仍是汽车微型马达应用中最常用的电压范围,支援电动车窗、座椅调整、天窗和基本鼓风机系统等功能。这些马达的标准工作电压仍然是12V和24V。
预计2025年,中国汽车微型马达市场规模将达到46亿美元。中国作为全球最大的汽车製造中心,人口成长、汽车保有量增加以及旨在加速汽车电气化的扶持政策,共同推动了该地区微型马达市场的强劲需求。
活跃于全球汽车微型马达市场的公司包括AMETEK、Mabuchi Motor、Johnson Electric、Maxon Motors、NIDEC、Buhler Motor和Mitsuba。这些公司正透过策略性地扩大生产规模、提昇技术水准和丰富产品线来巩固其竞争优势。许多製造商正在扩大生产规模以满足全球汽车OEM厂商日益增长的需求,同时投资自动化以提高产品品质并降低成本。对无刷直流马达(BLDC马达)研发的重视使各公司能够顺应产业趋势,追求更高的效率和更长的使用寿命。此外,各公司还与汽车供应商建立合作关係,将马达整合到更广泛的车辆功能中。
目录
第一章:方法论与范围
第二章:执行概要
第三章:行业洞察
- 产业生态系分析
- 供应商格局
- 零件製造商
- 电机製造商和整合商
- 原始设备製造商和汽车製造商
- 售后市场通路
- 终端用户和服务网络
- 成本结构
- 利润率
- 每个阶段的价值增加
- 垂直整合趋势
- 颠覆者
- 供应商格局
- 对力的影响
- 成长驱动因素
- 汽车电气化和动力系统转型日益普及
- 舒适便利功能的普及
- 整合先进安全系统和ADAS
- 严格的排放和燃油经济法规
- 产业陷阱与挑战
- 从有刷直流电机过渡到无刷直流电机
- 模组化和系统集成
- 市场机会
- 人工智慧与预测导航
- 智慧型手机和应用程式投影系统
- 成长驱动因素
- 技术趋势与创新生态系统
- 目前技术
- 有刷直流马达与无刷直流马达技术
- 伺服马达和步进马达技术进步
- 线性执行器整合趋势
- 无磁无稀土马达研发
- 新兴技术
- 数位孪生架构及实现
- 云端运算与边缘运算的权衡
- 空中下载 (OTA) 更新
- 韧体更新功能
- 目前技术
- 成长潜力分析
- 监管环境
- SAE国际标准
- 联合国欧洲经济委员会WP.29条例
- 监理合规成本分析
- 监理路线图及未来要求
- 区域监管比较
- 北美洲
- 欧洲
- 亚太
- 拉丁美洲
- 中东和非洲
- 波特的分析
- PESTEL 分析
- 成本細項分析
- 价格趋势
- 价格套利机会
- 价格侵蚀趋势与商品化
- 原物料价格趋势的影响
- 平均售价(ASP)趋势
- 风险评估与缓解策略
- 风险识别与分类
- 合规与监理风险
- 技术与创新风险
- 风险缓解策略
- 专利分析
- 按地区分類的专利申请
- 专利授权率和时间表
- 技术专利分析
- 专利格局图
- 产品线及研发路线图
- 产品开发流程分析
- 主要参与者的技术路线图
- 研发重点领域及投资重点
- 合作研发计划
- 永续性和环境方面
- 导航系统的碳足迹
- 循环经济战略
- 永续导航功能
- 企业永续发展倡议
- 气候变迁对航行的影响
- 市场采纳与渗透分析
- 技术采纳曲线分析
- 各区域的渗透率
- 按车辆细分市场分類的渗透率
- 功能采纳分析
- 采用加速策略
- 客户和最终用户洞察
- 资格和认证要求
- OEM客户细分
- OEM痛点与未满足的需求
- 一级供应商客户分析
- 情境规划与敏感度分析
- 情境规划框架
- 基本状况
- 监管影响敏感性
- 新进入者和商业模式
- 监管影响敏感性
第四章:竞争格局
- 介绍
- 公司市占率分析
- 北美洲
- 欧洲
- 亚太
- 拉丁美洲
- 中东和非洲
- 竞争定位矩阵
- 战略展望矩阵
- 关键进展
- 併购
- 合作伙伴关係与合作
- 新产品发布
- 扩张计划和资金
- 高端定位策略
- 竞争分析与独特卖点
第五章:市场估算与预测:依汽车类型划分,2022-2035年
- 有刷直流电机
- 无刷直流电机
- 步进马达
第六章:市场估算与预测:依电力消耗量划分,2022-2035年
- 3V-12V
- 12V-24V
- 25V-48V
- 超过48伏
第七章:市场估价与预测:依车辆类型划分,2022-2035年
- 搭乘用车
- SUV
- 轿车
- 掀背车
- 商用车辆
- 低容量性状
- MCV
- C型肝炎
第八章:市场估算与预测:依应用领域划分,2022-2035年
- 电源视窗
- 挡风玻璃雨刷
- 电动辅助转向(EPS)
- 座椅调节
- 后视镜调整
- 天窗执行器
- 暖通空调系统
- 其他的
第九章:市场估算与预测:依销售管道划分,2022-2035年
- OEM
- 售后市场
第十章:市场估计与预测:依地区划分,2022-2035年
- 北美洲
- 我们
- 加拿大
- 欧洲
- 英国
- 德国
- 法国
- 义大利
- 西班牙
- 比利时
- 荷兰
- 瑞典
- 俄罗斯
- 亚太地区
- 中国
- 印度
- 日本
- 澳洲
- 新加坡
- 韩国
- 越南
- 印尼
- 拉丁美洲
- 巴西
- 墨西哥
- 阿根廷
- MEA
- 南非
- 沙乌地阿拉伯
- 阿联酋
第十一章:公司简介
- 全球参与者
- Continental
- Denso
- Garmin
- HARMAN International
- Hyundai Mobis
- Mitsubishi Electric
- Panasonic
- Robert Bosch
- Region players
- Alpine Electronics
- Clarion
- Desay SV Automotive
- JVCKENWOOD
- LG Electronics
- Marelli
- Pioneer
- Valeo
- Visteon
- 新兴玩家
- Aisin Corporation
- Dynavin
- Luxoft
- NNG Software
- Preh Car Connect
- Vinland
The Global Automotive Micro Motors Market was valued at USD 17.7 billion in 2025 and is estimated to grow at a CAGR of 4.1% to reach USD 26.4 billion by 2035.
Advancements in motor technology, changing production methods, and evolving industry requirements are reshaping the way micro motors are designed and manufactured. The shift from brushed DC motors to brushless DC (BLDC) motors represents a major technological transition, driven by the improved efficiency, longer lifespan, and reduced maintenance needs of BLDC systems. As semiconductor costs decline and large-scale production increases, BLDC motors are becoming more cost-effective for automotive applications. Expanding manufacturing capacity across global motor producers is further enhancing availability and lowering overall production expenses, supporting broader adoption of advanced motor technologies throughout the automotive sector.
| Market Scope | |
|---|---|
| Start Year | 2025 |
| Forecast Year | 2026-2035 |
| Start Value | $17.7 Billion |
| Forecast Value | $26.4 Billion |
| CAGR | 4.1% |
Multiple leading BLDC motor manufacturers, including NIDEC, Johnson Electric, and Buhler Motor, have increased their production capabilities to meet rising demand from automakers. This includes the establishment of additional facilities dedicated to supplying micro motors for automotive applications, reinforcing the industry's transition toward newer motor technologies.
The brushed DC motors segment accounted for a 45% share in 2025 and is forecasted to grow at a CAGR of 3.2% from 2026 to 2035. These motors remain widely used in various vehicle components, including window systems, mirror positioning, and seating mechanisms, especially within cost-sensitive vehicle categories. However, their mechanical commutation creates inherent performance limitations.
The 12V-24V motor category held a 37% share in 2025 and is projected to grow at a CAGR of 3.5% through 2035. This voltage range remains the most common for automotive micro motor applications, supporting functions such as power windows, seat adjustments, sunroofs, and basic blower systems. The standard operating voltages for these motors continue to be 12V and 24V.
China Automotive Micro Motors Market generated USD 4.6 billion in 2025. The region benefits from its position as the world's largest vehicle manufacturing hub, coupled with population growth, increasing vehicle ownership, and supportive policies designed to accelerate automotive electrification. These factors drive strong demand for micro motors across various vehicle systems.
Companies active in the Global Automotive Micro Motors Market include AMETEK, Mabuchi Motor, Johnson Electric, Maxon Motors, NIDEC, Buhler Motor, and Mitsuba. Companies in the Automotive Micro Motors Market are reinforcing their competitive position through strategic manufacturing expansion, technology enhancements, and diversified product offerings. Many manufacturers are scaling production facilities to meet rising demand from global automotive OEMs, while also investing in automation to improve quality and reduce cost. Emphasis on BLDC motor development allows companies to align with industry trends favoring higher efficiency and longer-lasting components. Firms are also leveraging partnerships with automotive suppliers to integrate their motors into a broader range of vehicle functions.
Table of Contents
Chapter 1 Methodology & Scope
- 1.1 Research design
- 1.1.1 Research approach
- 1.1.2 Data collection methods
- 1.2 Base estimates and calculations
- 1.2.1 Base year calculation
- 1.2.2 Key trends for market estimates
- 1.3 Forecast
- 1.4 Primary research and validation
- 1.5 Some of the primary sources
- 1.6 Data mining sources
- 1.6.1 Secondary
- 1.6.1.1 Paid Sources
- 1.6.1.2 Public Sources
- 1.6.1.3 Sources, by region
- 1.6.1 Secondary
- 1.7 Inclusion & Exclusion
Chapter 2 Executive Summary
- 2.1 Industry 360° synopsis
- 2.2 Key market trends
- 2.2.1 Regional
- 2.2.2 Motor
- 2.2.3 Power Consumption
- 2.2.4 Vehicle
- 2.2.5 Application
- 2.2.6 Sales Channel
- 2.3 TAM Analysis, 2026-2035
- 2.4 CXO perspectives: Strategic imperatives
- 2.4.1 Key decision points for industry executives
- 2.4.2 Critical success factors for market players
- 2.5 Future outlook and strategic recommendations
Chapter 3 Industry Insights
- 3.1 Industry ecosystem analysis
- 3.1.1 Supplier landscape
- 3.1.1.1 Component manufacturers
- 3.1.1.2 Motor manufacturers & integrators
- 3.1.1.3 OEMs & vehicle manufacturers
- 3.1.1.4 Aftermarket distribution channels
- 3.1.1.5 End use & service networks
- 3.1.2 Cost structure
- 3.1.3 Profit margin
- 3.1.4 Value addition at each stage
- 3.1.5 Vertical integration trends
- 3.1.6 Disruptors
- 3.1.1 Supplier landscape
- 3.2 Impact on forces
- 3.2.1 Growth drivers
- 3.2.1.1 Rising vehicle electrification & powertrain shift
- 3.2.1.2 Proliferation of comfort & convenience features
- 3.2.1.3 Integration of advanced safety & ADAS
- 3.2.1.4 Stringent emission & fuel economy regulations
- 3.2.2 Industry pitfalls & challenges
- 3.2.2.1 Shift from Brushed DC to Brushless DC (BLDC) Motors
- 3.2.2.2 Modularization & system integration
- 3.2.3 Market opportunities
- 3.2.3.1 AI & predictive navigation
- 3.2.3.2 Smartphone & app projection systems
- 3.2.1 Growth drivers
- 3.3 Technology trends & innovation ecosystem
- 3.3.1 Current technologies
- 3.3.1.1 Brushed vs brushless DC motor technologies
- 3.3.1.2 Servo & Stepper motor advancements
- 3.3.1.3 Linear Actuator integration trends
- 3.3.1.4 Magnet-free & rare-earth-free motor development
- 3.3.2 Emerging technologies
- 3.3.2.1 Digital twin architecture & implementation
- 3.3.2.2 Cloud vs Edge processing trade-offs
- 3.3.2.3 Over-the-Air (OTA) updates
- 3.3.2.4 Firmware update capabilities
- 3.3.1 Current technologies
- 3.4 Growth potential analysis
- 3.5 Regulatory landscape
- 3.5.1 SAE international standards
- 3.5.2 UNECE WP.29 regulations
- 3.5.3 Regulatory compliance cost analysis
- 3.5.4 Regulatory roadmap & future requirements
- 3.5.5 Regional regulatory comparison
- 3.5.5.1 North America
- 3.5.5.2 Europe
- 3.5.5.3 Asia-Pacific
- 3.5.5.4 Latin America
- 3.5.5.5 Middle East & Africa
- 3.6 Porter's analysis
- 3.7 PESTEL analysis
- 3.8 Cost breakdown analysis
- 3.9 Price trends
- 3.9.1 Price arbitrage opportunities
- 3.9.2 Price erosion trends & commoditization
- 3.9.3 Impact of raw material price trends
- 3.9.4 Average Selling Price (ASP) Trends
- 3.10 Risk assessment & mitigation strategies
- 3.10.1 Risk identification & classification
- 3.10.2 Compliance & regulatory risks
- 3.10.3 Technology & innovation risks
- 3.10.4 Risk mitigation strategies
- 3.11 Patent analysis
- 3.11.1 Patent filings by region
- 3.11.2 Patent grant rates & timelines
- 3.11.3 Technology-specific patent analysis
- 3.11.4 Patent landscape mapping
- 3.12 Product Pipeline & R&D Roadmap
- 3.12.1 Product development pipeline analysis
- 3.12.2 Technology roadmap by key players
- 3.12.3 R&D focus areas & investment priorities
- 3.12.4 Collaborative R&D initiatives
- 3.13 Sustainability and environmental aspects
- 3.13.1 Carbon footprint of navigation systems
- 3.13.2 Circular economic strategies
- 3.13.3 Sustainable navigation features
- 3.13.4 Corporate sustainability initiatives
- 3.13.5 Climate change impact on navigation
- 3.14 Market adoption & penetration analysis
- 3.14.1 Technology adoption curve analysis
- 3.14.2 Penetration rates by region
- 3.14.3 Penetration rates by vehicle segment
- 3.14.4 Feature adoption analysis
- 3.14.5 Adoption acceleration strategies
- 3.15 Customer & End use insights
- 3.15.1 Qualification & certification requirements
- 3.15.2 OEM customer segmentation
- 3.15.3 OEM pain points & unmet needs
- 3.15.4 Tier-1 supplier customer analysis
- 3.16 Scenario planning & sensitivity analysis
- 3.16.1 Scenario planning framework
- 3.16.2 Base case scenario
- 3.16.3 Regulatory impact sensitivity
- 3.16.4 New entrants & business models
- 3.16.5 Regulatory impact sensitivity
Chapter 4 Competitive Landscape, 2025
- 4.1 Introduction
- 4.2 Company market share analysis
- 4.2.1 North America
- 4.2.2 Europe
- 4.2.3 Asia-Pacific
- 4.2.4 Latin America
- 4.2.5 Middle East & Africa
- 4.3 Competitive positioning matrix
- 4.4 Strategic outlook matrix
- 4.5 Key developments
- 4.5.1 Mergers & acquisitions
- 4.5.2 Partnerships & collaborations
- 4.5.3 New product launches
- 4.5.4 Expansion plans and funding
- 4.6 Premium positioning strategies
- 4.7 Competitive analysis and USPs
Chapter 5 Market Estimates & Forecast, By Motor, 2022 - 2035 ($Bn, Units)
- 5.1 Key trends
- 5.2 Brushed DC Motors
- 5.3 Brushless DC Motors
- 5.4 Stepper Motors
Chapter 6 Market Estimates & Forecast, By Power Consumption, 2022 - 2035 ($Bn, units)
- 6.1 Key trends
- 6.2 3V-12V
- 6.3 12V-24V
- 6.4 25V-48V
- 6.5 More than 48V
Chapter 7 Market Estimates & Forecast, By Vehicle, 2022 - 2035 ($Bn, Units)
- 7.1 Key trends
- 7.2 Passenger Cars
- 7.2.1 SUV
- 7.2.2 Sedan
- 7.2.3 Hatchback
- 7.3 Commercial Vehicles
- 7.3.1 LCV
- 7.3.2 MCV
- 7.3.3 HCV
Chapter 8 Market Estimates & Forecast, By Application, 2022 - 2035 ($Bn, Units)
- 8.1 Key trends
- 8.2 Power Windows
- 8.3 Windshield Wipers
- 8.4 Electric Power Steering (EPS)
- 8.5 Seat Adjustments
- 8.6 Mirror Adjustments
- 8.7 Sunroof Actuators
- 8.8 HVAC Systems
- 8.9 Others
Chapter 9 Market Estimates & Forecast, By Sales Channel, 2022 - 2035 ($Bn, Units)
- 9.1 Key trends
- 9.2 OEM
- 9.3 Aftermarket
Chapter 10 Market Estimates & Forecast, By Region, 2022 - 2035 ($Bn, Units)
- 10.1 North America
- 10.1.1 US
- 10.1.2 Canada
- 10.2 Europe
- 10.2.1 UK
- 10.2.2 Germany
- 10.2.3 France
- 10.2.4 Italy
- 10.2.5 Spain
- 10.2.6 Belgium
- 10.2.7 Netherlands
- 10.2.8 Sweden
- 10.2.9 Russia
- 10.3 Asia Pacific
- 10.3.1 China
- 10.3.2 India
- 10.3.3 Japan
- 10.3.4 Australia
- 10.3.5 Singapore
- 10.3.6 South Korea
- 10.3.7 Vietnam
- 10.3.8 Indonesia
- 10.4 Latin America
- 10.4.1 Brazil
- 10.4.2 Mexico
- 10.4.3 Argentina
- 10.5 MEA
- 10.5.1 South Africa
- 10.5.2 Saudi Arabia
- 10.5.3 UAE
Chapter 11 Company Profiles
- 11.1 Global players
- 11.1.1 Continental
- 11.1.2 Denso
- 11.1.3 Garmin
- 11.1.4 HARMAN International
- 11.1.5 Hyundai Mobis
- 11.1.6 Mitsubishi Electric
- 11.1.7 Panasonic
- 11.1.8 Robert Bosch
- 11.2 Region players
- 11.2.1 Alpine Electronics
- 11.2.2 Clarion
- 11.2.3 Desay SV Automotive
- 11.2.4 JVCKENWOOD
- 11.2.5 LG Electronics
- 11.2.6 Marelli
- 11.2.7 Pioneer
- 11.2.8 Valeo
- 11.2.9 Visteon
- 11.3 Emerging players
- 11.3.1 Aisin Corporation
- 11.3.2 Dynavin
- 11.3.3 Luxoft
- 11.3.4 NNG Software
- 11.3.5 Preh Car Connect
- 11.3.6 Vinland


