


 |
市场调查报告书
商品编码
1892839
自行车功率计市场机会、成长驱动因素、产业趋势分析及预测(2026-2035年)Cycling Power Meter Market Opportunity, Growth Drivers, Industry Trend Analysis, and Forecast 2026 - 2035 |
||||||
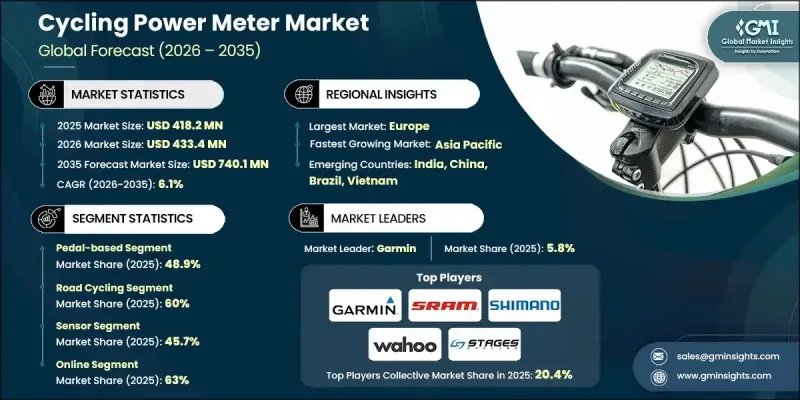
2025 年全球自行车功率计市场价值为 4.182 亿美元,预计到 2035 年将以 6.1% 的复合年增长率增长至 7.401 亿美元。
人们对健身、耐力训练和性能优化的日益关注,持续推动着自行车功率计在休閒骑行者和竞技骑行者中的广泛应用。骑乘者将精准的功率监测放在首位,以提高效率、降低受伤风险并维持结构化的训练计画。随着健身文化的普及和越来越多的人参与有组织的活动和长距离比赛,对可靠功率测量工具的需求也在稳步增长。快速的创新进一步提升了功率计的市场吸引力,使其能够惠及精英运动员以外的更广泛用户群。更优质的材料、更完善的校准系统和更持久的电池,都增强了产品的可靠性和易用性。这些进步反映了消费者对精准、即时资料的需求不断变化,这些数据有助于衡量骑乘表现的提升。随着技术的普及和用户友好性的提高,功率计正逐渐从专业的训练工具转变为专业骑乘者的主流性能配件。
| 市场范围 | |
|---|---|
| 起始年份 | 2025 |
| 预测年份 | 2026-2035 |
| 起始值 | 4.182亿美元 |
| 预测值 | 7.401亿美元 |
| 复合年增长率 | 6.1% |
2025年,脚踏式功率计市占率达到48.9%,预计2035年将以4.4%的复合年增长率成长。其市场主导地位归功于安装简单、便于携带以及兼容多种自行车。双面脚踏式功率计可提供更详细的生物力学数据,而目前的创新重点在于提高精度、延长电池续航力和降低堆迭高度。儘管成熟市场的普及率趋于稳定,但拥有多辆自行车的骑乘者持续保持对功率计的需求。
2025年,公路车市场占据了60%的份额,预计到2035年将达到3.605亿美元。公路自行车骑乘者高度依赖稳定的功率资料进行训练,受益于可预测的骑乘环境和成熟的性能框架。职业级别的曝光度有助于维持品牌知名度,而未来的成长预计将来自寻求便捷易用的功率解决方案的休閒骑乘者。
预计到2025年,美国自行车功率计市场规模将达到1.075亿美元。美国地形多样,自行车社群庞大,且广泛参与竞技和耐力赛等活动,这些因素持续支撑着市场需求。凭藉全年适宜的骑乘条件和成熟的自行车文化,美国仍然是北美地区功率计普及应用的核心市场。
目录
第一章:方法论
第二章:执行概要
第三章:行业洞察
- 产业生态系分析
- 供应商格局
- 利润率分析
- 成本结构
- 每个阶段的价值增加
- 影响价值链的因素
- 中断
- 产业影响因素
- 成长驱动因素
- 以绩效为基础的培训方式日益普及
- 感测器精度和连接性的进步
- 扩大竞技自行车赛事
- 可支配收入增加和高端健身支出成长
- 与智能训练和人工智慧分析的集成
- 产业陷阱与挑战
- 初始成本高,维护负担重。
- 技术复杂性和使用者认知度低
- 市场机会
- 对智慧室内训练设备的需求不断增长
- 拓展新兴自行车市场
- 轻量化和模组化设计的开发
- 以永续发展为导向的製造方式的发展
- 成长潜力分析
- 监管环境
- 全球监管概览
- 北美监理框架
- 欧洲监管框架
- 亚太地区监理框架
- 拉丁美洲监管框架
- 中东和非洲监管框架
- 安全标准与认证
- 网路安全和资料隐私法规
- 环境与排放法规
- 监理合规成本分析
- 全球监管概览
- 波特的分析
- PESTEL 分析
- 技术与创新格局
- 当前技术趋势
- 踏板式功率计
- 曲柄式功率计
- 基于集线器的功率计
- 基于链轮/蜘蛛爪的功率计
- 新兴技术
- 人工智慧驱动的预测训练系统
- 光学/雷射传动系统感测器
- 具有整合功率测量功能的智慧骑行鞋
- 电动自行车整合功率计
- 当前技术趋势
- 价格趋势
- 按地区
- 副产品
- 生产统计
- 生产中心
- 消费中心
- 进出口
- 定价分析与市场经济学
- 价格趋势概述
- 按车辆类型定价
- 区域定价差异
- 总拥有成本 (TCO) 分析
- 政府激励措施和补贴的影响
- 未来价格展望
- 成本細項分析
- 製造成本结构
- 研发成本分析
- 监理合规成本
- 分销和物流成本
- 行销和销售成本
- 保固及售后成本
- 成本削减路线图
- 专利分析
- 永续性和环境方面
- 永续实践
- 减少废弃物策略
- 生产中的能源效率
- 环保倡议
- 碳足迹考量
- 最终使用者行为分析
- 消费者采纳模式
- 品牌忠诚度与转换行为
- 未来行为趋势
- 风险评估与缓解框架
- 技术风险
- 监理与合规风险
- 供应链风险
- 市场和竞争风险
- 财务风险
- 风险优先矩阵
- 未来展望与机会
第四章:竞争格局
- 介绍
- 公司市占率分析
- 北美洲
- 欧洲
- 亚太地区
- 拉丁美洲
- MEA
- 主要市场参与者的竞争分析
- 竞争定位矩阵
- 战略展望矩阵
- 关键进展
- 併购
- 合作伙伴关係与合作
- 新产品发布
- 扩张计划和资金
第五章:市场估算与预测:依电錶划分,2022-2035年
- 基于踏板
- 曲柄式
- 基于中心的
- 五通
- 其他的
第六章:市场估算与预测:依应用领域划分,2022-2035年
- 公路自行车
- 登山车
- 室内训练
- 其他的
第七章:市场估算与预测:依配销通路划分,2022-2035年
- 在线的
- 离线
第八章:市场估算与预测:依技术划分,2022-2035年
- 感应器
- 功率测量
- 电源
- 数据连接
- ANT+
- 蓝牙智能/BLE
第九章:市场估计与预测:依地区划分,2022-2035年
- 北美洲
- 我们
- 加拿大
- 欧洲
- 德国
- 英国
- 法国
- 义大利
- 西班牙
- 俄罗斯
- 北欧
- 葡萄牙
- 克罗埃西亚
- 亚太地区
- 中国
- 印度
- 日本
- 澳洲
- 韩国
- 新加坡
- 泰国
- 印尼
- 越南
- 拉丁美洲
- 巴西
- 墨西哥
- 阿根廷
- MEA
- 南非
- 沙乌地阿拉伯
- 阿联酋
- 土耳其
第十章:公司简介
- 全球参与者
- Garmin
- SRAM / Quarq
- Stages Cycling
- Favero
- SRM
- Power2 Max
- Innovations
- Wahoo Fitness
- Shimano
- Campagnolo
- Pioneer Electronics
- 区域玩家
- Magene
- Sigeyi
- XCADEY
- INPEAK
- Elite
- Bryton
- Polar Electro
- Easton Cycling
- Specialized
- Praxis Works
- Giant
- TBS Group
- PowerTap
- Emerging Technology Innovators
- BMC Switzerland
- bePRO (Healthcare Tech)
- CycleOps (Saris)
- Arofly
- Xplova
- IQSquare
- WatTeam
The Global Cycling Power Meter Market was valued at USD 418.2 million in 2025 and is estimated to grow at a CAGR of 6.1% to reach USD 740.1 million by 2035.
Rising interest in fitness, endurance training, and performance optimization continues to drive widespread adoption of cycling power meters among both recreational and competitive riders. Cyclists are prioritizing accurate workload monitoring to enhance efficiency, reduce injury risks, and maintain structured training programs. As fitness culture expands and more individuals participate in organized events and long-distance competitions, the demand for reliable power measurement tools grows steadily. Rapid innovation is further accelerating market appeal, enabling the technology to reach a broader user base beyond elite athletes. Enhanced materials, improved calibration systems, and longer-lasting batteries have strengthened product reliability and usability. These advancements mirror shifting consumer expectations for precise, real-time data that supports measurable performance improvement. With technology becoming more accessible and user-friendly, power meters are steadily transitioning from a specialized training tool to a mainstream performance accessory for dedicated cyclists.
| Market Scope | |
|---|---|
| Start Year | 2025 |
| Forecast Year | 2026-2035 |
| Start Value | $418.2 Million |
| Forecast Value | $740.1 Million |
| CAGR | 6.1% |
The pedal-based power meter segment held 48.9% share in 2025 and is expected to grow at a CAGR of 4.4% through 2035. Its dominance is attributed to straightforward installation, portability, and compatibility across multiple bikes. Dual-sided pedal options provide detailed biomechanical insights, and current innovation focuses on enhanced accuracy, longer battery performance, and reduced stack height. Although adoption levels in established markets are stabilizing, continued interest among multi-bike riders sustains demand.
The road cycling category accounted for a 60% share in 2025 and is projected to reach USD 360.5 million by 2035. Road riders rely heavily on consistent power data for training, benefiting from predictable riding environments and established performance frameworks. Professional-level visibility helps maintain brand awareness, and future growth is expected to come from recreational cyclists seeking accessible, simplified power solutions.
US Cycling Power Meter Market was valued at USD 107.5 million in 2025. The country's diverse terrain, extensive cycling communities, and widespread participation in competitive and endurance events continue to support sustained demand. With year-round riding opportunities and a mature cycling culture, the US remains a central hub for power meter adoption across North America.
Key players in the Global Cycling Power Meter Market include 4iiii Innovations, Favero, Garmin, Pioneer Cycle Sports, Power2max, Shimano, SRAM, Stages Cycling, and Wahoo. Companies within the Cycling Power Meter Market are using several strategies to strengthen their competitive position. Many brands are prioritizing continual sensor refinement to improve accuracy and responsiveness, ensuring consistent performance across varied riding environments. Manufacturers are expanding compatibility with major cycling ecosystems, including head units, training apps, and smart indoor platforms, to enhance user integration. Partnerships with professional athletes, teams, and coaches serve as influential marketing tools that boost product credibility among consumers. Firms are also improving durability, reducing device weight, and extending battery life to meet the expectations of high-performance users.
Table of Contents
Chapter 1 Methodology
- 1.1 Market scope and definition
- 1.2 Research design
- 1.2.1 Research approach
- 1.2.2 Data collection methods
- 1.3 Data mining sources
- 1.3.1 Global
- 1.3.2 Regional/Country
- 1.4 Base estimates and calculations
- 1.4.1 Base year calculation
- 1.4.2 Key trends for market estimation
- 1.5 Primary research and validation
- 1.5.1 Primary sources
- 1.6 Forecast model
- 1.7 Research assumptions and limitations
Chapter 2 Executive Summary
- 2.1 Industry 360° synopsis, 2022 - 2035
- 2.2 Key market trends
- 2.2.1 Regional
- 2.2.2 Power meter type
- 2.2.3 Application
- 2.2.4 Distribution channel
- 2.2.5 Technology
- 2.3 TAM Analysis, 2026-2035
- 2.4 CXO perspectives: Strategic imperatives
- 2.4.1 Executive decision points
- 2.4.2 Critical success factors
- 2.5 Future outlook and strategic recommendations
Chapter 3 Industry Insights
- 3.1 Industry ecosystem analysis
- 3.1.1 Supplier landscape
- 3.1.2 Profit margin analysis
- 3.1.3 Cost structure
- 3.1.4 Value addition at each stage
- 3.1.5 Factor affecting the value chain
- 3.1.6 Disruptions
- 3.2 Industry impact forces
- 3.2.1.1 Growth drivers
- 3.2.1.2 Growing adoption of performance-based training
- 3.2.1.3 Advancements in sensor accuracy and connectivity
- 3.2.1.4 Expansion of competitive cycling events
- 3.2.1.5 Rising disposable income and premium fitness spending
- 3.2.1.6 Integration with smart training and AI analytics
- 3.2.2 Industry pitfalls and challenges
- 3.2.2.1 High initial cost and maintenance burden
- 3.2.2.2 Technical complexity and low user awareness
- 3.2.3 Market opportunities
- 3.2.3.1 Rising demand for smart indoor training equipment
- 3.2.3.2 Expansion into emerging cycling markets
- 3.2.3.3 Development of lightweight and modular designs
- 3.2.3.4 Growth in sustainability-focused manufacturing approaches
- 3.3 Growth potential analysis
- 3.4 Regulatory landscape
- 3.4.1 Global regulatory overview
- 3.4.1.1 North America regulatory framework
- 3.4.1.2 Europe regulatory framework
- 3.4.1.3 Asia Pacific regulatory framework
- 3.4.1.4 Latin America regulatory framework
- 3.4.1.5 Middle East & Africa regulatory framework
- 3.4.2 Safety standards & certifications
- 3.4.3 Cybersecurity & data privacy regulations
- 3.4.4 Environmental & emissions regulations
- 3.4.5 Regulatory compliance cost analysis
- 3.4.1 Global regulatory overview
- 3.5 Porter's analysis
- 3.6 PESTEL analysis
- 3.7 Technology and innovation landscape
- 3.7.1 Current technological trends
- 3.7.1.1 Pedal-based power meters
- 3.7.1.2 Crank-based power meters
- 3.7.1.3 Hub-based power meters
- 3.7.1.4 Chainring/Spider-based power meters
- 3.7.2 Emerging technologies
- 3.7.2.1 AI-powered predictive training systems
- 3.7.2.2 Optical/laser drivetrain sensors
- 3.7.2.3 Smart cycling shoes with integrated power measurement
- 3.7.2.4 E-bike integrated power meters
- 3.7.1 Current technological trends
- 3.8 Price trends
- 3.8.1 By region
- 3.8.2 By product
- 3.9 Production statistics
- 3.9.1 Production hubs
- 3.9.2 Consumption hubs
- 3.9.3 Export and import
- 3.10 Pricing analysis & market economics
- 3.10.1 Pricing trends overview
- 3.10.2 Pricing by vehicle type
- 3.10.3 Regional pricing variations
- 3.10.4 Total cost of ownership (TCO) analysis
- 3.10.5 Government incentives & subsidies impact
- 3.10.6 Future pricing outlook
- 3.11 Cost breakdown analysis
- 3.11.1 Manufacturing cost structure
- 3.11.2 R&D cost analysis
- 3.11.3 Regulatory compliance costs
- 3.11.4 Distribution & logistics costs
- 3.11.5 Marketing & sales costs
- 3.11.6 Warranty & aftersales costs
- 3.11.7 Cost reduction roadmap
- 3.12 Patent analysis
- 3.13 Sustainability and environmental aspects
- 3.13.1 Sustainable practices
- 3.13.2 Waste reduction strategies
- 3.13.3 Energy efficiency in production
- 3.13.4 Eco-friendly Initiatives
- 3.13.5 Carbon footprint considerations
- 3.14 End use behavior analysis
- 3.14.1 Consumer adoption patterns
- 3.14.2 Brand loyalty & switching behavior
- 3.14.3 Future behavior trends
- 3.15 Risk assessment & mitigation framework
- 3.15.1 Technology risks
- 3.15.2 Regulatory & compliance risks
- 3.15.3 Supply chain risks
- 3.15.4 Market & competitive risks
- 3.15.5 Financial risks
- 3.15.6 Risk prioritization matrix
- 3.16 Future outlook & opportunities
Chapter 4 Competitive Landscape, 2025
- 4.1 Introduction
- 4.2 Company market share analysis
- 4.2.1 North America
- 4.2.2 Europe
- 4.2.3 Asia Pacific
- 4.2.4 LATAM
- 4.2.5 MEA
- 4.3 Competitive analysis of major market players
- 4.4 Competitive positioning matrix
- 4.5 Strategic outlook matrix
- 4.6 Key developments
- 4.6.1 Mergers & acquisitions
- 4.6.2 Partnerships & collaborations
- 4.6.3 New Product Launches
- 4.6.4 Expansion Plans and funding
Chapter 5 Market Estimates & Forecast, By Power Meter, 2022-2035 (USD Mn, Units)
- 5.1 Key trends
- 5.1.1 Pedal-based
- 5.1.2 Crank-based
- 5.1.3 Hub-based
- 5.1.4 Bottom bracket
- 5.1.5 Others
Chapter 6 Market Estimates & Forecast, By Application, 2022 - 2035 (USD Mn, Units)
- 6.1 Key trends
- 6.2 Road cycling
- 6.3 Mountain biking
- 6.4 Indoor training
- 6.5 Others
Chapter 7 Market Estimates & Forecast, By Distribution Channel, 2022 - 2035 (USD Mn, Units)
- 7.1 Key trends
- 7.2 Online
- 7.3 Offline
Chapter 8 Market Estimates & Forecast, By Technology, 2022 - 2035 (USD Mn, Units)
- 8.1 Key trends
- 8.2 Sensor
- 8.3 Power Measurement
- 8.4 Power Source
- 8.5 Data Connectivity
- 8.5.1 ANT+
- 8.5.2 Bluetooth Smart / BLE
Chapter 9 Market Estimates & Forecast, By Region, 2022 - 2035 (USD Mn, Units)
- 9.1 Key trends
- 9.2 North America
- 9.2.1 US
- 9.2.2 Canada
- 9.3 Europe
- 9.3.1 Germany
- 9.3.2 UK
- 9.3.3 France
- 9.3.4 Italy
- 9.3.5 Spain
- 9.3.6 Russia
- 9.3.7 Nordics
- 9.3.8 Portugal
- 9.3.9 Croatia
- 9.4 Asia Pacific
- 9.4.1 China
- 9.4.2 India
- 9.4.3 Japan
- 9.4.4 Australia
- 9.4.5 South Korea
- 9.4.6 Singapore
- 9.4.7 Thailand
- 9.4.8 Indonesia
- 9.4.9 Vietnam
- 9.5 Latin America
- 9.5.1 Brazil
- 9.5.2 Mexico
- 9.5.3 Argentina
- 9.6 MEA
- 9.6.1 South Africa
- 9.6.2 Saudi Arabia
- 9.6.3 UAE
- 9.6.4 Turkey
Chapter 10 Company Profiles
- 10.1 Global Players
- 10.1.1 Garmin
- 10.1.2 SRAM / Quarq
- 10.1.3 Stages Cycling
- 10.1.4 Favero
- 10.1.5 SRM
- 10.1.6. Power2 Max
- 10.1.7 Innovations
- 10.1.8 Wahoo Fitness
- 10.1.9 Shimano
- 10.1.10 Campagnolo
- 10.1.11 Pioneer Electronics
- 10.2 Regional Players
- 10.2.1 Magene
- 10.2.2 Sigeyi
- 10.2.3 XCADEY
- 10.2.4 INPEAK
- 10.2.5 Elite
- 10.2.6 Bryton
- 10.2.7 Polar Electro
- 10.2.8 Easton Cycling
- 10.2.9 Specialized
- 10.2.10 Praxis Works
- 10.2.11 Giant
- 10.2.12 TBS Group
- 10.2.13 PowerTap
- 10.3 Emerging Technology Innovators
- 10.3.1 BMC Switzerland
- 10.3.2 bePRO (Healthcare Tech)
- 10.3.3 CycleOps (Saris)
- 10.3.4 Arofly
- 10.3.5 Xplova
- 10.3.6 IQSquare
- 10.3.7 WatTeam


