


 |
市场调查报告书
商品编码
1892842
泵浦市场机会、成长驱动因素、产业趋势分析及预测(2026-2035年)Pumps Market Opportunity, Growth Drivers, Industry Trend Analysis, and Forecast 2026 - 2035 |
||||||
2025年全球泵浦市场价值为809亿美元,预计到2035年将以4.3%的复合年增长率成长至1,248亿美元。
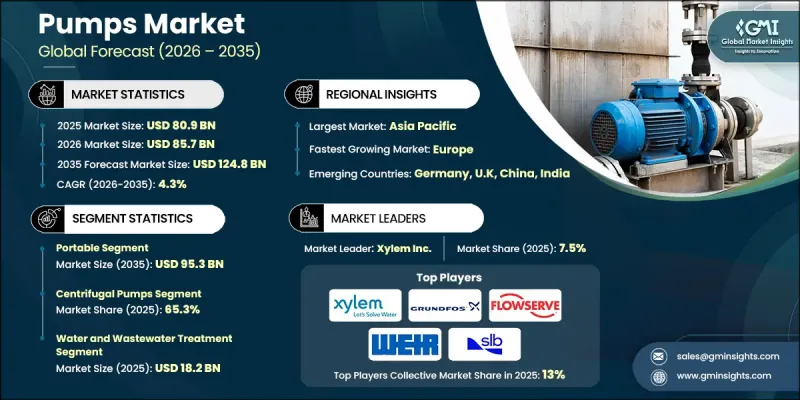
快速的工业化和城市化进程推动了市场扩张,全球对可靠泵送解决方案的需求日益增长。新兴经济体的基础设施建设快速发展,对生活供水、污水处理和工业流程中的泵浦提出了更高的要求。泵浦技术的进步提高了效率和永续性,使製造商能够在满足全球环境标准的同时降低能耗。节能设计和创新解决方案有助于终端用户节省营运成本,并与全球节能减排的努力相契合。市政服务、工业设施和能源密集型行业等领域对泵浦的日益普及,巩固了泵浦市场在预测期内的稳定成长。石油和天然气行业仍然是泵浦的主要终端用户,因为这些设备对于开采、提炼和运输活动至关重要。即使在市场波动和营运需求不断变化的情况下,泵浦也能提供可靠的性能。
| 市场范围 | |
|---|---|
| 起始年份 | 2025 |
| 预测年份 | 2026-2035 |
| 起始值 | 809亿美元 |
| 预测值 | 1248亿美元 |
| 复合年增长率 | 4.3% |
2025年,便携式帮浦市场规模达到605亿美元,预计2035年将达953亿美元。便携式泵浦具有移动性、适应性和易用性等优点,因此在建筑、农业、采矿、石油和天然气、市政服务和消防等各个行业都发挥着重要作用。
到 2025 年,离心泵市场份额将达到 65.3%,这得益于其高效、多功能以及能够处理各种流体和流量,使其成为工业和市政应用中不可或缺的工具。
2025年,美国泵浦市场预计将占据85.7%的份额,这主要得益于对水和废水处理基础设施的投资以及包括氢气生产和碳捕获在内的能源技术的进步。在这些项目中,高性能泵浦正被越来越多地用于处理低温和化学流体。
目录
第一章:方法论与范围
第二章:执行概要
第三章:行业洞察
- 产业生态系分析
- 供应商格局
- 利润率
- 每个阶段的价值增加
- 影响价值链的因素
- 产业影响因素
- 成长驱动因素
- 工业成长
- 水和废水管理
- 基础设施建设
- 产业陷阱与挑战
- 高初始投资
- 营运成本
- 机会
- 水和污水处理基础设施的成长
- 能源转型与工业脱碳
- 成长驱动因素
- 成长潜力分析
- 未来市场趋势
- 技术与创新格局
- 当前技术趋势
- 新兴技术
- 价格趋势
- 按类型
- 按地区
- 监管环境
- 标准和合规要求
- 区域监理框架
- 认证标准
- 贸易统计(HS编码8431)
- 主要进口国
- 主要出口国
- 差距分析
- 风险评估与缓解
- 波特的分析
- PESTEL 分析
第四章:竞争格局
- 介绍
- 公司市占率分析
- 按地区
- 公司矩阵分析
- 主要市场参与者的竞争分析
- 竞争定位矩阵
- 关键进展
- 併购
- 合作伙伴关係与合作
- 新产品发布
- 扩张计划
第五章:市场估算与预测:依类型划分,2022-2035年
- 便携的
- 文具
第六章:市场估算与预测:依市场定位划分,2022-2035年
- 潜水器
- 非潜水式
- 表面安装式泵浦
- 直列泵浦
- 底座式抽水机
第七章:市场估算与预测:以驱动力划分,2022-2035年
- 引擎驱动
- 电动
第八章:市场估算与预测:依技术划分,2022-2035年
- 离心泵
- 轴流泵
- 径向流泵
- 混流泵
- 悬臂式叶轮泵
- 轴承帮浦之间
- 直立式悬挂泵浦
- 容积式泵
- 互惠
- 旋转
- 蠕动帮浦
- 专业和新兴技术
- 无密封磁力驱动泵
- 罐式马达泵
- 气动双隔膜泵
- 可控制容积计量泵
- 再生式涡轮泵
- 智慧型帮浦和物联网系统
第九章:市场估计与预测:依产能与压力范围划分,2022-2035年
- 流量容量
- 低流量
- 中等流量
- 高流量
- 流量非常高
- 压力范围
- 低压
- 中压
- 高压
- 超高压
第十章:市场估计与预测:依最终用途划分,2022-2035年
- 矿业
- 建筑施工
- 石油和天然气
- 一般工业
- 水和废水处理
- 化学品
- 发电
- 其他(农业等)
第十一章:市场估价与预测:依配销通路划分,2022-2035年
- 直销
- 间接销售
第十二章:市场估算与预测:依地区划分,2022-2035年
- 北美洲
- 我们
- 加拿大
- 欧洲
- 德国
- 法国
- 英国
- 义大利
- 西班牙
- 亚太地区
- 中国
- 印度
- 日本
- 韩国
- 澳洲
- 拉丁美洲
- 巴西
- 墨西哥
- 阿根廷
- MEA
- 南非
- 沙乌地阿拉伯
- 阿联酋
第十三章:公司简介
- Alfa Laval
- Atlas Copco
- Baker Hughes
- Ebara
- Flowserve
- Grundfos
- ITT
- Kirloskar
- KSB
- Pentair
- SLB
- Sulzer
- Weir Group
- Wilo
- Xylem
The Global Pumps Market was valued at USD 80.9 billion in 2025 and is estimated to grow at a CAGR of 4.3% to reach USD 124.8 billion by 2035.
Market expansion is driven by rapid industrialization and urbanization, which are increasing the demand for reliable pumping solutions worldwide. Emerging economies are witnessing significant infrastructure development, creating heightened requirements for pumps in domestic water supply, wastewater treatment, and industrial processes. Advances in pump technologies are enhancing efficiency and sustainability, enabling manufacturers to reduce energy consumption while meeting global environmental standards. Energy-efficient designs and innovative solutions are supporting operational cost savings for end-users and aligning with global efforts to reduce energy consumption. Increasing adoption across sectors such as municipal services, industrial facilities, and energy-intensive industries reinforces the steady growth of the pumps market over the forecast period. The oil & gas sector remains a key end-user of pumps, as these devices are essential for extraction, refining, and transportation activities. Pumps provide reliable performance even under fluctuating market conditions and evolving operational requirements.
| Market Scope | |
|---|---|
| Start Year | 2025 |
| Forecast Year | 2026-2035 |
| Start Value | $80.9 Billion |
| Forecast Value | $124.8 Billion |
| CAGR | 4.3% |
The portable pump segment generated USD 60.5 billion in 2025 and is projected to reach USD 95.3 billion by 2035. Their mobility, adaptability, and ease of use make portable pumps essential across industries, including construction, agriculture, mining, oil and gas, municipal services, and firefighting.
The centrifugal pump segment held 65.3% share in 2025, driven by their high efficiency, versatility, and ability to handle a wide range of fluids and flow rates, making them indispensable in industrial and municipal applications.
U.S. Pumps Market held an 85.7% share in 2025, supported by investments in water and wastewater treatment infrastructure and advancements in energy technologies, including hydrogen production and carbon capture. High-performance pumps are increasingly deployed for handling cryogenic and chemical fluids across these initiatives.
Key players in the Global Pumps Market include Xylem, KSB, Atlas Copco, Alfa Laval, Flowserve, SLB, Sulzer, ITT, Pentair, Wilo, Baker Hughes, Ebara, Kirloskar, Grundfos, and Weir Group. Companies in the Global Pumps Market strengthen their market presence by focusing on product innovation, including energy-efficient, durable, and high-capacity pumps. Expanding global manufacturing and distribution networks enables wider market reach and faster delivery to end-users. Strategic collaborations with industrial and municipal clients ensure long-term contracts and repeat business. R&D investments allow companies to develop solutions that meet evolving regulatory standards and sustainability goals. After-sales service, training programs, and digital monitoring solutions improve customer satisfaction and loyalty. Targeted marketing campaigns and participation in infrastructure development projects further consolidate their foothold and maintain competitiveness in regional and global markets.
Table of Contents
Chapter 1 Methodology & Scope
- 1.1 Market scope and definition
- 1.2 Research design
- 1.2.1 Research approach
- 1.2.2 Data collection methods
- 1.3 Data mining sources
- 1.3.1 Global
- 1.3.2 Regional/Country
- 1.4 Base estimates and calculations
- 1.4.1 Base year calculation
- 1.4.2 Key trends for market estimation
- 1.5 Primary research and validation
- 1.5.1 Primary sources
- 1.6 Forecast model
- 1.7 Research assumptions and limitations
Chapter 2 Executive Summary
- 2.1 Industry 3600 synopsis
- 2.2 Key market trends
- 2.2.1 Regional
- 2.2.2 Type
- 2.2.3 Position
- 2.2.4 Driving force
- 2.2.5 Technology
- 2.2.6 Capacity and pressure range
- 2.2.7 End use
- 2.2.8 Distribution channel
- 2.3 CXO perspectives: Strategic imperatives
- 2.3.1 Key decision points for industry executives
- 2.3.2 Critical success factors for market players
- 2.4 Future outlook and strategic recommendations
Chapter 3 Industry Insights
- 3.1 Industry ecosystem analysis
- 3.1.1 Supplier landscape
- 3.1.2 Profit margin
- 3.1.3 Value addition at each stage
- 3.1.4 Factor affecting the value chain
- 3.2 Industry impact forces
- 3.2.1 Growth drivers
- 3.2.1.1 Industrial growth
- 3.2.1.2 Water and wastewater management
- 3.2.1.3 Infrastructure development
- 3.2.2 Industry pitfalls & challenges
- 3.2.2.1 High initial investment
- 3.2.2.2 Operational costs
- 3.2.3 Opportunities
- 3.2.3.1 Growth in water & wastewater infrastructure
- 3.2.3.2 Energy transition & industrial decarbonization
- 3.2.1 Growth drivers
- 3.3 Growth potential analysis
- 3.4 Future market trends
- 3.5 Technology and innovation landscape
- 3.5.1 Current technological trends
- 3.5.2 Emerging technologies
- 3.6 Price trends
- 3.6.1 By Type
- 3.6.2 By Region
- 3.7 Regulatory landscape
- 3.7.1 Standards and compliance requirements
- 3.7.2 Regional regulatory frameworks
- 3.7.3 Certification standards
- 3.8 Trade statistics (HS code 8431)
- 3.8.1 Major importing countries
- 3.8.2 Major exporting countries
- 3.9 Gap analysis
- 3.10 Risk assessment and mitigation
- 3.11 Porter's analysis
- 3.12 PESTEL analysis
Chapter 4 Competitive Landscape, 2025
- 4.1 Introduction
- 4.2 Company market share analysis
- 4.2.1 By region
- 4.2.1.1 North America
- 4.2.1.2 Europe
- 4.2.1.3 Asia Pacific
- 4.2.1.4 Latin America
- 4.2.1.5 Middle East and Africa
- 4.2.1 By region
- 4.3 Company matrix analysis
- 4.4 Competitive analysis of major market players
- 4.5 Competitive positioning matrix
- 4.6 Key developments
- 4.6.1 Mergers & acquisitions
- 4.6.2 Partnerships & collaborations
- 4.6.3 New product launches
- 4.6.4 Expansion plans
Chapter 5 Market Estimates & Forecast, By Type, 2022-2035 (USD Billion) (Thousand Units)
- 5.1 Portable
- 5.2 Stationary
Chapter 6 Market Estimates & Forecast, By Position, 2022-2035 (USD Billion) (Thousand Units)
- 6.1 Key trends
- 6.2 Submersible
- 6.3 Non-submersible
- 6.3.1 Surface-mounted pumps
- 6.3.2 Inline pumps
- 6.3.3 Base-mounted pumps
Chapter 7 Market Estimates & Forecast, By Driving Force, 2022-2035 (USD Billion) (Thousand Units)
- 7.1 Key trends
- 7.2 Engine-driven
- 7.3 Electric-driven
Chapter 8 Market Estimates & Forecast, By Technology, 2022-2035 (USD Billion) (Thousand Units)
- 8.1 Key trends
- 8.2 Centrifugal pump
- 8.2.1 Axial flow pump
- 8.2.2 Radial flow pump
- 8.2.3 Mixed flow pump
- 8.2.4 Overhung impeller pumps
- 8.2.5 Between bearing pumps
- 8.2.6 Vertically suspended pumps
- 8.3 Positive displacement pump
- 8.3.1 Reciprocating
- 8.3.2 Rotary
- 8.3.3 Peristaltic pumps
- 8.4 Specialty and emerging technologies
- 8.4.1 Sealless and magnetic drive pumps
- 8.4.2 Canned motor pumps
- 8.4.3 Air-operated double diaphragm (AODD) pumps
- 8.4.4 Controlled-volume metering pumps
- 8.4.5 Regenerative turbine pumps
- 8.4.6 Smart pumps and IoT-enabled systems
Chapter 9 Market Estimates & Forecast, By Capacity And Pressure Range, 2022-2035 (USD Billion) (Thousand Units)
- 9.1 Key trends
- 9.2 Flow rate capacity
- 9.2.1 Low flow
- 9.2.2 Medium flow
- 9.2.3 High flow
- 9.2.4 Very high flow
- 9.3 Pressure range
- 9.3.1 Low pressure
- 9.3.2 Medium pressure
- 9.3.3 High pressure
- 9.3.4 Ultra-high pressure
Chapter 10 Market Estimates & Forecast, By End Use, 2022-2035 (USD Billion) (Thousand Units)
- 10.1 Key trends
- 10.2 Mining
- 10.3 Building & construction
- 10.4 Oil & gas
- 10.5 General industries
- 10.6 Water & wastewater treatment
- 10.7 Chemicals
- 10.8 Power generation
- 10.9 Others (agriculture etc.)
Chapter 11 Market Estimates & Forecast, By Distribution Channel, 2022-2035 (USD Billion) (Thousand Units)
- 11.1 Key trends
- 11.2 Direct sales
- 11.3 Indirect sales
Chapter 12 Market Estimates & Forecast, By Region, 2022-2035 (USD Billion) (Thousand Units)
- 12.1 Key trends
- 12.2 North America
- 12.2.1 U.S.
- 12.2.2 Canada
- 12.3 Europe
- 12.3.1 Germany
- 12.3.2 France
- 12.3.3 UK
- 12.3.4 Italy
- 12.3.5 Spain
- 12.4 Asia Pacific
- 12.4.1 China
- 12.4.2 India
- 12.4.3 Japan
- 12.4.4 South Korea
- 12.4.5 Australia
- 12.5 Latin America
- 12.5.1 Brazil
- 12.5.2 Mexico
- 12.5.3 Argentina
- 12.6 MEA
- 12.6.1 South Africa
- 12.6.2 Saudi Arabia
- 12.6.3 UAE
Chapter 13 Company Profiles
- 13.1 Alfa Laval
- 13.2 Atlas Copco
- 13.3 Baker Hughes
- 13.4 Ebara
- 13.5 Flowserve
- 13.6 Grundfos
- 13.7 ITT
- 13.8 Kirloskar
- 13.9 KSB
- 13.10 Pentair
- 13.11 SLB
- 13.12 Sulzer
- 13.13 Weir Group
- 13.14 Wilo
- 13.15 Xylem
 植入式涡流帮浦市场:依产品类型、额定功率、材料类型、技术、密封类型、流量、应用、最终用户、通路划分,全球预测(2026-2032)垂直排水泵组市场:按泵浦类型、流量、扬程、马达功率、驱动系统、材质、销售管道、最终用户和应用划分-全球预测,2026-2032年碳酸化泵浦市场:按泵浦类型、材质、驱动系统、输出功率、应用及最终用户产业划分-全球预测,2026-2032年小型分离式冷凝水泵市场按产品类型、材料、用途、最终用户应用和分销管道划分,全球预测(2026-2032年)按级数、材质、流量、驱动类型和最终用途行业分類的嵌入式叶轮泵市场—全球预测,2026-2032年气动双向隔膜帮浦市场依产品类型、流量、帮浦材料、终端用户产业和销售管道,全球预测,2026-2032年全球高流量气泵市场(按产品类型、分销管道、应用和终端用户产业划分)预测(2026-2032年)卧式磁力驱动搅拌机市场:依容量范围、额定功率、终端用户产业、应用和销售管道,全球预测(2026-2032年)微型蠕动帮浦市场按帮浦类型、驱动技术、材料、管径、流量范围、配置、压力范围、客製化程度、终端用户产业和应用进行划分-全球预测,2026-2032年
 全球校准泵市场规模、份额、趋势和成长分析报告(2026-2034年)