


 |
市场调查报告书
商品编码
1892846
食品磷酸盐市场机会、成长驱动因素、产业趋势分析及预测(2026-2035年)Food Phosphate Market Opportunity, Growth Drivers, Industry Trend Analysis, and Forecast 2026 - 2035 |
||||||
2025 年全球食品磷酸盐市场价值为 59 亿美元,预计到 2035 年将以 7.3% 的复合年增长率增长至 119 亿美元。
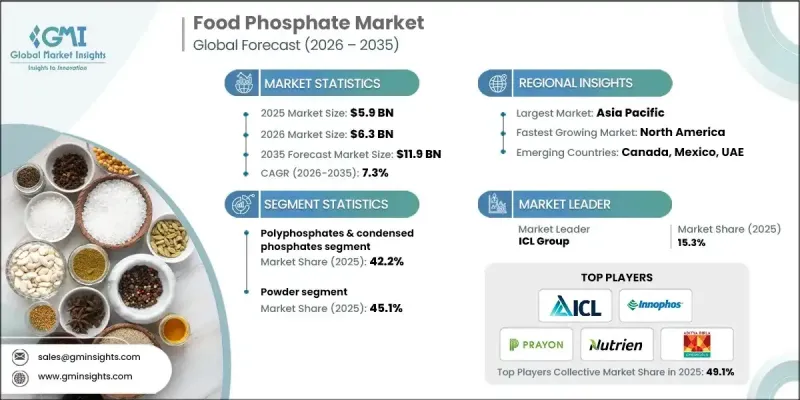
市场成长得益于加工和包装食品需求的持续成长,这些食品依赖功能性添加剂来维持品质、一致性和货架稳定性。食品磷酸盐,包括广泛商业化的钠基、钾基和钙基磷酸盐,在改善质地、保持水分和支持大规模食品生产中的配方稳定性方面发挥关键作用。快速的城市化、饮食习惯的改变以及时间紧迫的生活方式持续推动着方便食品消费的成长,从而增强了长期需求。亚太地区在全球市场销售方面领先,这得益于人口增长、城市食品消费的扩大以及包装食品形式的快速普及。北美市场成长速度更快,这主要得益于蛋白质加工和烘焙食品类别的强劲需求,以及先进的食品加工基础设施。加工食品摄取量的增加、工业化食品生产以及持续的配方创新,共同为全球食品磷酸盐产业的持续扩张创造了有利条件。
| 市场范围 | |
|---|---|
| 起始年份 | 2025 |
| 预测年份 | 2026-2035 |
| 起始值 | 59亿美元 |
| 预测值 | 119亿美元 |
| 复合年增长率 | 7.3% |
2025 年,聚磷酸盐和缩合磷酸盐市占率为 42.2%,预计到 2035 年将以 7.1% 的复合年增长率成长。它们的领先地位与其多功能性能有关,例如保水、成分稳定和提高产品一致性,这些特性支持其在各种食品加工应用中的广泛应用。
由于粉状食品磷酸盐具有储存稳定性好、易于操作以及与大批量生产流程相容等优点,预计到2025年,其市场份额将达到45.1%。粉状食品磷酸盐在多种食品配方中表现稳定,支撑了强劲的市场需求;同时,其他物理形态的粉状食品磷酸盐在需要控制溶解度的应用中也越来越受欢迎。
预计2026年至2035年,北美食品磷酸盐市场将以7.2%的复合年增长率成长。环境高效生产方法的不断进步以及与以永续发展为中心的製造实践的日益契合,正在塑造区域需求模式。
目录
第一章:方法论与范围
第二章:执行概要
第三章:行业洞察
- 产业生态系分析
- 供应商格局
- 利润率
- 每个阶段的价值增加
- 影响价值链的因素
- 中断
- 产业影响因素
- 成长驱动因素
- 对加工食品和方便食品的需求不断增长
- 肉类和海鲜加工业的发展
- 烘焙和糖果业的扩张
- 产业陷阱与挑战
- 对磷酸盐添加剂的健康担忧和负面看法
- 清洁标章运动与消费者偏好转变
- 市场机会
- 开发清洁标籤磷酸盐溶液
- 注重健康的消费者的钙基磷酸盐替代品
- 成长驱动因素
- 成长潜力分析
- 监管环境
- 北美洲
- 欧洲
- 亚太地区
- 拉丁美洲
- 中东和非洲
- 波特的分析
- PESTEL 分析
- 价格趋势
- 按地区
- 副产品
- 未来市场趋势
- 技术与创新格局
- 当前技术趋势
- 新兴技术
- 专利格局
- 贸易统计(HS编码)(註:仅提供重点国家的贸易统计资料)
- 主要进口国
- 主要出口国
- 永续性和环境方面
- 永续实践
- 减少废弃物策略
- 生产中的能源效率
- 环保倡议
- 碳足迹考量
第四章:竞争格局
- 介绍
- 公司市占率分析
- 按地区
- 北美洲
- 欧洲
- 亚太地区
- 拉丁美洲
- MEA
- 按地区
- 公司矩阵分析
- 主要市场参与者的竞争分析
- 竞争定位矩阵
- 关键进展
- 併购
- 合作伙伴关係与合作
- 新产品发布
- 扩张计划
第五章:市场估算与预测:依产品划分,2022-2035年
- 正磷酸盐
- 正磷酸钠
- 磷酸钾
- 正磷酸钙
- 磷酸镁
- 磷酸铵
- 多聚磷酸盐和缩合磷酸盐
- 焦磷酸盐(二磷酸盐)
- 三聚磷酸盐
- 六偏磷酸盐
- 三偏磷酸盐
- 磷酸(食品级)
- 其他的
第六章:市场估算与预测:依产品类型划分,2022-2035年
- 粉末
- 颗粒状
- 液体和溶液
- 其他的
第七章:市场估计与预测:依应用领域划分,2022-2035年
- 肉类和海鲜加工
- 新鲜及冷冻肉类
- 加工腌製肉类
- 家禽产品
- 海鲜及鱼类产品
- 其他的
- 麵包店
- 麵包和捲饼
- 蛋糕和糕点
- 饼干和曲奇
- 泡打粉和混合粉
- 其他的
- 乳製品
- 冰淇淋和冷冻甜点
- 加工起起司和起司酱
- 优格及发酵产品
- 其他的
- 饮料
- 果汁和果浆
- 碳酸软性饮料
- 运动饮料和能量饮料
- 咖啡伴侣和奶精
- 其他的
- 加工食品及方便食品
- 即食餐
- 汤和酱料
- 泡麵
- 其他的
- 糖果
- 糖果和甜点
- 口香糖
- 其他的
- 其他的
第八章:市场估算与预测:依地区划分,2022-2035年
- 北美洲
- 我们
- 加拿大
- 欧洲
- 德国
- 英国
- 法国
- 西班牙
- 义大利
- 欧洲其他地区
- 亚太地区
- 中国
- 印度
- 日本
- 澳洲
- 韩国
- 亚太其他地区
- 拉丁美洲
- 巴西
- 墨西哥
- 阿根廷
- 拉丁美洲其他地区
- 中东和非洲
- 沙乌地阿拉伯
- 南非
- 阿联酋
- 中东和非洲其他地区
第九章:公司简介
- Aditya Birla Chemicals
- FBC Industries, Inc
- Fosfa AS
- ICL Group
- Innophos, Inc
- Nippon Chemical Industrial Co., Ltd.
- Nutrien Ltd
- Prayon
- Sulux Phosphates
- TKI Hrastnik
- Xingfa Group
The Global Food Phosphate Market was valued at USD 5.9 billion in 2025 and is estimated to grow at a CAGR of 7.3% to reach USD 11.9 billion by 2035.
Market growth is supported by the steady rise in demand for processed and packaged food products that rely on functional additives to maintain quality, consistency, and shelf stability. Food phosphates, including widely commercialized sodium-, potassium-, and calcium-based variants, play a critical role in improving texture, maintaining moisture, and supporting formulation stability across large-scale food manufacturing. Rapid urbanization, changing dietary habits, and time-constrained lifestyles continue to increase the consumption of convenience foods, which strengthens long-term demand. Asia Pacific leads the global market in volume terms, supported by population growth, expanding urban food consumption, and the rapid penetration of packaged food formats. North America is showing faster expansion, driven by strong demand across protein processing and baked food categories, supported by advanced food processing infrastructure. The convergence of higher processed food intake, industrial-scale food production, and ongoing formulation innovation continues to create favorable conditions for the sustained expansion of the global food phosphate industry.
| Market Scope | |
|---|---|
| Start Year | 2025 |
| Forecast Year | 2026-2035 |
| Start Value | $5.9 Billion |
| Forecast Value | $11.9 Billion |
| CAGR | 7.3% |
The polyphosphates and condensed phosphates segment accounted for a 42.2% share in 2025 and is projected to grow at a CAGR of 7.1% through 2035. Their dominance is linked to multifunctional performance attributes such as moisture retention, ingredient stabilization, and improved product consistency, which support wide adoption across diverse food processing applications.
The powdered food phosphates segment held 45.1% share in 2025 due to their storage stability, ease of handling, and compatibility with high-volume manufacturing processes. Their consistent performance across multiple food formulations supports strong demand, while alternative physical forms continue to gain traction in applications requiring controlled solubility.
North America Food Phosphate Market is expected to grow at a CAGR of 7.2% from 2026 to 2035. Ongoing advancements in environmentally efficient production methods and increasing alignment with sustainability-focused manufacturing practices are shaping regional demand patterns.
Key companies active in the Global Food Phosphate Market include Prayon, Innophos, ICL Group, Nutrien Ltd, Aditya Birla Chemicals, Fosfa A.S, Nippon Chemical Industrial Co., Ltd., Xingfa Group, TKI Hrastnik, Sulux Phosphates, and FBC Industries, Inc. Companies operating in the Global Food Phosphate Market are strengthening their market position through capacity expansions, process optimization, and targeted investments in sustainable production technologies. Many players are focusing on improving product purity, functional performance, and formulation flexibility to align with evolving food manufacturing requirements. Strategic partnerships with food processors help secure long-term supply agreements and application-specific innovation. Geographic expansion into high-growth regions remains a priority to capture rising processed food demand. Additionally, companies are enhancing regulatory compliance capabilities and exploring alternative sourcing strategies to improve supply chain resilience and reinforce brand credibility in global markets.
Table of Contents
Chapter 1 Methodology & Scope
- 1.1 Market scope and definition
- 1.2 Research design
- 1.2.1 Research approach
- 1.2.2 Data collection methods
- 1.3 Data mining sources
- 1.3.1 Global
- 1.3.2 Regional/Country
- 1.4 Base estimates and calculations
- 1.4.1 Base year calculation
- 1.4.2 Key trends for market estimation
- 1.5 Primary research and validation
- 1.5.1 Primary sources
- 1.6 Forecast model
- 1.7 Research assumptions and limitations
Chapter 2 Executive Summary
- 2.1 Industry 360° synopsis
- 2.2 Key market trends
- 2.2.1 Regional
- 2.2.2 Product
- 2.2.3 Form
- 2.2.4 Application
- 2.3 TAM Analysis, 2026-2035
- 2.4 CXO perspectives: Strategic imperatives
- 2.4.1 Executive decision points
- 2.4.2 Critical success factors
- 2.5 Future Outlook and Strategic Recommendations
Chapter 3 Industry Insights
- 3.1 Industry ecosystem analysis
- 3.1.1 Supplier landscape
- 3.1.2 Profit margin
- 3.1.3 Value addition at each stage
- 3.1.4 Factor affecting the value chain
- 3.1.5 Disruptions
- 3.2 Industry impact forces
- 3.2.1 Growth drivers
- 3.2.1.1 Rising demand for processed & convenience foods
- 3.2.1.2 Growing meat & seafood processing industry
- 3.2.1.3 Expansion of bakery & confectionery sector
- 3.2.2 Industry pitfalls and challenges
- 3.2.2.1 Health concerns & negative perception of phosphate additives
- 3.2.2.2 Clean-label movement & consumer preference shift
- 3.2.3 Market opportunities
- 3.2.3.1 Development of clean-label phosphate solutions
- 3.2.3.2 Calcium-based phosphate alternatives for health-conscious consumers
- 3.2.1 Growth drivers
- 3.3 Growth potential analysis
- 3.4 Regulatory landscape
- 3.4.1 North America
- 3.4.2 Europe
- 3.4.3 Asia Pacific
- 3.4.4 Latin America
- 3.4.5 Middle East & Africa
- 3.5 Porter's analysis
- 3.6 PESTEL analysis
- 3.7 Price trends
- 3.7.1 By region
- 3.7.2 By product
- 3.8 Future market trends
- 3.9 Technology and innovation landscape
- 3.9.1 Current technological trends
- 3.9.2 Emerging technologies
- 3.10 Patent Landscape
- 3.11 Trade statistics (HS code) ( Note: the trade statistics will be provided for key countries only)
- 3.11.1 Major importing countries
- 3.11.2 Major exporting countries
- 3.12 Sustainability and environmental aspects
- 3.12.1 Sustainable practices
- 3.12.2 Waste reduction strategies
- 3.12.3 Energy efficiency in production
- 3.12.4 Eco-friendly initiatives
- 3.13 Carbon footprint consideration
Chapter 4 Competitive Landscape, 2025
- 4.1 Introduction
- 4.2 Company market share analysis
- 4.2.1 By region
- 4.2.1.1 North America
- 4.2.1.2 Europe
- 4.2.1.3 Asia Pacific
- 4.2.1.4 LATAM
- 4.2.1.5 MEA
- 4.2.1 By region
- 4.3 Company matrix analysis
- 4.4 Competitive analysis of major market players
- 4.5 Competitive positioning matrix
- 4.6 Key developments
- 4.6.1 Mergers & acquisitions
- 4.6.2 Partnerships & collaborations
- 4.6.3 New Product Launches
- 4.6.4 Expansion Plans
Chapter 5 Market Estimates and Forecast, By Product, 2022-2035 (USD Billion) (Kilo Tons)
- 5.1 Key trends
- 5.2 Orthophosphates
- 5.2.1 Sodium orthophosphates
- 5.2.2 Potassium orthophosphates
- 5.2.3 Calcium orthophosphates
- 5.2.4 Magnesium phosphates
- 5.2.5 Ammonium phosphates
- 5.3 Polyphosphates & condensed phosphates
- 5.3.1 Pyrophosphates (diphosphates)
- 5.3.2 Tripolyphosphates
- 5.3.3 Hexametaphosphates
- 5.3.4 Trimetaphosphates
- 5.4 Phosphoric acid (food grade)
- 5.5 Others
Chapter 6 Market Estimates and Forecast, By Form, 2022-2035 (USD Billion) (Kilo Tons)
- 6.1 Key trends
- 6.2 Powder
- 6.3 Granular
- 6.4 Liquid & solution
- 6.5 Others
Chapter 7 Market Estimates and Forecast, By Application, 2022-2035 (USD Billion) (Kilo Tons)
- 7.1 Key trends
- 7.2 Meat & seafood processing
- 7.2.1 Fresh & frozen meat
- 7.2.2 Processed & cured meats
- 7.2.3 Poultry products
- 7.2.4 Seafood & fish products
- 7.2.5 Others
- 7.3 Bakery
- 7.3.1 Breads & rolls
- 7.3.2 Cakes & pastries
- 7.3.3 Biscuits & cookies
- 7.3.4 Baking powders & mixes
- 7.3.5 Others
- 7.4 Dairy
- 7.4.1 Ice cream & frozen desserts
- 7.4.2 Processed cheese & cheese spreads
- 7.4.3 Yogurt & cultured products
- 7.4.4 Others
- 7.5 Beverages
- 7.5.1 Fruit juices & nectars
- 7.5.2 Carbonated soft drinks
- 7.5.3 Sports & energy drinks
- 7.5.4 Coffee creamers & whiteners
- 7.5.5 Others
- 7.6 Processed & convenience foods
- 7.6.1 Ready meals
- 7.6.2 Soups & sauces
- 7.6.3 Instant noodles
- 7.6.4 Others
- 7.7 Confectionery
- 7.7.1 Candies & sweets
- 7.7.2 Chewing gum
- 7.7.3 Others
- 7.8 Others
Chapter 8 Market Estimates and Forecast, By Region, 2022-2035 (USD Billion) (Kilo Tons)
- 8.1 Key trends
- 8.2 North America
- 8.2.1 U.S.
- 8.2.2 Canada
- 8.3 Europe
- 8.3.1 Germany
- 8.3.2 UK
- 8.3.3 France
- 8.3.4 Spain
- 8.3.5 Italy
- 8.3.6 Rest of Europe
- 8.4 Asia Pacific
- 8.4.1 China
- 8.4.2 India
- 8.4.3 Japan
- 8.4.4 Australia
- 8.4.5 South Korea
- 8.4.6 Rest of Asia Pacific
- 8.5 Latin America
- 8.5.1 Brazil
- 8.5.2 Mexico
- 8.5.3 Argentina
- 8.5.4 Rest of Latin America
- 8.6 Middle East and Africa
- 8.6.1 Saudi Arabia
- 8.6.2 South Africa
- 8.6.3 UAE
- 8.6.4 Rest of Middle East and Africa
Chapter 9 Company Profiles
- 9.1 Aditya Birla Chemicals
- 9.2 FBC Industries, Inc
- 9.3 Fosfa A.S
- 9.4 ICL Group
- 9.5 Innophos, Inc
- 9.6 Nippon Chemical Industrial Co., Ltd.
- 9.7 Nutrien Ltd
- 9.8 Prayon
- 9.9 Sulux Phosphates
- 9.10 TKI Hrastnik
- 9.11 Xingfa Group
