


 |
市场调查报告书
商品编码
1892863
燃气阀门市场机会、成长驱动因素、产业趋势分析及预测(2026-2035年)Gas Valve Market Opportunity, Growth Drivers, Industry Trend Analysis, and Forecast 2026 - 2035 |
||||||
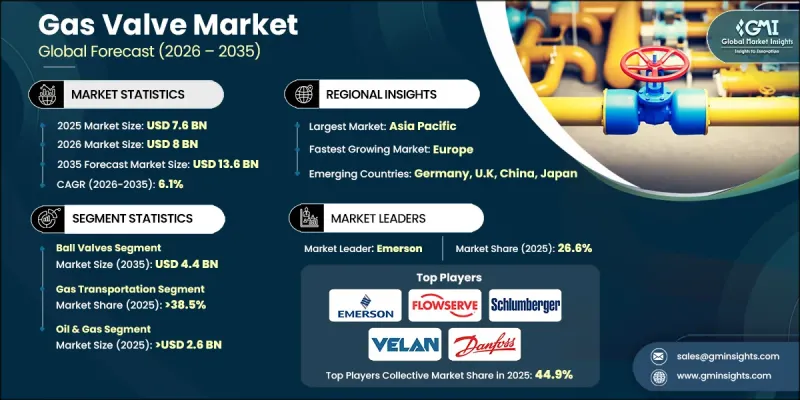
2025年全球燃气阀门市场价值为76亿美元,预计到2035年将以6.1%的复合年增长率增长至136亿美元。
人们日益关注降低能源消耗,加速了高效能燃气阀门技术的普及,促使製造商加大节能阀门解决方案的产量。全球监管机构不断收紧安全和性能标准,促使企业升级设计、材料和控制系统。美国能源部强制执行的、符合 ANSI 和 CSA 2024 指南的要求,进一步强化了对适用于公用事业和工业环境的先进合规阀门系统的需求。随着技术应用的普及,物联网 (IoT) 整合的兴起正在改变整个行业,为智慧燃气阀门铺平了道路,使用户能够远端监控系统性能、即时检测问题并优化燃气流量。这些进步正在重塑竞争格局,并鼓励製造商加大研发投入,以满足不断变化的安全、效率和自动化需求。
| 市场范围 | |
|---|---|
| 起始年份 | 2025 |
| 预测年份 | 2026-2035 |
| 起始值 | 76亿美元 |
| 预测值 | 136亿美元 |
| 复合年增长率 | 6.1% |
2025年球阀市场规模达24亿美元,预计2035年将攀升至44亿美元。球阀能够提供可靠的流量控制、快速关闭和增强的洩漏预防能力,使其成为现代燃气系统中必不可少的组件,对运行性能和安全性都至关重要。
受全球对天然气作为更清洁替代燃料的需求不断增长的推动,预计到2025年,天然气运输领域将占据38.5%的市场份额。随着管道网路的延伸和基础设施升级的加速,燃气阀门在确保流量控制、可靠性和系统保护方面发挥着至关重要的作用。艾默生电气等公司仍然是满足大型输电环境中这些需求的领先供应商之一。
预计到2025年,美国天然气阀门市占率将达到73%。美国庞大的天然气基础设施及其在液化天然气(LNG)出口领域的领先地位,进一步推动了市场成长。 LNG产量的不断增长和管道的持续扩建,显着提升了上游、中游和出口设施对低温和高压阀门的需求。
目录
第一章:方法论与范围
第二章:执行概要
第三章:行业洞察
- 产业生态系分析
- 供应商格局
- 利润率
- 每个阶段的价值增加
- 影响价值链的因素
- 产业影响因素
- 成长驱动因素
- 天然气需求不断成长
- 快速工业化
- 再生能源併网
- 产业陷阱与挑战
- 监理合规
- 原物料价格波动
- 机会
- 氢能和液化天然气基础设施的成长
- 采用智慧和物联网阀门
- 成长驱动因素
- 成长潜力分析
- 未来市场趋势
- 技术与创新格局
- 当前技术趋势
- 新兴技术
- 价格趋势
- 依产品类型
- 按地区
- 监管环境
- 标准和合规要求
- 区域监理框架
- 认证标准
- 贸易统计(HS编码84818090)
- 主要进口国
- 主要出口国
- 差距分析
- 风险评估与缓解
- 波特的分析
- PESTEL 分析
第四章:竞争格局
- 介绍
- 公司市占率分析
- 按地区
- 公司矩阵分析
- 主要市场参与者的竞争分析
- 竞争定位矩阵
- 关键进展
- 併购
- 合作伙伴关係与合作
- 新产品发布
- 扩张计划
第五章:市场估算与预测:依产品类型划分,2022-2035年
- 闸阀
- 控制阀
- 球阀
- 蝶阀
- 旋塞阀
- 其他(针阀、截止阀、排水阀等)
第六章:市场规模估算与预测(2022-2035年)
- 小于1英寸
- 介于 1 到 6 英吋之间
- 7 至 25 英寸
- 介于 26 至 50 英吋之间
- 大于 50 英寸
第七章:市场估算与预测:依材料分类,2022-2035年
- 不銹钢
- 碳钢
- 黄铜
- 合金及特殊材料
第八章:市场估算与预测:依应用领域划分,2022-2035年
- 供气管
- 灌装装置
- 散装储罐
- 天然气运输
- 储槽和管道
- 其他的
第九章:市场估算与预测:依最终用途划分,2022-2035年
- 水和废水
- 餐饮
- 化学品
- 製药
- 纸浆和造纸
- 石油和天然气
- 力量
- 半导体
- 其他的
第十章:市场估价与预测:依配销通路划分,2022-2035年
- 直销
- 间接销售
第十一章:市场估计与预测:按地区划分,2022-2035年
- 北美洲
- 我们
- 加拿大
- 欧洲
- 德国
- 法国
- 英国
- 义大利
- 西班牙
- 亚太地区
- 中国
- 印度
- 日本
- 韩国
- 澳洲
- 拉丁美洲
- 巴西
- 墨西哥
- 阿根廷
- MEA
- 南非
- 沙乌地阿拉伯
- 阿联酋
第十二章:公司简介
- China Yuanda Valve
- CNNC Sufa Technology
- Crane
- Dalian DV Valve
- Danfoss
- Emerson Electric
- Flowserve
- Henan Kaifeng High Pressure Valve
- Neway
- Pentair
- Schlumberger
- Shandong Yidu Valve
- SWI Valve
- Velan
- Watts
The Global Gas Valve Market was valued at USD 7.6 billion in 2025 and is estimated to grow at a CAGR of 6.1% to reach USD 13.6 billion by 2035.
Growing attention toward reducing energy consumption is accelerating the shift toward high-efficiency gas valve technologies, which has prompted manufacturers to increase production of energy-saving valve solutions. Regulatory bodies worldwide continue tightening safety and performance standards, prompting companies to upgrade designs, materials, and control systems. Requirements enforced by the U.S. Department of Energy that align with ANSI and CSA 2024 guidelines are reinforcing the need for advanced and compliant valve systems suitable for installations in utility and industrial environments. As technology adoption grows, the rise of IoT integration is transforming the industry, paving the way for smart gas valves that enable users to remotely monitor system performance, detect issues in real time, and optimize gas flow. These advancements are reshaping the competitive landscape and encouraging manufacturers to invest heavily in R&D to stay ahead of evolving safety, efficiency, and automation expectations.
| Market Scope | |
|---|---|
| Start Year | 2025 |
| Forecast Year | 2026-2035 |
| Start Value | $7.6 Billion |
| Forecast Value | $13.6 Billion |
| CAGR | 6.1% |
The ball valves segment reached USD 2.4 billion in 2025 and is projected to climb to USD 4.4 billion by 2035. Their ability to provide dependable flow control, rapid shut-off, and enhanced leak prevention makes them essential components in modern gas systems, supporting both operational performance and safety.
The gas transportation segment accounted for a 38.5% share in 2025, supported by expanding global demand for natural gas as a cleaner alternative fuel. As pipeline networks extend and infrastructure upgrades accelerate, gas valves play a crucial role in ensuring controlled flow, reliability, and system protection. Companies such as Emerson Electric remain among the leading suppliers addressing these needs in large-scale transmission environments.
U.S. Gas Valve Market captured 73% share in 2025. Growth is reinforced by the nation's extensive natural gas infrastructure and its leading position in LNG exports. Rising LNG output and ongoing pipeline expansions have significantly boosted the requirement for cryogenic and high-pressure valves used across upstream, midstream, and export facilities.
Prominent companies operating in the Global Gas Valve Market include Emerson Electric, Flowserve, Danfoss, Crane, Pentair, Velan, Watts, Neway, CNNC Sufa Technology, China Yuanda Valve, Henan Kaifeng High Pressure Valve, Schlumberger, SWI Valve, Shandong Yidu Valve, and Dalian DV Valve. To strengthen their Gas Valve Market foothold, companies in the Gas Valve Market focus on developing high-efficiency, regulation-compliant technologies that address tightening global standards. Many manufacturers are expanding their smart valve offerings by incorporating sensors, automation features, and remote monitoring capabilities to support digital asset management. Firms are also investing in advanced materials and engineering upgrades to improve durability in high-pressure, cryogenic, and corrosive environments. Strategic partnerships with energy companies, pipeline operators, and industrial facilities help streamline product integration and increase long-term contracts.
Table of Contents
Chapter 1 Methodology & Scope
- 1.1 Market scope and definition
- 1.2 Research design
- 1.2.1 Research approach
- 1.2.2 Data collection methods
- 1.3 Data mining sources
- 1.3.1 Global
- 1.3.2 Regional/Country
- 1.4 Base estimates and calculations
- 1.4.1 Base year calculation
- 1.4.2 Key trends for market estimation
- 1.5 Primary research and validation
- 1.5.1 Primary sources
- 1.6 Forecast model
- 1.7 Research assumptions and limitations
Chapter 2 Executive Summary
- 2.1 Industry 3600 synopsis
- 2.2 Key market trends
- 2.2.1 Regional
- 2.2.2 Product Type
- 2.2.3 Size
- 2.2.4 Material
- 2.2.5 Application
- 2.2.6 End Use
- 2.2.7 Distribution channel
- 2.3 CXO perspectives: Strategic imperatives
- 2.3.1 Key decision points for industry executives
- 2.3.2 Critical success factors for market players
- 2.4 Future outlook and strategic recommendations
Chapter 3 Industry Insights
- 3.1 Industry ecosystem analysis
- 3.1.1 Supplier landscape
- 3.1.2 Profit margin
- 3.1.3 Value addition at each stage
- 3.1.4 Factor affecting the value chain
- 3.2 Industry impact forces
- 3.2.1 Growth drivers
- 3.2.1.1 Increasing demand for natural gas
- 3.2.1.2 Rapid industrialization
- 3.2.1.3 Renewable energy integration
- 3.2.2 Industry pitfalls & challenges
- 3.2.2.1 Regulatory compliance
- 3.2.2.2 Price volatility of raw materials
- 3.2.3 Opportunities
- 3.2.3.1 Growth in hydrogen & LNG infrastructure
- 3.2.3.2 Adoption of smart & IoT-enabled valves
- 3.2.1 Growth drivers
- 3.3 Growth potential analysis
- 3.4 Future market trends
- 3.5 Technology and innovation landscape
- 3.5.1 Current technological trends
- 3.5.2 Emerging technologies
- 3.6 Price trends
- 3.6.1 By Product type
- 3.6.2 By Region
- 3.7 Regulatory landscape
- 3.7.1 Standards and compliance requirements
- 3.7.2 Regional regulatory frameworks
- 3.7.3 Certification standards
- 3.8 Trade statistics (HS code 84818090)
- 3.8.1 Major importing countries
- 3.8.2 Major exporting countries
- 3.9 Gap analysis
- 3.10 Risk assessment and mitigation
- 3.11 Porter's analysis
- 3.12 PESTEL analysis
Chapter 4 Competitive Landscape, 2025
- 4.1 Introduction
- 4.2 Company market share analysis
- 4.2.1 By region
- 4.2.1.1 North America
- 4.2.1.2 Europe
- 4.2.1.3 Asia Pacific
- 4.2.1.4 Latin America
- 4.2.1.5 Middle East and Africa
- 4.2.1 By region
- 4.3 Company matrix analysis
- 4.4 Competitive analysis of major market players
- 4.5 Competitive positioning matrix
- 4.6 Key developments
- 4.6.1 Mergers & acquisitions
- 4.6.2 Partnerships & collaborations
- 4.6.3 New product launches
- 4.6.4 Expansion plans
Chapter 5 Market Estimates & Forecast, By Product Type, 2022-2035 (USD Billion) (Thousand Units)
- 5.1 Key trends
- 5.2 Gate valves
- 5.3 Control valves
- 5.4 Ball valves
- 5.5 Butterfly valve
- 5.6 Plug valves
- 5.7 Others (needle valves, globe valves, drain valves, etc.)
Chapter 6 Market Estimates & Forecast, By Size, 2022-2035 (USD Billion) (Thousand Units)
- 6.1 Key trends
- 6.2 Lesser than 1inch
- 6.3 Between 1 to 6 inch
- 6.4 Between 7 to 25 inch
- 6.5 Between 26 to 50 inch
- 6.6 Greater than 50 inch
Chapter 7 Market Estimates & Forecast, By Material, 2022-2035 (USD Billion) (Thousand Units)
- 7.1 Key trends
- 7.2 Stainless steel
- 7.3 Carbon steel
- 7.4 Brass
- 7.5 Alloy & specialty materials
Chapter 8 Market Estimates & Forecast, By Application, 2022-2035 (USD Billion) (Thousand Units)
- 8.1 Key trends
- 8.2 Supplying line
- 8.3 Filling device
- 8.4 Bulk storage tank
- 8.5 Gas transportation
- 8.6 Storage tank & piping
- 8.7 Others
Chapter 9 Market Estimates & Forecast, By End Use, 2022-2035 (USD Billion) (Thousand Units)
- 9.1 Key trends
- 9.2 Water & wastewater
- 9.3 Food & beverage
- 9.4 Chemicals
- 9.5 Pharma
- 9.6 Pulp & paper
- 9.7 Oil & gas
- 9.8 Power
- 9.9 Semiconductor
- 9.10 Others
Chapter 10 Market Estimates & Forecast, By Distribution Channel, 2022-2035 (USD Billion) (Thousand Units)
- 10.1 Key trends
- 10.2 Direct sales
- 10.3 Indirect sales
Chapter 11 Market Estimates & Forecast, By Region, 2022-2035 (USD Billion) (Thousand Units)
- 11.1 Key trends
- 11.2 North America
- 11.2.1 U.S.
- 11.2.2 Canada
- 11.3 Europe
- 11.3.1 Germany
- 11.3.2 France
- 11.3.3 UK
- 11.3.4 Italy
- 11.3.5 Spain
- 11.4 Asia Pacific
- 11.4.1 China
- 11.4.2 India
- 11.4.3 Japan
- 11.4.4 South Korea
- 11.4.5 Australia
- 11.5 Latin America
- 11.5.1 Brazil
- 11.5.2 Mexico
- 11.5.3 Argentina
- 11.6 MEA
- 11.6.1 South Africa
- 11.6.2 Saudi Arabia
- 11.6.3 UAE
Chapter 12 Company Profiles
- 12.1 China Yuanda Valve
- 12.2 CNNC Sufa Technology
- 12.3 Crane
- 12.4 Dalian DV Valve
- 12.5 Danfoss
- 12.6 Emerson Electric
- 12.7 Flowserve
- 12.8 Henan Kaifeng High Pressure Valve
- 12.9 Neway
- 12.10 Pentair
- 12.11 Schlumberger
- 12.12 Shandong Yidu Valve
- 12.13 SWI Valve
- 12.14 Velan
- 12.15 Watts
 2026 年全球清管阀市场报告2026年全球金属阀门市场报告2026年全球热解阀市场报告2026年全球衬里阀门市场报告2026年全球载荷感测器阀市场报告
 美国阀门市场(2025)
 储罐阀门市场按产品类型、材料、驱动方式、尺寸和应用划分-2026年至2032年全球预测全球严苛工况阀门市场(依阀门类型、材料、最终用途产业及销售管道划分)预测(2026-2032年)建筑用水截止阀市场按产品类型、安装类型、材料、最终用途和分销管道划分 - 全球预测(2026-2032 年)氢气加註OTV阀市场(依阀类型、终端用户产业及应用类型划分)-2026-2032年全球预测