


 |
市场调查报告书
商品编码
1892880
操作员训练模拟器 (OTS) 市场机会、成长驱动因素、产业趋势分析及预测(2026-2035 年)Operator Training Simulator (OTS) Market Opportunity, Growth Drivers, Industry Trend Analysis, and Forecast 2026 - 2035 |
||||||
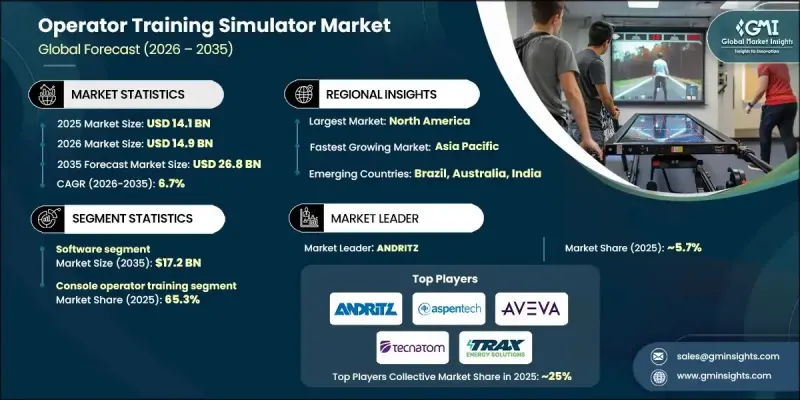
2025 年全球操作员训练模拟器市场价值为 141 亿美元,预计到 2035 年将以 6.7% 的复合年增长率成长至 268 亿美元。
虚拟实境 (VR) 和扩增实境 (AR) 等沉浸式技术正在透过提供高度逼真的三维互动式环境,革新传统的员工培训方式。这些技术使学习者能够与周围环境互动,从而提高知识保留率并降低危险操作的风险。操作员培训模拟器对于高风险行业尤其重要,因为在这些行业中,任何失误都可能造成严重后果。除了安全之外,VR 和 AR 还有助于克服传统训练的后勤挑战,从而减少训练时间、成本和危险环境暴露时间。随着各行业采用更先进的数位化解决方案,对沉浸式操作员培训平台的需求持续成长,推动全球市场的整体发展。
| 市场范围 | |
|---|---|
| 起始年份 | 2025 |
| 预测年份 | 2026-2035 |
| 起始值 | 141亿美元 |
| 预测值 | 268亿美元 |
| 复合年增长率 | 6.7% |
2025年软体市场规模为86亿美元,预计2035年将达172亿美元。软体解决方案凭藉其透过复杂的模拟引擎、高保真图形和互动式介面模拟物理作用力和操作流程的能力,占据了市场主导地位。对引人入胜、身临其境的模拟体验的需求,加速了创新VR和AR软体解决方案的开发。
2024年,控制台操作员培训市场规模达92亿美元,约占市占率的65.3%。该市场仍占据主导地位,因为大多数高风险操作都在集中控制室进行,操作员需要在控制室中监控多个系统、分析资料并快速做出决策。模拟器训练可确保操作员在紧急情况下能够正确应对、采取纠正措施并安全地管理复杂系统。
2025年美国操作员训练模拟器市场规模为41亿美元,预计2026年至2035年将以7%的复合年增长率成长。美国严格的工作场所安全法规推动了对能够模拟紧急应变和操作风险的高级操作员培训解决方案的需求。监管机构的措施和政府安全促进专案为企业部署高保真模拟器平台提供了强有力的动力。
目录
第一章:方法论与范围
第二章:执行概要
第三章:行业洞察
- 产业生态系分析
- 供应商格局
- 利润率
- 每个阶段的价值增加
- 影响价值链的因素
- 产业影响因素
- 成长驱动因素
- 产业陷阱与挑战
- 机会
- 成长潜力分析
- 未来市场趋势
- 价格趋势
- 区域和组件
- 原料成本
- 原物料供应中的实际产能限制与感知产能限制
- 供应商价格上涨验证
- 监理框架
- 按地区
- 波特五力分析
- PESTEL 分析
第四章:竞争格局
- 介绍
- 公司市占率分析
- 按地区
- 公司矩阵分析
- 主要市场参与者的竞争分析
- 竞争定位矩阵
- 产品组合基准测试
- 关键进展
- 併购
- 合作伙伴关係与合作
- 新产品发布
- 扩张计划
第五章:市场估算与预测:依组件划分,2022-2035年
- 硬体
- 软体
- 控制仿真
- 过程模拟
- 沉浸式模拟
- 服务
- 咨询
- 安装与环境模拟
- 维护与支援
第六章:市场估算与预测:基于模拟环境,2022-2035年
- 控制台操作员培训
- 现场操作员培训
第七章:市场估算与预测:依最终用途划分,2022-2035年
- 航太与国防
- 化学
- 能源与电力
- 卫生保健
- 工业的
- 石油和天然气
- 纸浆和造纸
- 其他的
第八章:市场估算与预测:依配销通路划分,2022-2035年
- 直销
- 间接销售
第九章:市场估计与预测:依地区划分,2022-2035年
- 北美洲
- 我们
- 加拿大
- 欧洲
- 德国
- 英国
- 法国
- 义大利
- 西班牙
- 亚太地区
- 中国
- 印度
- 日本
- 韩国
- 澳洲
- 拉丁美洲
- 巴西
- 墨西哥
- 阿根廷
- MEA
- 阿联酋
- 沙乌地阿拉伯
- 南非
第十章:公司简介
- ABB Ltd.
- ANDRITZ
- Aspen Technology Inc.
- AVEVA Group Limited
- Designing Digitally Inc.
- DNV AS
- DuPont
- EON Reality
- ESI Group
- Hyperion Group
- Schneider Electric
- Siemens
- Tecnatom
- TRAX Energy Solutions
- Yokogawa Electric Corporation
The Global Operator Training Simulator Market was valued at USD 14.1 billion in 2025 and is estimated to grow at a CAGR of 6.7% to reach USD 26.8 billion by 2035.
Immersive technologies such as Virtual Reality (VR) and Augmented Reality (AR) are transforming traditional employee training by providing interactive, three-dimensional environments that closely replicate real-world conditions. These technologies allow learners to engage with their surroundings, improving knowledge retention and reducing risk during hazardous operations. Operator training simulators are particularly critical for high-stakes industries where mistakes can have serious consequences. In addition to safety, VR and AR help overcome logistical challenges of conventional training, reducing time, cost, and exposure to dangerous conditions. As industries adopt more advanced digital solutions, the demand for immersive operator training platforms continues to rise, driving the overall growth of the market globally.
| Market Scope | |
|---|---|
| Start Year | 2025 |
| Forecast Year | 2026-2035 |
| Start Value | $14.1 Billion |
| Forecast Value | $26.8 Billion |
| CAGR | 6.7% |
The software segment held USD 8.6 billion in 2025 and is expected to reach USD 17.2 billion by 2035. Software solutions dominate the market due to their ability to replicate physical forces and operational processes through sophisticated simulation engines, high-fidelity graphics, and interactive interfaces. The demand for engaging and hands-on simulated experiences accelerates the development of innovative VR and AR software solutions.
The console operator training segment generated USD 9.2 billion in 2024, representing approximately 65.3% of the market. This segment remains dominant as most high-risk operations occur in centralized control rooms where operators monitor multiple systems, analyze data, and make rapid decisions. Simulator training ensures operators can respond correctly in emergencies, take corrective actions, and manage complex systems safely.
U.S. Operator Training Simulator Market was valued at USD 4.1 billion in 2025 and is anticipated to grow at a CAGR of 7% from 2026 to 2035. Stringent workplace safety regulations in the U.S. drive demand for advanced operator training solutions that simulate emergency responses and operational hazards. Regulatory initiatives and government programs promoting safety create strong incentives for companies to implement high-fidelity simulator platforms.
Key players in the Operator Training Simulator Market include Schneider Electric, Aspen Technology Inc., ABB Ltd., DNV AS, EON Reality, AVEVA Group Limited, TRAX Energy Solutions, Hyperion Group, Siemens, Tecnatom, Yokogawa Electric Corporation, Designing Digitally Inc., DuPont, and ESI Group. Market leaders focus on strategies such as continuous R&D to enhance software realism and simulation accuracy. Companies invest in VR and AR technology, expand platform capabilities for multiple industry applications, and integrate cloud-based solutions for remote training. Collaborations with industrial partners, customization of training modules, and after-sales support improve client retention. In addition, firms emphasize compliance with safety regulations, develop predictive analytics features, and adopt subscription-based or service-oriented pricing models to strengthen their market presence and maintain long-term competitiveness.
Table of Contents
Chapter 1 Methodology & Scope
- 1.1 Market scope and definition
- 1.2 Research design
- 1.2.1 Research approach
- 1.2.2 Data collection methods
- 1.3 Data mining sources
- 1.3.1 Global
- 1.3.2 Regional/Country
- 1.4 Base estimates and calculations
- 1.4.1 Base year calculation
- 1.4.2 Key trends for market estimation
- 1.5 Primary research and validation
- 1.5.1 Primary sources
- 1.6 Forecast model
- 1.7 Research assumptions and limitations
Chapter 2 Executive Summary
- 2.1 Industry 360° synopsis
- 2.2 Key market trends
- 2.2.1 Regional trends
- 2.2.2 Component trends
- 2.2.3 Simulation environment trends
- 2.2.4 End Use trends
- 2.2.5 Distribution channel trends
- 2.3 CXO perspective: Strategic imperatives
- 2.3.1 Key decision points for industry executives
- 2.3.2 Critical success factors for market players
- 2.4 Future outlook and strategic recommendations
- 2.5 Strategic recommendations
- 2.5.1 Supply chain diversification strategy
- 2.5.2 Product portfolio enhancement
- 2.5.3 Partnership and alliance opportunities
- 2.5.4 Cost management and pricing strategy
- 2.6 Decision framework
- 2.6.1 Investment priority matrix
- 2.6.2 ROI analysis
Chapter 3 Industry Insights
- 3.1 Industry ecosystem analysis
- 3.1.1 Supplier landscape
- 3.1.2 Profit margin
- 3.1.3 Value addition at each stage
- 3.1.4 Factor affecting the value chain
- 3.2 Industry impact forces
- 3.2.1 Growth drivers
- 3.2.2 Industry pitfalls & challenges
- 3.2.3 Opportunities
- 3.3 Growth potential analysis
- 3.4 Future market trends
- 3.5 Price trends
- 3.5.1 Region and component
- 3.5.2 Raw material cost
- 3.5.3 Real vs. perceived capacity constraints in supply of raw materials
- 3.5.4 Supplier price increase validation
- 3.6 Regulatory framework
- 3.6.1 By region
- 3.7 Porter's five forces analysis
- 3.8 PESTEL analysis
Chapter 4 Competitive Landscape, 2025
- 4.1 Introduction
- 4.2 Company market share analysis
- 4.2.1 By region
- 4.3 Company matrix analysis
- 4.4 Competitive analysis of major market players
- 4.5 Competitive positioning matrix
- 4.6 Product portfolio benchmarking
- 4.7 Key developments
- 4.7.1 Mergers & acquisitions
- 4.7.2 Partnerships & collaborations
- 4.7.3 New product launches
- 4.7.4 Expansion Plans
Chapter 5 Market Estimates & Forecast, By Component, 2022 - 2035 (USD Billion)
- 5.1 Key trends
- 5.2 Hardware
- 5.3 Software
- 5.3.1 Control simulation
- 5.3.2 Process simulation
- 5.3.3 Immersive simulation
- 5.4 Services
- 5.4.1 Consulting
- 5.4.2 Installation & environmental simulation
- 5.4.3 Maintenance & support
Chapter 6 Market Estimates & Forecast, By Simulation Environment, 2022 - 2035 (USD Billion)
- 6.1 Key trends
- 6.2 Console operator training
- 6.3 Field operator training
Chapter 7 Market Estimates & Forecast, By End Use, 2022 - 2035 (USD Billion)
- 7.1 Key trends
- 7.2 Aerospace & defense
- 7.3 Chemical
- 7.4 Energy & power
- 7.5 Healthcare
- 7.6 Industrial
- 7.7 Oil & gas
- 7.8 Pulp & paper
- 7.9 Others
Chapter 8 Market Estimates & Forecast, By Distribution Channel, 2022 - 2035, (USD Billion)
- 8.1 Key trends
- 8.2 Direct sales
- 8.3 Indirect sales
Chapter 9 Market Estimates & Forecast, By Region, 2022 - 2035, (USD Billion)
- 9.1 Key trends
- 9.2 North America
- 9.2.1 U.S.
- 9.2.2 Canada
- 9.3 Europe
- 9.3.1 Germany
- 9.3.2 U.K.
- 9.3.3 France
- 9.3.4 Italy
- 9.3.5 Spain
- 9.4 Asia Pacific
- 9.4.1 China
- 9.4.2 India
- 9.4.3 Japan
- 9.4.4 South Korea
- 9.4.5 Australia
- 9.5 Latin America
- 9.5.1 Brazil
- 9.5.2 Mexico
- 9.5.3 Argentina
- 9.6 MEA
- 9.6.1 UAE
- 9.6.2 Saudi Arabia
- 9.6.3 South Africa
Chapter 10 Company Profiles (Business Overview, Financial Data, Product Landscape, Strategic Outlook, SWOT Analysis)
- 10.1 ABB Ltd.
- 10.2 ANDRITZ
- 10.3 Aspen Technology Inc.
- 10.4 AVEVA Group Limited
- 10.5 Designing Digitally Inc.
- 10.6 DNV AS
- 10.7 DuPont
- 10.8 EON Reality
- 10.9 ESI Group
- 10.10 Hyperion Group
- 10.11 Schneider Electric
- 10.12 Siemens
- 10.13 Tecnatom
- 10.14 TRAX Energy Solutions
- 10.15 Yokogawa Electric Corporation
 全球操作员训练模拟器市场规模、份额、趋势和成长分析报告(2026-2034年)
 2026年全球操作员训练模拟器市场报告
 操作员训练模拟器市场规模、份额、趋势分析报告:按组件、按运营商、按最终用途、按地区、细分市场预测,2024-2030 年