


 |
市场调查报告书
商品编码
1892890
稀土金属市场机会、成长驱动因素、产业趋势分析及预测(2025-2034年)Rare Earth Metals Market Opportunity, Growth Drivers, Industry Trend Analysis, and Forecast 2025 - 2034 |
||||||
2024年全球稀土金属市场价值为182亿美元,预计到2034年将以7.6%的复合年增长率成长至367亿美元。
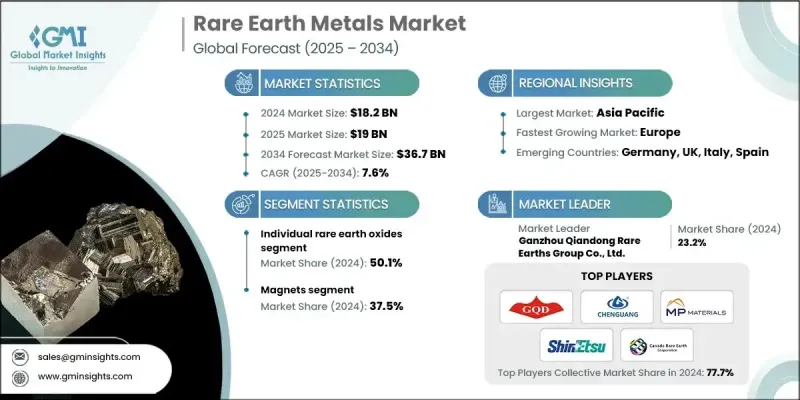
全球对高性能材料的依赖日益增强,推动了市场扩张,这些材料广泛应用于电动车、再生能源技术、先进电子产品和现代国防系统等领域。稀土金属以其卓越的磁性、热学和光学性能而闻名,在电机、电池、感测器、催化剂和通讯系统的动力供应中发挥着不可或缺的作用。随着各行业积极向清洁能源和电气化转型,对这些关键矿物的需求持续成长。此外,世界各国政府日益重视供应链安全,鼓励新的采矿投资、回收计画和战略储备,以减少对有限地理资源的依赖。
| 市场范围 | |
|---|---|
| 起始年份 | 2024 |
| 预测年份 | 2025-2034 |
| 起始值 | 182亿美元 |
| 预测值 | 367亿美元 |
| 复合年增长率 | 7.6% |
2024年,稀土氧化物细分市场占比达到50.1%,预计到2034年将以7.7%的复合年增长率成长。随着稀土金属在先进技术领域的应用不断拓展,市场对其需求正迅速成长。钕、镨和镝等元素的需求尤其强劲,因为它们在高性能永久磁铁中发挥关键作用,而这些永久磁铁广泛应用于电动车、风能係统和电子设备等领域。
按应用领域划分,磁体在2024年占据37.5%的市场份额,这主要得益于清洁能源技术和工业自动化领域的快速应用。磁体卓越的磁强度、耐久性和能源效率使其在现代马达、涡轮机、医疗设备和精密仪器中不可或缺。
到2034年,亚太地区稀土金属市场将以8.3%的复合年增长率成长,巩固其作为全球稀土金属开采、加工和製造中心的地位。中国庞大的产能,加上电子、汽车和再生能源产业的强劲需求,推动了该地区的领先地位。此外,电动车製造的快速扩张、离岸风电项目的开发以及半导体生产的稳定成长,也推动了稀土元素消费量的成长。
目录
第一章:方法论与范围
第二章:执行概要
第三章:行业洞察
- 产业生态系分析
- 供应商格局
- 利润率
- 每个阶段的价值增加
- 影响价值链的因素
- 中断
- 产业影响因素
- 成长驱动因素
- 产业陷阱与挑战
- 市场机会
- 成长潜力分析
- 监管环境
- 北美洲
- 欧洲
- 亚太地区
- 拉丁美洲
- 中东和非洲
- 波特的分析
- PESTEL 分析
- 价格趋势
- 按地区
- 依产品类型
- 未来市场趋势
- 技术与创新格局
- 当前技术趋势
- 新兴技术
- 专利格局
- 贸易统计(HS编码)(註:仅提供重点国家的贸易统计资料)
- 主要进口国
- 主要出口国
- 永续性和环境方面
- 永续实践
- 减少废弃物策略
- 生产中的能源效率
- 环保倡议
- 碳足迹考量
第四章:竞争格局
- 介绍
- 公司市占率分析
- 按地区
- 北美洲
- 欧洲
- 亚太地区
- 拉丁美洲
- MEA
- 按地区
- 公司矩阵分析
- 主要市场参与者的竞争分析
- 竞争定位矩阵
- 关键进展
- 併购
- 合作伙伴关係与合作
- 新产品发布
- 扩张计划
第五章:市场估算与预测:依产品类型划分,2021-2034年
- 混合稀土氧化物(MREO)
- 轻稀土氧化物混合物
- 重稀土氧化物混合物
- 平衡的 LREO-HREO 混合物
- 单一稀土氧化物
- 轻稀土氧化物
- 重稀土氧化物
- 钇族氧化物
- 单一稀土金属
- 铈
- 鎝
- 铒
- 钆
- 镧
- 钕
- 镨
- 钹
- 钪
- 铽
- 镱
- 钇
- 其他(铕、钬、镥、钷和鉥)
第六章:市场估算与预测:依应用领域划分,2021-2034年
- 磁铁
- 着色剂
- 合金
- 光学仪器
- 催化剂
- 其他的
第七章:市场估计与预测:依地区划分,2021-2034年
- 北美洲
- 我们
- 加拿大
- 欧洲
- 德国
- 英国
- 法国
- 西班牙
- 义大利
- 欧洲其他地区
- 亚太地区
- 中国
- 印度
- 日本
- 澳洲
- 韩国
- 亚太其他地区
- 拉丁美洲
- 巴西
- 墨西哥
- 阿根廷
- 拉丁美洲其他地区
- 中东和非洲
- 沙乌地阿拉伯
- 南非
- 阿联酋
- 中东和非洲其他地区
第八章:公司简介
- American Elements
- Arafura Rare Earths
- Australian Strategic Materials (ASM)
- Canada Rare Earth Corporation
- Energy Fuels Inc
- Ganzhou Chenguang Rare Earths New Material Co., Ltd.
- Ganzhou Qiandong Rare Earths Group Co., Ltd.
- Iluka Resources Limited
- Indian Rare Earths Limited
- Lynas Rare Earths Ltd
- MP Materials
- Neo Performance Materials
- Northern Minerals Limited
- Rio Tinto
- Shin-Etsu Chemical Co., Ltd.
- Western Minmetals (SC) Corporation
The Global Rare Earth Metals Market was valued at USD 18.2 billion in 2024 and is estimated to grow at a CAGR of 7.6% to reach USD 36.7 billion by 2034.
Market expansion is driven by rising global dependence on high-performance materials required for electric vehicles, renewable energy technologies, advanced electronics, and modern defense systems. Rare earth metals, known for their exceptional magnetic, thermal, and optical properties, play an indispensable role in powering motors, batteries, sensors, catalysts, and communication systems. With industries aggressively transitioning toward clean energy and electrification, demand for these critical minerals continues to accelerate. Additionally, governments worldwide are increasingly prioritizing supply chain security, encouraging new mining investments, recycling initiatives, and strategic reserves to reduce dependence on limited geographical sources.
| Market Scope | |
|---|---|
| Start Year | 2024 |
| Forecast Year | 2025-2034 |
| Start Value | $18.2 Billion |
| Forecast Value | $36.7 Billion |
| CAGR | 7.6% |
The individual rare earth oxides segment accounted for 50.1% in 2024 and is projected to grow at a CAGR of 7.7% through 2034. Demand for these individual rare earth metals is rising rapidly as their applications in advanced technologies continue to expand. Elements such as neodymium, praseodymium, and dysprosium are experiencing particularly strong demand due to their critical role in high-performance permanent magnets used in electric vehicles, wind energy systems, and electronic devices.
By application, the magnets segment held a 37.5% share in 2024, driven by rapid adoption in clean energy technologies and industrial automation. Their superior magnetic strength, durability, and energy efficiency make them irreplaceable in modern motors, turbines, medical devices, and precision equipment.
Asia Pacific Rare Earth Metals Market will grow at a CAGR of 8.3% by 2034, reinforcing its position as the global hub for rare earth metals mining, processing, and manufacturing activities. China's extensive production capacity, combined with strong demand from electronics, automotive, and renewable energy industries, drives the region's leadership. Moreover, the rapid expansion of EV manufacturing, the development of offshore wind projects, and the steady growth of semiconductor production are fueling increased consumption of rare earth elements.
Key players operating in the Global Rare Earth Metals Market include China Northern Rare Earth Group, Lynas Rare Earths, MP Materials, Iluka Resources, Arafura Resources, Alkane Resources, Ucore Rare Metals, Rare Element Resources, Texas Mineral Resources, Avalon Advanced Materials, Greenland Minerals, Rainbow Rare Earths, Defence Metals Corp., Neo Performance Materials, and China Minmetals Rare Earth Co. Ltd. Companies in the rare earth metals market are strengthening their market position by expanding mining capacities, developing advanced separation technologies, and enhancing value-added processing to reduce reliance on external suppliers. Many firms are focusing on long-term supply agreements with EV manufacturers, wind turbine producers, and electronics companies to secure stable revenue streams. Innovation in recycling technologies is also gaining momentum, enabling companies to reclaim rare earths from magnets, batteries, and electronic waste, lowering environmental impact and improving supply resilience.
Table of Contents
Chapter 1 Methodology & Scope
- 1.1 Market scope and definition
- 1.2 Research design
- 1.2.1 Research approach
- 1.2.2 Data collection methods
- 1.3 Data mining sources
- 1.3.1 Global
- 1.3.2 Regional/Country
- 1.4 Base estimates and calculations
- 1.4.1 Base year calculation
- 1.4.2 Key trends for market estimation
- 1.5 Primary research and validation
- 1.5.1 Primary sources
- 1.6 Forecast model
- 1.7 Research assumptions and limitations
Chapter 2 Executive Summary
- 2.1 Industry 360° synopsis
- 2.2 Key market trends
- 2.2.1 Regional
- 2.2.2 Product type
- 2.2.3 Application
- 2.3 TAM Analysis, 2025-2034
- 2.4 CXO perspectives: Strategic imperatives
- 2.4.1 Executive decision points
- 2.4.2 Critical success factors
- 2.5 Future Outlook and Strategic Recommendations
Chapter 3 Industry Insights
- 3.1 Industry ecosystem analysis
- 3.1.1 Supplier landscape
- 3.1.2 Profit margin
- 3.1.3 Value addition at each stage
- 3.1.4 Factor affecting the value chain
- 3.1.5 Disruptions
- 3.2 Industry impact forces
- 3.2.1 Growth drivers
- 3.2.2 Industry pitfalls and challenges
- 3.2.3 Market opportunities
- 3.3 Growth potential analysis
- 3.4 Regulatory landscape
- 3.4.1 North America
- 3.4.2 Europe
- 3.4.3 Asia Pacific
- 3.4.4 Latin America
- 3.4.5 Middle East & Africa
- 3.5 Porter's analysis
- 3.6 PESTEL analysis
- 3.7 Price trends
- 3.7.1 By region
- 3.7.2 By Product type
- 3.8 Future market trends
- 3.9 Technology and Innovation landscape
- 3.9.1 Current technological trends
- 3.9.2 Emerging technologies
- 3.10 Patent Landscape
- 3.11 Trade statistics (HS code) ( Note: the trade statistics will be provided for key countries only)
- 3.11.1 Major importing countries
- 3.11.2 Major exporting countries
- 3.12 Sustainability and environmental aspects
- 3.12.1 Sustainable practices
- 3.12.2 Waste reduction strategies
- 3.12.3 Energy efficiency in production
- 3.12.4 Eco-friendly initiatives
- 3.13 Carbon footprint consideration
Chapter 4 Competitive Landscape, 2024
- 4.1 Introduction
- 4.2 Company market share analysis
- 4.2.1 By region
- 4.2.1.1 North America
- 4.2.1.2 Europe
- 4.2.1.3 Asia Pacific
- 4.2.1.4 LATAM
- 4.2.1.5 MEA
- 4.2.1 By region
- 4.3 Company matrix analysis
- 4.4 Competitive analysis of major market players
- 4.5 Competitive positioning matrix
- 4.6 Key developments
- 4.6.1 Mergers & acquisitions
- 4.6.2 Partnerships & collaborations
- 4.6.3 New Product Launches
- 4.6.4 Expansion Plans
Chapter 5 Market Estimates and Forecast, By Product Type, 2021-2034 (USD Billion) (Tons)
- 5.1 Key trends
- 5.2 Mixed Rare Earth Oxides (MREO)
- 5.2.1 Light REE Oxides Mix
- 5.2.2 Heavy REE Oxides Mix
- 5.2.3 Balanced LREO-HREO Mix
- 5.3 Individual Rare Earth Oxides
- 5.3.1 Light REE Oxides
- 5.3.2 Heavy REE Oxides
- 5.3.3 Yttrium Group Oxides
- 5.4 Individual Rare Earth Metals
- 5.4.1 Cerium
- 5.4.2 Dysprosium
- 5.4.3 Erbium
- 5.4.4 Gadolinium
- 5.4.5 Lanthanum
- 5.4.6 Neodymium
- 5.4.7 Praseodymium
- 5.4.8 Samarium
- 5.4.9 Scandium
- 5.4.10 Terbium
- 5.4.11 Ytterbium
- 5.4.12 Yttrium
- 5.4.13 Others (Europium, Holmium, Lutetium, Promethium, and Thulium)
Chapter 6 Market Estimates and Forecast, By Application, 2021-2034 (USD Billion) (Tons)
- 6.1 Key trends
- 6.2 Magnets
- 6.3 Colorants
- 6.4 Alloys
- 6.5 Optical instruments
- 6.6 Catalysts
- 6.7 Others
Chapter 7 Market Estimates and Forecast, By Region, 2021-2034 (USD Billion) (Tons)
- 7.1 Key trends
- 7.2 North America
- 7.2.1 U.S.
- 7.2.2 Canada
- 7.3 Europe
- 7.3.1 Germany
- 7.3.2 UK
- 7.3.3 France
- 7.3.4 Spain
- 7.3.5 Italy
- 7.3.6 Rest of Europe
- 7.4 Asia Pacific
- 7.4.1 China
- 7.4.2 India
- 7.4.3 Japan
- 7.4.4 Australia
- 7.4.5 South Korea
- 7.4.6 Rest of Asia Pacific
- 7.5 Latin America
- 7.5.1 Brazil
- 7.5.2 Mexico
- 7.5.3 Argentina
- 7.5.4 Rest of Latin America
- 7.6 Middle East and Africa
- 7.6.1 Saudi Arabia
- 7.6.2 South Africa
- 7.6.3 UAE
- 7.6.4 Rest of Middle East and Africa
Chapter 8 Company Profiles
- 8.1 American Elements
- 8.2 Arafura Rare Earths
- 8.3 Australian Strategic Materials (ASM)
- 8.4 Canada Rare Earth Corporation
- 8.5 Energy Fuels Inc
- 8.6 Ganzhou Chenguang Rare Earths New Material Co., Ltd.
- 8.7 Ganzhou Qiandong Rare Earths Group Co., Ltd.
- 8.8 Iluka Resources Limited
- 8.9 Indian Rare Earths Limited
- 8.10 Lynas Rare Earths Ltd
- 8.11 MP Materials
- 8.12 Neo Performance Materials
- 8.13 Northern Minerals Limited
- 8.14 Rio Tinto
- 8.15 Shin-Etsu Chemical Co., Ltd.
- 8.16 Western Minmetals (SC) Corporation
 稀土元素市场:按类型、产品类型、提取製程、纯度、应用、终端用户产业和销售管道划分-2026-2032年全球市场预测
 稀土元素回收市场预测(电子业至2034年)-按金属类型、电子废弃物来源、技术、应用、最终用户和地区分類的全球分析
 全球稀土元素市场规模、份额、趋势和成长分析报告(2026-2034年)稀土元素浸出化学品市场:依化学品类型、萃取製程、形态、应用、终端用户产业及通路划分-2026-2032年全球市场预测
 铈箔市场规模、份额和成长分析:按产品类型、形态、厚度、纯度、应用、终端用户产业和地区划分 - 2026-2033年产业预测
 稀土金属市场:依类型、形态和应用划分 - 至2036年的全球预测2026-2034年全球稀土金属浸出化学品市场规模、份额、趋势和成长分析报告
 2026年全球稀土元素市场报告2026年全球稀土金属稀土元素市场报告
 稀土金属市场规模、份额及成长分析(按元素、应用及地区划分)-2026-2033年产业预测