


 |
市场调查报告书
商品编码
1892891
热转印色带市场机会、成长驱动因素、产业趋势分析及预测(2026-2035年)Thermal Transfer Ribbon Market Opportunity, Growth Drivers, Industry Trend Analysis, and Forecast 2026 - 2035 |
||||||
2025 年全球热转印色带市场价值为 23 亿美元,预计到 2035 年将以 5.9% 的复合年增长率增长至 40 亿美元。
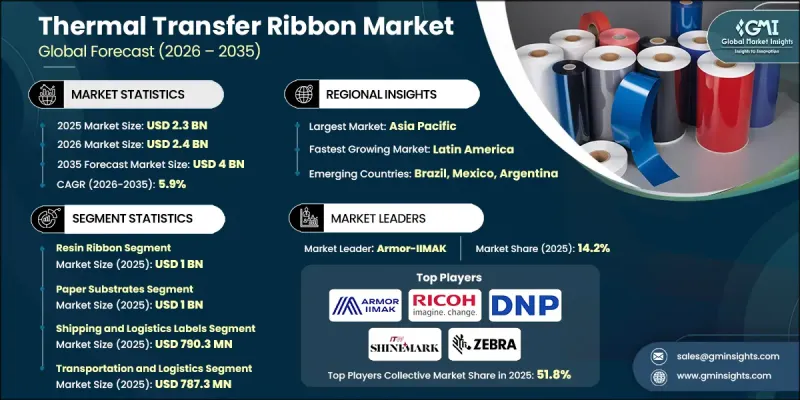
电子商务和包裹物流的快速发展有力地推动了成长,这增加了分类、运输和最后一公里配送环节对耐用型运输标籤的需求。国家邮政服务和贸易部门包裹量的成长直接推动了蜡基树脂和树脂色带的消耗。热转印色带在製造和仓储环境中越来越广泛的应用,自动化贴标机和智慧组装线正逐渐成为标准配置。高精度条码和合规标籤的日益普及有助于各行业提高生产效率、减少错误并增强即时库存可见度。智慧包装和可追溯性系统的普及,尤其是在那些对安全、序列化和审计要求严格的行业,进一步提升了对高性能、耐用型热敏列印的需求,尤其是在製药、化学和食品加工行业。
| 市场范围 | |
|---|---|
| 起始年份 | 2025 |
| 预测年份 | 2026-2035 |
| 起始值 | 23亿美元 |
| 预测值 | 40亿美元 |
| 复合年增长率 | 5.9% |
预计到2025年,树脂带材市场规模将达到10亿美元,其主要优势在于耐用性强,且具有优异的耐磨性、耐化学腐蚀性和耐恶劣环境性能。树脂带材广泛应用于对合规性和使用寿命要求较高的行业,例如汽车、电子、製药和工业设备等。
预计到2025年,纸质基材市场规模将达到10亿美元,其价值体现在成本、印刷品质和多功能性等方面的均衡性。零售、电商物流中心和物流营运中对运输标籤、货架标籤和产品识别的大量印刷需求,持续推动对纸质运输标籤的需求。全通路零售和仓储自动化的兴起,进一步巩固了纸质基材在可扩展标籤系统中的主导地位。
预计到2025年,北美热转印色带市场份额将达到27.9%,其中美国凭藉其完善的物流网络、先进的零售基础设施以及对食品、药品和化学品严格的标籤合规要求,将继续保持领先地位。自动化仓库和电商物流中心的成长,以及超过20亿平方英尺的工业和物流空间,持续推动对热转印色带和条码印表机的强劲需求。
目录
第一章:方法论与范围
第二章:执行概要
第三章:行业洞察
- 产业生态系分析
- 供应商格局
- 利润率
- 每个阶段的价值增加
- 影响价值链的因素
- 中断
- 产业影响因素
- 成长驱动因素
- 电子商务与物流扩张
- 工业自动化与智慧包装
- 射频识别技术的应用日益普及
- 产业陷阱与挑战
- 其他印刷技术的竞争日益加剧
- 与不同基材的兼容性问题
- 市场机会
- 临床营养应用的发展
- 与食物垃圾资源化利用结合
- 成长驱动因素
- 成长潜力分析
- 监管环境
- 北美洲
- 欧洲
- 亚太地区
- 拉丁美洲
- 中东和非洲
- 波特的分析
- PESTEL 分析
- 价格趋势
- 按地区
- 产品
- 未来市场趋势
- 技术与创新格局
- 当前技术趋势
- 新兴技术
- 专利格局
- 贸易统计(HS编码)(註:仅提供重点国家的贸易统计资料)
- 主要进口国
- 主要出口国
- 永续性和环境方面
- 永续实践
- 减少废弃物策略
- 生产中的能源效率
- 环保倡议
- 碳足迹考量
第四章:竞争格局
- 介绍
- 公司市占率分析
- 按地区
- 北美洲
- 欧洲
- 亚太地区
- 拉丁美洲
- MEA
- 按地区
- 公司矩阵分析
- 主要市场参与者的竞争分析
- 竞争定位矩阵
- 关键进展
- 併购
- 合作伙伴关係与合作
- 新产品发布
- 扩张计划
第五章:市场估算与预测:依产品划分,2022-2035年
- 蜡带
- 蜡树脂带
- 树脂带
第六章:市场估算与预测:依基材相容性划分,2022-2035年
- 纸基材
- 未涂布纸
- 涂布纸(半光泽、雾面)
- 合成底物
- 聚丙烯(PP)
- 聚酯(PET)
- 聚乙烯(PE)
- 乙烯基塑料
- 纺织材料
- 柔性包装薄膜
第七章:市场估计与预测:依应用领域划分,2022-2035年
- 条码和产品标籤
- 标准条码标籤
- 二维条码/二维码标籤
- 产品识别标籤
- 运输和物流标籤
- 运输标籤
- 托盘标籤
- 冷链标籤
- 资产追踪与识别
- 资产标籤
- 设备标籤
- IT资产标籤
- 软包装
- 食品包装
- 饮料包装
- 药品包装
- 医疗保健和实验室标籤
- 实验室标本标籤
- 病人腕带
- 血袋标籤
- 低温标籤
第八章:市场估算与预测:依最终用途划分,2022-2035年
- 零售与电子商务
- 实体零售
- 电子商务履约
- 杂货店和超市
- 运输与物流
- 货运和运输
- 仓储与配送
- 冷链物流
- 医疗保健与製药
- 医院和诊所
- 製药生产
- 实验室与诊断
- 餐饮
- 食品加工
- 饮料生产
- 食品零售与服务
- 汽车
- OEM零件标籤
- 售后市场零件
- 车辆识别
- 娱乐与饭店
- 活动门票
- 饭店营运
- 邮轮及旅行
第九章:市场估计与预测:依地区划分,2022-2035年
- 北美洲
- 我们
- 加拿大
- 欧洲
- 德国
- 英国
- 法国
- 西班牙
- 义大利
- 欧洲其他地区
- 亚太地区
- 中国
- 印度
- 日本
- 澳洲
- 韩国
- 亚太其他地区
- 拉丁美洲
- 巴西
- 墨西哥
- 拉丁美洲其他地区
- 中东和非洲
- 沙乌地阿拉伯
- 南非
- 阿联酋
- 中东和非洲其他地区
第十章:公司简介
- Dai Nippon Printing
- Armor-IIMAK
- Ricoh Electronics, Inc
- ITW ShineMark
- Honeywell International
- Zebra Technologies
- TSC Auto ID
- Hangzhou Todaytec Digital Technology Co.
- Inkstar
- Dynic USA
- Avery Dennison
- SATO Holdings
- Brady Corporation
The Global Thermal Transfer Ribbon Market was valued at USD 2.3 billion in 2025 and is estimated to grow at a CAGR of 5.9% to reach USD 4 billion by 2035.
Growth is strongly supported by the rapid expansion of e-commerce and parcel logistics, which has increased demand for durable shipping labels in sorting, shipping, and last-mile delivery operations. Rising parcel volumes in national postal services and trade sectors are directly driving the consumption of wax-resin and resin ribbons. Thermal transfer ribbons are increasingly adopted in manufacturing and warehouse environments where automated label applicators and intelligent assembly lines are becoming standard. The growing use of high-precision barcodes and compliance labels helps industries improve throughput, reduce errors, and enhance real-time inventory visibility. The move toward smart packaging and traceability systems, particularly in sectors with strict safety, serialization, and audit requirements, has further boosted demand for high-performance, durable thermal prints, especially in pharmaceutical, chemical, and food processing industries.
| Market Scope | |
|---|---|
| Start Year | 2025 |
| Forecast Year | 2026-2035 |
| Start Value | $2.3 Billion |
| Forecast Value | $4 Billion |
| CAGR | 5.9% |
In 2025, the resin ribbons segment reached USD 1 billion, favored for their durability and high resistance to abrasion, chemicals, and harsh environments. They are widely used in industries demanding regulatory compliance and longevity, such as automotive, electronics, pharmaceuticals, and industrial equipment.
The paper substrates segment generated USD 1 billion in 2025, valued for their balance of cost, print quality, and versatility. High-volume printing of shipping labels, shelf tags, and product identification in retail, e-commerce fulfillment centers, and logistics operations continues to drive the demand for paper-based TTRs. The rise of omnichannel retailing and warehouse automation has further reinforced the dominance of paper substrates in scalable labeling systems.
North America Thermal Transfer Ribbon Market accounted for 27.9% share in 2025, with the U.S. leading due to its extensive logistics networks, advanced retail infrastructure, and strict labeling compliance requirements for food, pharmaceuticals, and chemicals. The growth of automated warehouses and e-commerce fulfillment centers, along with the availability of over two billion square feet of industrial and logistics space, continues to drive high-volume demand for thermal transfer ribbons and barcode printers.
Leading companies in the Global Thermal Transfer Ribbon Market include Armor-IIMAK, Dai Nippon Printing, Honeywell International, Hangzhou Todaytec Digital Technology Co., Inkstar, Dynic USA, TSC Auto ID, Ricoh Electronics, Inc., ITW ShineMark, Zebra Technologies, Avery Dennison, Brady Corporation, and SATO Holdings. Companies in the Global Thermal Transfer Ribbon Market are strengthening their positions by investing in R&D to improve ribbon formulations, durability, and print performance. Many are expanding their global distribution networks and partnering with logistics, retail, and industrial clients to ensure steady demand. Strategic product launches targeting specialized labeling applications, such as high-contrast prints for harsh environments and compliance-driven industries, help maintain competitive advantage. Firms are also leveraging automation-friendly solutions and smart packaging integrations to enhance operational efficiency for customers.
Table of Contents
Chapter 1 Methodology & Scope
- 1.1 Market scope and definition
- 1.2 Research design
- 1.2.1 Research approach
- 1.2.2 Data collection methods
- 1.3 Data mining sources
- 1.3.1 Global
- 1.3.2 Regional/Country
- 1.4 Base estimates and calculations
- 1.4.1 Base year calculation
- 1.4.2 Key trends for market estimation
- 1.5 Primary research and validation
- 1.5.1 Primary sources
- 1.6 Forecast model
- 1.7 Research assumptions and limitations
Chapter 2 Executive Summary
- 2.1 Industry 3600 synopsis
- 2.2 Key market trends
- 2.2.1 Regional
- 2.2.2 Product
- 2.2.3 Substrate compatibility
- 2.2.4 Application
- 2.2.5 End use
- 2.3 TAM Analysis, 2025-2034
- 2.4 CXO perspectives: Strategic imperatives
- 2.4.1 Executive decision points
- 2.4.2 Critical success factors
- 2.5 Future Outlook and Strategic Recommendations
Chapter 3 Industry Insights
- 3.1 Industry ecosystem analysis
- 3.1.1 Supplier Landscape
- 3.1.2 Profit Margin
- 3.1.3 Value addition at each stage
- 3.1.4 Factor affecting the value chain
- 3.1.5 Disruptions
- 3.2 Industry impact forces
- 3.2.1 Growth drivers
- 3.2.1.1 E-commerce & logistics expansion
- 3.2.1.2 Industrial automation & smart packaging
- 3.2.1.3 Increasing adoption of RFID
- 3.2.2 Industry pitfalls and challenges
- 3.2.2.1 Increasing competition from alternative printing technologies
- 3.2.2.2 Compatibility issues with diverse substrates
- 3.2.3 Market opportunities
- 3.2.3.1 Development of clinical nutrition applications
- 3.2.3.2 Integration with food waste valorization
- 3.2.1 Growth drivers
- 3.3 Growth potential analysis
- 3.4 Regulatory landscape
- 3.4.1 North America
- 3.4.2 Europe
- 3.4.3 Asia Pacific
- 3.4.4 Latin America
- 3.4.5 Middle East & Africa
- 3.5 Porter's analysis
- 3.6 PESTEL analysis
- 3.7 Price trends
- 3.7.1 By region
- 3.7.2 Product
- 3.8 Future market trends
- 3.9 Technology and Innovation Landscape
- 3.9.1 Current technological trends
- 3.9.2 Emerging technologies
- 3.10 Patent Landscape
- 3.11 Trade statistics (HS code) (Note: the trade statistics will be provided for key countries only)
- 3.11.1 Major importing countries
- 3.11.2 Major exporting countries
- 3.12 Sustainability and environmental aspects
- 3.12.1 Sustainable practices
- 3.12.2 Waste reduction strategies
- 3.12.3 Energy efficiency in production
- 3.12.4 Eco-friendly initiatives
- 3.13 Carbon footprint considerations
Chapter 4 Competitive Landscape, 2024
- 4.1 Introduction
- 4.2 Company market share analysis
- 4.2.1 By region
- 4.2.1.1 North America
- 4.2.1.2 Europe
- 4.2.1.3 Asia Pacific
- 4.2.1.4 LATAM
- 4.2.1.5 MEA
- 4.2.1 By region
- 4.3 Company matrix analysis
- 4.4 Competitive analysis of major market players
- 4.5 Competitive positioning matrix
- 4.6 Key developments
- 4.6.1 Mergers & acquisitions
- 4.6.2 Partnerships & collaborations
- 4.6.3 New product launches
- 4.6.4 Expansion plans
Chapter 5 Market Estimates and Forecast, By Product, 2022 - 2035 (USD Million) (Million Square Meters)
- 5.1 Key trends
- 5.2 Wax ribbon
- 5.3 Wax-resin ribbon
- 5.4 Resin ribbon
Chapter 6 Market Estimates and Forecast, By Substrate Compatibility, 2022 - 2035 (USD Million) (Million Square Meters)
- 6.1 Key trends
- 6.2 Paper Substrates
- 6.2.1 Uncoated paper
- 6.2.2 Coated paper (semi-gloss, matte)
- 6.3 Synthetic Substrates
- 6.3.1 Polypropylene (PP)
- 6.3.2 Polyester (PET)
- 6.3.3 Polyethylene (PE)
- 6.3.4 Vinyl
- 6.4 Textile Materials
- 6.5 Flexible packaging films
Chapter 7 Market Estimates and Forecast, By Application, 2022 - 2035 (USD Million) (Million Square Meters)
- 7.1 Key trends
- 7.2 Barcode & product labeling
- 7.2.1 Standard barcode labels
- 7.2.2 2d barcode / qr code labels
- 7.2.3 Product identification labels
- 7.3 Shipping & logistics labels
- 7.3.1 Shipping labels
- 7.3.2 Pallet labels
- 7.3.3 Cold chain labels
- 7.4 Asset tracking & identification
- 7.4.1 Asset tags
- 7.4.2 Equipment labels
- 7.4.3 IT asset labels
- 7.5 Flexible packaging
- 7.5.1 Food packaging
- 7.5.2 Beverage packaging
- 7.5.3 Pharmaceutical packaging
- 7.6 Healthcare & laboratory labels
- 7.6.1 Laboratory specimen labels
- 7.6.2 Patient wristbands
- 7.6.3 Blood bag labels
- 7.6.4 Cryogenic labels
Chapter 8 Market Estimates and Forecast, By End Use, 2022 - 2035 (USD million) (Million Square Meters)
- 8.1 Key trends
- 8.2 Retail & e-commerce
- 8.2.1 Brick-and-mortar retail
- 8.2.2 E-commerce fulfillment
- 8.2.3 Grocery & supermarkets
- 8.3 Transportation & logistics
- 8.3.1 Freight & shipping
- 8.3.2 Warehousing & distribution
- 8.3.3 Cold chain logistics
- 8.4 Healthcare & pharmaceuticals
- 8.4.1 Hospitals & clinics
- 8.4.2 Pharmaceutical manufacturing
- 8.4.3 Laboratory & diagnostics
- 8.5 Food & beverage
- 8.5.1 Food processing
- 8.5.2 Beverage production
- 8.5.3 Food retail & service
- 8.6 Automotive
- 8.6.1 OEM parts labeling
- 8.6.2 Aftermarket parts
- 8.6.3 Vehicle identification
- 8.7 Entertainment & hospitality
- 8.7.1 Event ticketing
- 8.7.2 Hotel operations
- 8.7.3 Cruise & travel
Chapter 9 Market Estimates and Forecast, By Region, 2022 - 2035 (USD million) (Million Square Meters)
- 9.1 Key trends
- 9.2 North America
- 9.2.1 U.S.
- 9.2.2 Canada
- 9.3 Europe
- 9.3.1 Germany
- 9.3.2 UK
- 9.3.3 France
- 9.3.4 Spain
- 9.3.5 Italy
- 9.3.6 Rest of Europe
- 9.4 Asia Pacific
- 9.4.1 China
- 9.4.2 India
- 9.4.3 Japan
- 9.4.4 Australia
- 9.4.5 South Korea
- 9.4.6 Rest of Asia Pacific
- 9.5 Latin America
- 9.5.1 Brazil
- 9.5.2 Mexico
- 9.5.3 Rest of Latin America
- 9.6 Middle East and Africa
- 9.6.1 Saudi Arabia
- 9.6.2 South Africa
- 9.6.3 UAE
- 9.6.4 Rest of Middle East and Africa
Chapter 10 Company Profiles
- 10.1 Dai Nippon Printing
- 10.2 Armor-IIMAK
- 10.3 Ricoh Electronics, Inc
- 10.4 ITW ShineMark
- 10.5 Honeywell International
- 10.6 Zebra Technologies
- 10.7 TSC Auto ID
- 10.8 Hangzhou Todaytec Digital Technology Co.
- 10.9 Inkstar
- 10.10 Dynic USA
- 10.11 Avery Dennison
- 10.12 SATO Holdings
- 10.13 Brady Corporation


