


 |
市场调查报告书
商品编码
1892908
稀有糖市场机会、成长驱动因素、产业趋势分析及预测(2026-2035年)Rare Sugar Market Opportunity, Growth Drivers, Industry Trend Analysis, and Forecast 2026 - 2035 |
||||||
2025 年全球稀有糖市场价值为 14 亿美元,预计到 2035 年将以 5.4% 的复合年增长率增长至 24 亿美元。
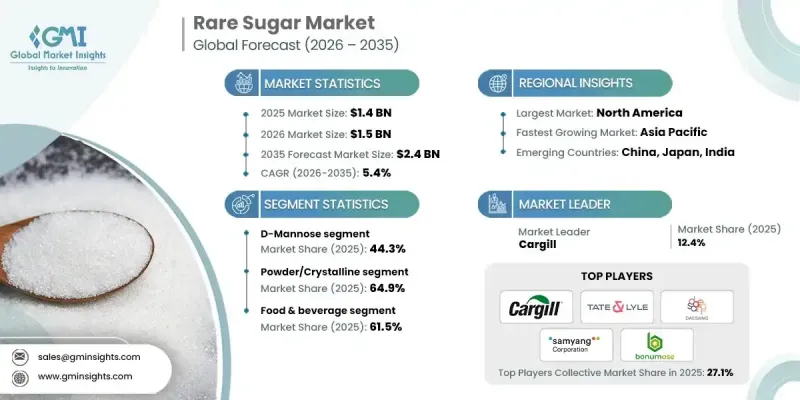
低热量、低升糖指数和清洁标籤的糖替代品(包括阿洛酮糖、塔格糖、D-甘露糖和阿洛糖)日益普及,推动了市场成长。人们对稀有糖代谢健康益处的认识不断提高,加上监管框架的完善和供应链基础设施的健全,正推动食品和饮料产品中稀有糖的应用。亚太地区成长最快,其中中国、日本和印度引领成长,这得益于可支配收入的增加、城市化进程的加快以及对健康食品需求的不断增长。拉丁美洲和中东及非洲的新兴市场,特别是巴西和沙乌地阿拉伯,也展现出良好的成长前景。整体而言,稀有糖正逐渐成为主流配料,各大品牌正在调整产品配方,以满足消费者对更健康、清洁标籤替代品的需求,同时保持产品的口感和功能性。
| 市场范围 | |
|---|---|
| 起始年份 | 2025 |
| 预测年份 | 2026-2035 |
| 起始值 | 14亿美元 |
| 预测值 | 24亿美元 |
| 复合年增长率 | 5.4% |
食品饮料产业占据了 61.5% 的市场份额,预计到 2035 年将以 4.8% 的复合年增长率成长。对低热量和低升糖指数甜味剂的需求正在推动烘焙、糖果、饮料和乳製品行业的采用,这些甜味剂在不影响口味、质地或性能的前提下替代了传统的糖。
2025年,粉末/结晶稀有糖市占率为64.9%,预计从2025年到2034年将以4.4%的复合年增长率成长。与液体或糖浆形式的替代品相比,粉末和结晶形式具有更高的稳定性和更长的保质期,使其成为大多数食品和饮料应用的理想选择。
预计到2025年,北美稀有糖市场规模将达到4.617亿美元。该地区的成长得益于消费者对低热量、低升糖指数食品、清洁标籤产品的强劲需求,以及健康意识的提高、糖尿病盛行率的上升和功能性食品饮料的普及。此外,阿洛酮糖和塔格糖等稀有糖获得监管部门批准,也进一步推动了美国市场的扩张。
目录
第一章:方法论与范围
第二章:执行概要
第三章:行业洞察
- 产业生态系分析
- 供应商格局
- 利润率
- 每个阶段的价值增加
- 影响价值链的因素
- 中断
- 产业影响因素
- 成长驱动因素
- 全球对更健康、低热量甜味剂取代传统糖的需求不断增长
- 糖尿病和肥胖症盛行率的上升推动了功能性糖的创新
- 产业陷阱与挑战
- 生产成本高昂,且大规模生产能力有限。
- 新兴稀有糖的监管不确定性和全球批准差异
- 市场机会
- 全球消费市场中清洁标籤和天然成分趋势的不断扩大
- 酵素法和微生物法生产技术的进步提高了糖合成的成本效益
- 成长驱动因素
- 成长潜力分析
- 监管环境
- 北美洲
- 欧洲
- 亚太地区
- 拉丁美洲
- 中东和非洲
- 波特的分析
- PESTEL 分析
- 价格趋势
- 按地区
- 依稀有糖类型
- 未来市场趋势
- 技术与创新格局
- 当前技术趋势
- 新兴技术
- 专利格局
- 贸易统计(HS编码)(註:仅提供重点国家的贸易统计资料)
- 主要进口国
- 主要出口国
- 永续性和环境方面
- 永续实践
- 减少废弃物策略
- 生产中的能源效率
- 环保倡议
- 碳足迹考量
第四章:竞争格局
- 介绍
- 公司市占率分析
- 按地区
- 北美洲
- 欧洲
- 亚太地区
- 拉丁美洲
- MEA
- 按地区
- 公司矩阵分析
- 主要市场参与者的竞争分析
- 竞争定位矩阵
- 关键进展
- 併购
- 合作伙伴关係与合作
- 新产品发布
- 扩张计划
第五章:市场估计与预测:依稀有糖类型划分,2022-2035年
- D-甘露糖
- 阿洛酮糖
- 塔格糖
- 阿洛斯
第六章:市场估算与预测:依产品类型划分,2022-2035年
- 粉末/晶体
- 液体/糖浆
- 其他产品类型
第七章:市场估计与预测:依应用领域划分,2022-2035年
- 餐饮
- 製药
- 化妆品
- 营养保健品
- 其他应用
第八章:市场估算与预测:依地区划分,2022-2035年
- 北美洲
- 我们
- 加拿大
- 欧洲
- 德国
- 英国
- 法国
- 西班牙
- 义大利
- 欧洲其他地区
- 亚太地区
- 中国
- 印度
- 日本
- 澳洲
- 韩国
- 亚太其他地区
- 拉丁美洲
- 巴西
- 墨西哥
- 阿根廷
- 拉丁美洲其他地区
- 中东和非洲
- 沙乌地阿拉伯
- 南非
- 阿联酋
- 中东和非洲其他地区
第九章:公司简介
- Anderson Global Group, LLC
- Ardilla Technologies
- Bonumose
- Cargill
- Daesang Corporation
- Matsutani Chemical Industry Co., Ltd
- Roquette Freres
- Samyang Corporation
- SAVANNA Ingredients GmbH
- Shandong Bailong Chuangyuan Bio-tech Co., Ltd
- Shandong Fuyang Bio-tech Co., Ltd
- Tate & Lyle PLC
The Global Rare Sugar Market was valued at USD 1.4 billion in 2025 and is estimated to grow at a CAGR of 5.4% to reach USD 2.4 billion by 2035.
The market growth is fueled by the rising popularity of low-calorie, low-glycemic, and clean-label sugar alternatives, including allulose, tagatose, D-mannose, and allose. Increasing awareness of the metabolic health benefits of rare sugars, coupled with strengthened regulatory frameworks and robust supply chain infrastructures, is driving adoption in food and beverage products. The APAC region is witnessing the fastest growth, with China, Japan, and India leading due to rising disposable incomes, urbanization, and the growing demand for healthy foods. Emerging markets in Latin America and the Middle East & Africa, particularly Brazil and Saudi Arabia, are also showing promising growth prospects. Overall, rare sugars are becoming mainstream ingredients, with brands reformulating products to meet consumer demand for healthier, clean-label alternatives while maintaining taste and functionality.
| Market Scope | |
|---|---|
| Start Year | 2025 |
| Forecast Year | 2026-2035 |
| Start Value | $1.4 Billion |
| Forecast Value | $2.4 Billion |
| CAGR | 5.4% |
The food & beverage segment held a share of 61.5% share and is projected to grow at a CAGR of 4.8% through 2035. Demand for low-calorie and low-glycemic sweeteners is driving adoption across bakery, confectionery, beverage, and dairy products, replacing conventional sugars without compromising taste, texture, or performance.
The powder/crystalline rare sugars segment held 64.9% share in 2025 and is expected to grow at a CAGR of 4.4% from 2025 to 2034. Powder and crystalline forms offer greater stability and longer shelf-life compared to liquid or syrup alternatives, making them ideal for most food and beverage applications.
North America Rare Sugar Market generated USD 461.7 million in 2025. Growth in the region is supported by strong demand for low-calorie and low-glycemic foods, clean-label products, rising health awareness, increasing diabetes prevalence, and the popularity of functional foods and beverages. Regulatory approvals for rare sugars such as allulose and tagatose are further boosting market expansion in the U.S.
Key players operating in the Global Rare Sugar Market include Cargill, Daesang Corporation, Matsutani Chemical Industry Co., Ltd., Roquette Freres, Anderson Global Group, LLC, Ardilla Technologies, Bonumose, Samyang Corporation, SAVANNA Ingredients GmbH, Shandong Bailong Chuangyuan Bio-tech Co., Ltd., Shandong Fuyang Bio-tech Co., Ltd., and Tate & Lyle PLC. Companies in the Global Rare Sugar Market are strengthening their market position by investing heavily in research and development to innovate new sugar alternatives with better taste, stability, and functional benefits. Strategic partnerships with food and beverage manufacturers help expand distribution and accelerate adoption. Firms are also focusing on scaling production capabilities, securing reliable raw material sources, and obtaining regulatory approvals in multiple regions.
Table of Contents
Chapter 1 Methodology & Scope
- 1.1 Market scope and definition
- 1.2 Research design
- 1.2.1 Research approach
- 1.2.2 Data collection methods
- 1.3 Data mining sources
- 1.3.1 Global
- 1.3.2 Regional/Country
- 1.4 Base estimates and calculations
- 1.4.1 Base year calculation
- 1.4.2 Key trends for market estimation
- 1.5 Primary research and validation
- 1.5.1 Primary sources
- 1.6 Forecast model
- 1.7 Research assumptions and limitations
Chapter 2 Executive Summary
- 2.1 Industry 360° synopsis
- 2.2 Key market trends
- 2.2.1 Regional
- 2.2.2 Rare sugar type
- 2.2.3 Product type
- 2.2.4 Application
- 2.3 TAM Analysis, 2025-2035
- 2.4 CXO perspectives: Strategic imperatives
- 2.4.1 Executive decision points
- 2.4.2 Critical success factors
- 2.5 Future Outlook and Strategic Recommendations
Chapter 3 Industry Insights
- 3.1 Industry ecosystem analysis
- 3.1.1 Supplier landscape
- 3.1.2 Profit margin
- 3.1.3 Value addition at each stage
- 3.1.4 Factor affecting the value chain
- 3.1.5 Disruptions
- 3.2 Industry impact forces
- 3.2.1 Growth drivers
- 3.2.1.1 Rising global demand for healthier low-calorie sweeteners replacing conventional sugars
- 3.2.1.2 Increasing prevalence of diabetes and obesity driving functional sugar innovation
- 3.2.2 Industry pitfalls and challenges
- 3.2.2.1 High production costs and limited large-scale manufacturing capabilities
- 3.2.2.2 Regulatory uncertainties and varying global approvals for emerging rare sugars
- 3.2.3 Market opportunities
- 3.2.3.1 Expanding clean-label and natural ingredient trends across global consumer markets
- 3.2.3.2 Advances in enzymatic and microbial production improving cost-efficient sugar synthesis
- 3.2.1 Growth drivers
- 3.3 Growth potential analysis
- 3.4 Regulatory landscape
- 3.4.1 North America
- 3.4.2 Europe
- 3.4.3 Asia Pacific
- 3.4.4 Latin America
- 3.4.5 Middle East & Africa
- 3.5 Porter's analysis
- 3.6 PESTEL analysis
- 3.7 Price trends
- 3.7.1 By region
- 3.7.2 By rare sugar type
- 3.8 Future market trends
- 3.9 Technology and Innovation landscape
- 3.9.1 Current technological trends
- 3.9.2 Emerging technologies
- 3.10 Patent Landscape
- 3.11 Trade statistics (HS code) ( Note: the trade statistics will be provided for key countries only)
- 3.11.1 Major importing countries
- 3.11.2 Major exporting countries
- 3.12 Sustainability and environmental aspects
- 3.12.1 Sustainable practices
- 3.12.2 Waste reduction strategies
- 3.12.3 Energy efficiency in production
- 3.12.4 Eco-friendly initiatives
- 3.13 Carbon footprint consideration
Chapter 4 Competitive Landscape, 2025
- 4.1 Introduction
- 4.2 Company market share analysis
- 4.2.1 By region
- 4.2.1.1 North America
- 4.2.1.2 Europe
- 4.2.1.3 Asia Pacific
- 4.2.1.4 LATAM
- 4.2.1.5 MEA
- 4.2.1 By region
- 4.3 Company matrix analysis
- 4.4 Competitive analysis of major market players
- 4.5 Competitive positioning matrix
- 4.6 Key developments
- 4.6.1 Mergers & acquisitions
- 4.6.2 Partnerships & collaborations
- 4.6.3 New Product Launches
- 4.6.4 Expansion Plans
Chapter 5 Market Estimates and Forecast, By Rare Sugar Type, 2022-2035 (USD Million) (Kilo Tons)
- 5.1 Key trends
- 5.2 D-Mannose
- 5.3 Allulose
- 5.4 Tagatose
- 5.5 Allose
Chapter 6 Market Estimates and Forecast, By Product Type, 2022-2035 (USD Million) (Kilo Tons)
- 6.1 Key trends
- 6.2 Powder/Crystalline
- 6.3 Liquid/Syrup
- 6.4 Other Product Types
Chapter 7 Market Estimates and Forecast, By Application, 2022-2035 (USD Million) (Kilo Tons)
- 7.1 Key trends
- 7.2 Food and beverage
- 7.3 Pharmaceuticals
- 7.4 Cosmetics
- 7.5 Nutraceuticals
- 7.6 Other applications
Chapter 8 Market Estimates and Forecast, By Region, 2022-2035 (USD Million) (Kilo Tons)
- 8.1 Key trends
- 8.2 North America
- 8.2.1 U.S.
- 8.2.2 Canada
- 8.3 Europe
- 8.3.1 Germany
- 8.3.2 UK
- 8.3.3 France
- 8.3.4 Spain
- 8.3.5 Italy
- 8.3.6 Rest of Europe
- 8.4 Asia Pacific
- 8.4.1 China
- 8.4.2 India
- 8.4.3 Japan
- 8.4.4 Australia
- 8.4.5 South Korea
- 8.4.6 Rest of Asia Pacific
- 8.5 Latin America
- 8.5.1 Brazil
- 8.5.2 Mexico
- 8.5.3 Argentina
- 8.5.4 Rest of Latin America
- 8.6 Middle East and Africa
- 8.6.1 Saudi Arabia
- 8.6.2 South Africa
- 8.6.3 UAE
- 8.6.4 Rest of Middle East and Africa
Chapter 9 Company Profiles
- 9.1 Anderson Global Group, LLC
- 9.2 Ardilla Technologies
- 9.3 Bonumose
- 9.4 Cargill
- 9.5 Daesang Corporation
- 9.6 Matsutani Chemical Industry Co., Ltd
- 9.7 Roquette Freres
- 9.8 Samyang Corporation
- 9.9 SAVANNA Ingredients GmbH
- 9.10 Shandong Bailong Chuangyuan Bio-tech Co., Ltd
- 9.11 Shandong Fuyang Bio-tech Co., Ltd
- 9.12 Tate & Lyle PLC
