


 |
市场调查报告书
商品编码
1892913
自行车电脑市场机会、成长驱动因素、产业趋势分析及预测(2026-2035年)Bike Computer Market Opportunity, Growth Drivers, Industry Trend Analysis, and Forecast 2026 - 2035 |
||||||
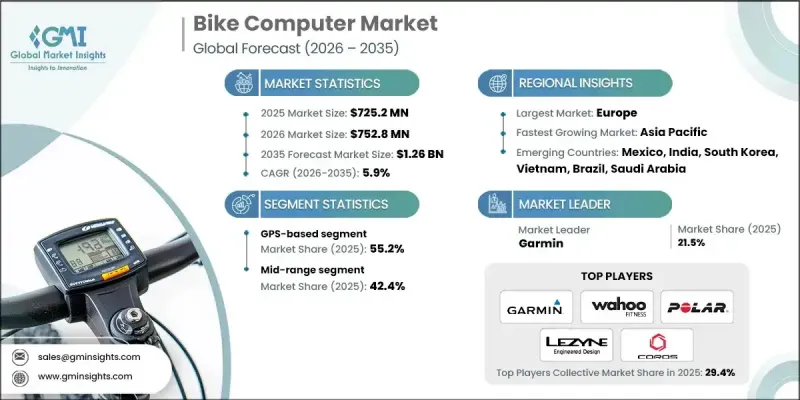
2025 年全球自行车电脑市场价值为 7.252 亿美元,预计到 2035 年将以 5.9% 的复合年增长率增长至 12.6 亿美元。
人们对个人健身的兴趣日益浓厚,科技也越来越融入日常生活,这持续推高了对能够追踪速度、踏频、心率和其他运动指标的设备的需求。骑乘已成为全球注重健康人士的首选运动,尤其是在人们日益关注与生活方式相关的健康问题(例如糖尿病、心臟併发症和体重管理)的情况下,骑乘更成为一种积极的生活方式。环境因素也发挥重要作用,各国政府都在大力推广骑行,以减少碳排放并缓解交通拥堵。数位系统的进步以及人工智慧和机器学习在行动应用领域日益广泛的应用,有望为市场带来更智慧、更直观的自行车码表,从而增强其吸引力。自行车赛事和公共健康计画的日益普及,也进一步推动了能够增强训练和运动表现监测的设备的应用。随着全球对健身科技的认知不断提高,对互联智慧自行车码表的整体需求预计将加速成长。
| 市场范围 | |
|---|---|
| 起始年份 | 2025 |
| 预测年份 | 2026-2035 |
| 起始值 | 7.252亿美元 |
| 预测值 | 12.6亿美元 |
| 复合年增长率 | 5.9% |
2024年,基于GPS的导航设备市占率达到55.2%。这些设备已经远远超越了早期的导航工具,如今能够提供骑乘者期望的即时详细骑乘数据。其卓越的地图功能使其成为比非GPS导航设备更受欢迎的选择,这与全球范围内骑行在休閒、通勤和锻炼方面的蓬勃发展趋势相契合。随着消费者期望的不断提高,骑乘者也持续寻求更精确的距离、速度及相关数据追踪。
到2034年,高阶自行车码表市场将以7.1%的复合年增长率成长,这主要得益于人工智慧增强分析、高阶健康追踪和智慧电池优化等功能。各大品牌正密切关注用户偏好趋势,不断改进产品并推出更多整合功能。随着消费者可支配收入的增加,他们越来越倾向于选择功能更强大的高端设备,这也推动了该细分市场的成长。
受互联骑乘技术的快速发展和自行车使用者群体不断扩大的推动,美国自行车电脑市场预计到2025年将达到1.852亿美元。多家公司透过推出新一代功能和树立产品创新标桿,持续引领美国市场的发展趋势。
目录
第一章:方法论
第二章:执行概要
第三章:行业洞察
- 产业生态系分析
- 供应商格局
- 利润率
- 成本结构
- 每个阶段的价值增加
- 影响价值链的因素
- 中断
- 产业影响因素
- 成长驱动因素
- 全球自行车参与人数成长与健康意识趋势
- 电动自行车市场扩张及整合显示需求
- 职业自行车运动的影响及UCI世界巡迴赛技术应用
- 智慧城市基础建设与自行车融合
- 产业陷阱与挑战
- 智慧型手机替代品的威胁及免费应用程式替代方案
- 城市市场中的盗窃风险和设备安全问题
- 市场机会
- 新兴市场渗透
- 电动自行车整合及OEM合作伙伴关係拓展
- 砾石路和探险骑行细分市场扩张
- 智慧城市与市政自行车资料平台集成
- 成长驱动因素
- 成长潜力分析
- 监管环境
- 北美洲
- 欧洲
- 亚太地区
- 拉丁美洲
- 中东和非洲
- 波特的分析
- PESTEL 分析
- 技术与创新格局
- 当前技术趋势
- 新兴技术
- 技术路线图与演进
- 技术采纳生命週期分析
- 价格趋势
- 按地区
- 副产品
- 专利分析
- 智慧城市与基础建设一体化
- 用于交通管理的自行车侦测技术
- 自行车电脑与交通基础建设的整合
- 市政自行车资料平台
- 製造商在智慧城市合作的机会
- 感测器生态系统及配件市场
- 感测器及收入贡献
- 速度和踏频感测器
- 心率监测器
- 功率计
- 新兴感测器类别
- 消费者行为与购买决策分析
- 购买决策因素及功能优先排序
- 品牌忠诚度与转换行为模式
- 职业自行车运动和运动员代言的影响
- 线上购物偏好与线下购物偏好
- 消费者趋势与偏好演变
- 转向触控萤幕介面而非按键介面
- 导航功能重要性成长
- 智慧型手机整合预期
- 电池续航力是关键的购买因素
- 零售通路动态与经销策略
- 专业自行车零售市占率及趋势
- 在线直接面向消费者 (DTC) 的成长
- 大众市场零售渗透
- OEM自行车捆绑销售
- 产品生命週期及使用模式分析
- 平均产品寿命和耐用性
- 韧体更新频率和长期支持
- 按使用者群体分類的使用强度
- 季节性使用变化和天气影响
- 未来展望与机会
第四章:竞争格局
- 介绍
- 公司市占率分析
- 北美洲
- 欧洲
- 亚太地区
- 拉丁美洲
- MEA
- 主要市场参与者的竞争分析
- 竞争定位矩阵
- 战略展望矩阵
- 关键进展
- 併购
- 合作伙伴关係与合作
- 新产品发布
- 扩张计划和资金
- 供应商选择标准
第五章:市场估算与预测:依产品划分,2022-2035年
- 有线
- 无线的
- 基于GPS的
- 太阳能驱动
- 其他的
第六章:市场估算与预测:依价格区间划分,2022-2035年
- 基本的
- 中檔
- 优质的
第七章:市场估算与预测:依感测器类型划分,2022-2035年
- 后轮感应器
- 速度/踏频感测器
- 梯度感测器
- 心率感测器
第八章:市场估算与预测:以连结方式划分,2022-2035年
- 蓝牙
- 无线上网
- ANT+
- 其他的
第九章:市场估价与预测:依自行车类型划分,2022-2035年
- 登山车
- 公路自行车
- 城市自行车
- 电动自行车
- 砾石自行车
第十章:市场估价与预测:依配销通路划分,2022-2035年
- 在线的
- 离线
第十一章:市场估计与预测:依应用领域划分,2022-2035年
- 体育运动
- 健身与通勤
- 休閒/娱乐
第十二章:市场估算与预测:依最终用途划分,2022-2035年
- 个人消费者
- 自行车租赁/车队营运商
- 职业球队/俱乐部
第十三章:市场估计与预测:依地区划分,2022-2035年
- 北美洲
- 我们
- 加拿大
- 欧洲
- 德国
- 英国
- 法国
- 义大利
- 西班牙
- 俄罗斯
- 北欧
- 比荷卢经济联盟
- 亚太地区
- 中国
- 印度
- 日本
- 韩国
- 澳新银行
- 新加坡
- 马来西亚
- 印尼
- 越南
- 泰国
- 拉丁美洲
- 巴西
- 墨西哥
- 阿根廷
- 哥伦比亚
- MEA
- 南非
- 沙乌地阿拉伯
- 阿联酋
第十四章:公司简介
- 全球公司
- Garmin
- Wahoo Fitness
- Polar Electro Oy
- Hammerhead
- Stages Cycling
- Lezyne
- 区域公司
- SIGMA
- Bryton
- CatEye
- Giant Manufacturing
- Specialized Bicycle Components
- Bosch eBike Systems
- Shimano
- Mio Technology
- 新兴公司
- Coospo
- iGPSPORT
- Magene
- Coros
- Suunto
- Omata
- Beeline
- Xplova
- Cycplus
- Trek Bicycle Corporation
- Cannondale
The Global Bike Computer Market was valued at USD 725.2 million in 2025 and is estimated to grow at a CAGR of 5.9% to reach USD 1.26 billion by 2035.
Growing interest in personal fitness and increasing integration of technology into everyday routines continue to elevate demand for devices that track speed, cadence, heart rate, and other performance indicators. Cycling has become a preferred activity for health-conscious individuals around the world, especially as concerns linked to lifestyle-related conditions, including diabetes, heart complications, and weight management, drive people toward more active habits. Environmental priorities also play a major role, as governments across multiple regions promote cycling to help lower carbon emissions and ease traffic congestion. Advancements in digital systems and the expanding role of AI and machine learning across mobility applications are expected to bring smarter, more intuitive bike computers to the market, strengthening their appeal. The growing adoption of cycling events and public wellness programs further supports the use of devices that enhance training and performance monitoring. As global awareness around fitness technology continues to rise, the overall demand for connected and intelligent bike computers is expected to accelerate.
| Market Scope | |
|---|---|
| Start Year | 2025 |
| Forecast Year | 2026-2035 |
| Start Value | $725.2 Million |
| Forecast Value | $1.26 Billion |
| CAGR | 5.9% |
The GPS-based segment held a 55.2% share in 2024. These devices have evolved far beyond earlier navigation tools and now provide detailed ride metrics that cyclists expect in real time. Their superior mapping capabilities make them the preferred choice compared with non-GPS alternatives, aligning with the worldwide growth of cycling for recreation, commuting, and exercise. As consumer expectations increase, riders consistently seek more accurate tracking of distance, speed, and related metrics.
The premium-priced bike computers segment will grow at a CAGR of 7.1% by 2034, owing to features such as AI-enhanced analytics, advanced health tracking, and smart battery optimization. Brands are concentrating on user preference trends to refine their offerings and introduce more integrated functions. This segment benefits from rising disposable incomes as buyers increasingly choose higher-end devices with extended capabilities.
U.S Bike Computer Market reached USD 185.2 million in 2025, supported by rapid growth in connected cycling technologies and an expanding population of bicycle users. Several companies continue to influence trends in the country by introducing next-generation features and setting benchmarks in product innovation.
Leading companies in the Bike Computer Market include Bryton, CatEye, COROS Wearables, Garmin, Hammerhead, Lezyne, Magene, Polar, Sigma, and Wahoo Fitness. Manufacturers in the bike computer industry are strengthening their market foothold by emphasizing innovation in data analytics, connectivity, and sensor technology. Many companies are deepening the integration of AI-driven insights to offer more accurate performance tracking and personalized ride analysis. Expanding product ecosystems through companion apps and wireless accessories helps brands build long-term engagement with cyclists. Firms are also focusing on lightweight designs, improved battery efficiency, and enhanced durability to appeal to both recreational and performance-oriented users. Strategic partnerships with cycling communities and professional teams help boost brand visibility, while targeted investments in premium product lines cater to consumers shifting toward high-end devices.
Table of Contents
Chapter 1 Methodology
- 1.1 Market scope and definition
- 1.2 Research design
- 1.2.1 Research approach
- 1.2.2 Data collection methods
- 1.3 Data mining sources
- 1.3.1 Global
- 1.3.2 Regional/Country
- 1.4 Base estimates and calculations
- 1.4.1 Base year calculation
- 1.4.2 Key trends for market estimation
- 1.5 Primary research and validation
- 1.5.1 Primary sources
- 1.6 Forecast
- 1.7 Research assumptions and limitations
Chapter 2 Executive Summary
- 2.1 Industry 3600 synopsis
- 2.2 Key market trends
- 2.2.1 Regional
- 2.2.2 Product
- 2.2.3 Price Range
- 2.2.4 Sensor
- 2.2.5 Connectivity
- 2.2.6 Bike
- 2.2.7 Distribution Channel
- 2.2.8 Application
- 2.2.9 End Use
- 2.3 TAM analysis, 2026-2035
- 2.4 CXO perspectives: Strategic imperatives
- 2.4.1 Executive decision points
- 2.4.2 Critical success factors
- 2.5 Future outlook and recommendations
Chapter 3 Industry Insights
- 3.1 Industry ecosystem analysis
- 3.1.1 Supplier landscape
- 3.1.2 Profit margin
- 3.1.3 Cost structure
- 3.1.4 Value addition at each stage
- 3.1.5 Factor affecting the value chain
- 3.1.6 Disruptions
- 3.2 Industry impact forces
- 3.2.1 Growth drivers
- 3.2.1.1 Global cycling participation growth & health consciousness trends
- 3.2.1.2 E-bike market expansion & integrated display demand
- 3.2.1.3 Professional cycling influence & UCI worldtour technology adoption
- 3.2.1.4 Smart city infrastructure development & cycling integration
- 3.2.2 Industry pitfalls and challenges
- 3.2.2.1 Smartphone substitution threat & free app alternatives
- 3.2.2.2 Theft risk & device security concerns in urban markets
- 3.2.3 Market opportunities
- 3.2.3.1 Emerging market penetration
- 3.2.3.2 E-bike integration & OEM partnership expansion
- 3.2.3.3 Gravel & adventure cycling segment expansion
- 3.2.3.4 Smart city & municipal cycling data platform integration
- 3.2.1 Growth drivers
- 3.3 Growth potential analysis
- 3.4 Regulatory landscape
- 3.4.1 North America
- 3.4.2 Europe
- 3.4.3 Asia Pacific
- 3.4.4 Latin America
- 3.4.5 Middle East & Africa
- 3.5 Porter's analysis
- 3.6 PESTEL analysis
- 3.7 Technology and innovation landscape
- 3.7.1 Current technological trends
- 3.7.2 Emerging technologies
- 3.7.3 Technology roadmaps & evolution
- 3.7.4 Technology adoption lifecycle analysis
- 3.8 Price trends
- 3.8.1 By region
- 3.8.2 By product
- 3.9 Patent analysis
- 3.10 Smart city & infrastructure integration
- 3.10.1 Bicycle detection technologies for traffic management
- 3.10.2 Bike computer integration with traffic infrastructure
- 3.10.3 Municipal cycling data platforms
- 3.10.4 Smart city partnership opportunities for manufacturers
- 3.11 Sensor ecosystem & accessory market
- 3.11.1 Sensor market overview & revenue contribution
- 3.11.2 Speed & cadence sensors
- 3.11.3 Heart rate monitors
- 3.11.4 Power meters
- 3.11.5 Emerging sensor categories
- 3.12 Consumer behavior & purchase decision analysis
- 3.12.1 Purchase decision factors & feature prioritization
- 3.12.2 Brand loyalty & switching behavior patterns
- 3.12.3 Influence of professional cycling & athlete endorsements
- 3.12.4 Online vs in-store purchase preferences
- 3.13 Consumer trends & preference evolution
- 3.13.1 Shift toward touchscreen vs button interfaces
- 3.13.2 Navigation feature importance growth
- 3.13.3 Smartphone integration expectations
- 3.13.4 Battery life as critical purchase factor
- 3.14 Retail channel dynamics & distribution strategies
- 3.14.1 Specialty cycling retail market share & trends
- 3.14.2 Online direct-to-consumer (DTC) growth
- 3.14.3 Mass market retail penetration
- 3.14.4 OEM bundling with bicycle purchases
- 3.15 Product lifecycle & usage pattern analysis
- 3.15.1 Average product lifespan & durability
- 3.15.2 Firmware update frequency & long-term support
- 3.15.3 Usage intensity by user segment
- 3.15.4 Seasonal usage variations & weather impact
- 3.16 Future outlook & opportunities
Chapter 4 Competitive Landscape, 2025
- 4.1 Introduction
- 4.2 Company market share analysis
- 4.2.1 North America
- 4.2.2 Europe
- 4.2.3 Asia Pacific
- 4.2.4 LATAM
- 4.2.5 MEA
- 4.3 Competitive analysis of major market players
- 4.4 Competitive positioning matrix
- 4.5 Strategic outlook matrix
- 4.6 Key developments
- 4.6.1 Mergers & acquisitions
- 4.6.2 Partnerships & collaborations
- 4.6.3 New product launches
- 4.6.4 Expansion plans and funding
- 4.7 Vendor selection criteria
Chapter 5 Market Estimates & Forecast, By Product, 2022 - 2035 ($Mn, Units)
- 5.1 Key trends
- 5.2 Wired
- 5.3 Wireless
- 5.4 GPS-based
- 5.4.1 Solar-powered
- 5.4.2 Others
Chapter 6 Market Estimates & Forecast, By Price Range, 2022 - 2035 ($Mn, Units)
- 6.1 Key trends
- 6.2 Basic
- 6.3 Mid-range
- 6.4 Premium
Chapter 7 Market Estimates & Forecast, By Sensor, 2022 - 2035 ($Mn, Units)
- 7.1 Key trends
- 7.2 Rear Wheel Sensor
- 7.3 Speed/Cadence Sensor
- 7.4 Gradient Sensor
- 7.5 Heart Rate Sensor
Chapter 8 Market Estimates & Forecast, By Connectivity, 2022 - 2035 ($Mn, Units)
- 8.1 Key trends
- 8.2 Bluetooth
- 8.3 Wi-Fi
- 8.4 ANT+
- 8.5 Others
Chapter 9 Market Estimates & Forecast, By Bike, 2022 - 2035 ($Mn, Units)
- 9.1 Key trends
- 9.2 Mountain bike
- 9.3 Road bike
- 9.4 Urban bike
- 9.5 E-bike
- 9.6 Gravel bike
Chapter 10 Market Estimates & Forecast, By Distribution Channel, 2022 - 2035 ($Mn, Units)
- 10.1 Key trends
- 10.2 Online
- 10.3 Offline
Chapter 11 Market Estimates & Forecast, By Application, 2022 - 2035 ($Mn, Units)
- 11.1 Key trends
- 11.2 Athletics & sports
- 11.3 Fitness & commuting
- 11.4 Recreational/leisure
Chapter 12 Market Estimates & Forecast, By End Use, 2022 - 2035 ($Mn, Units)
- 12.1 Key trends
- 12.2 Individual consumers
- 12.3 Bike rental/fleet operators
- 12.4 Professional teams/clubs
Chapter 13 Market Estimates & Forecast, By Region, 2022 - 2035 ($Mn, Units)
- 13.1 Key trends
- 13.2 North America
- 13.2.1 US
- 13.2.2 Canada
- 13.3 Europe
- 13.3.1 Germany
- 13.3.2 UK
- 13.3.3 France
- 13.3.4 Italy
- 13.3.5 Spain
- 13.3.6 Russia
- 13.3.7 Nordics
- 13.3.8 Benelux
- 13.4 Asia Pacific
- 13.4.1 China
- 13.4.2 India
- 13.4.3 Japan
- 13.4.4 South Korea
- 13.4.5 ANZ
- 13.4.6 Singapore
- 13.4.7 Malaysia
- 13.4.8 Indonesia
- 13.4.9 Vietnam
- 13.4.10 Thailand
- 13.5 Latin America
- 13.5.1 Brazil
- 13.5.2 Mexico
- 13.5.3 Argentina
- 13.5.4 Colombia
- 13.6 MEA
- 13.6.1 South Africa
- 13.6.2 Saudi Arabia
- 13.6.3 UAE
Chapter 14 Company Profiles
- 14.1 Global companies
- 14.1.1 Garmin
- 14.1.2 Wahoo Fitness
- 14.1.3 Polar Electro Oy
- 14.1.4 Hammerhead
- 14.1.5 Stages Cycling
- 14.1.6 Lezyne
- 14.2 Regional companies
- 14.2.1 SIGMA
- 14.2.2 Bryton
- 14.2.3 CatEye
- 14.2.4 Giant Manufacturing
- 14.2.5 Specialized Bicycle Components
- 14.2.6 Bosch eBike Systems
- 14.2.7 Shimano
- 14.2.8 Mio Technology
- 14.3 Emerging companies
- 14.3.1 Coospo
- 14.3.2 iGPSPORT
- 14.3.3 Magene
- 14.3.4 Coros
- 14.3.5 Suunto
- 14.3.6 Omata
- 14.3.7 Beeline
- 14.3.8 Xplova
- 14.3.9 Cycplus
- 14.3.10 Trek Bicycle Corporation
- 14.3.11 Cannondale
 2026年全球智慧后视镜电子产品市场报告2026年全球汽车行动工业处理器介面(MIPI)相机模组市场报告2026年全球自行车摄影机市场报告
 汽车行车记录器市场 - 全球产业规模、份额、趋势、机会、预测:按类型、技术、分销管道、地区和竞争格局划分,2021-2031年
 汽车热感仪市场:按技术、解析度、应用、最终用户和分销管道划分 - 全球预测(2026-2032年)
 车载摄影机市场规模、份额及成长分析(按摄影机类型、车辆类型、技术、最终用户和地区划分)-2026-2033年产业预测车辆B柱脸部辨识技术市场:依应用、车辆类别、车辆类型、技术及安装方式划分-2026-2032年全球预测汽车摄影机市场-全球产业规模、份额、趋势、机会和预测,按摄影机类型、应用类型、车辆类型、地区和竞争格局划分,2021-2031年预测
 行车记录器市场规模、份额及成长分析(按技术、产品、影像品质、应用、分销和地区划分)-2026-2033年产业预测
 汽车摄影机市场规模、份额和成长分析(按技术、视觉类型、自动驾驶等级、应用、车辆类型、电动汽车类型和地区划分)-2026-2033年产业预测