


 |
市场调查报告书
商品编码
1913295
无伺服器架构市场机会、成长要素、产业趋势分析及预测(2026-2035年)Serverless Architecture Market Opportunity, Growth Drivers, Industry Trend Analysis, and Forecast 2026 - 2035 |
||||||
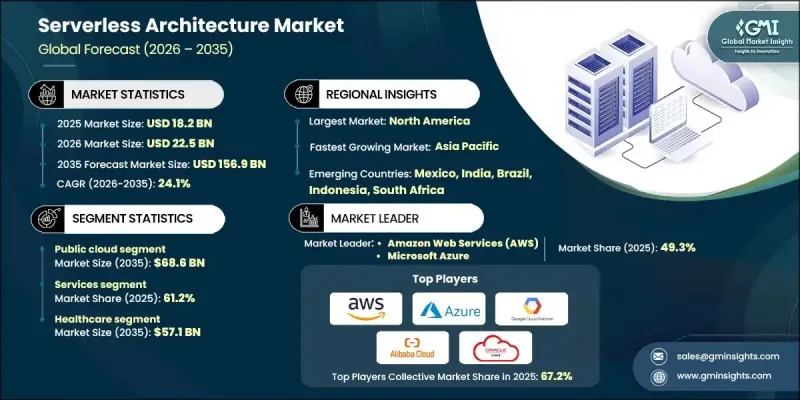
全球无伺服器架构市场预计到 2025 年将达到 182 亿美元,到 2035 年将达到 1,569 亿美元,年复合成长率为 24.1%。
无伺服器架构市场的成长主要得益于人工智慧和机器学习的日益融合、即时分析的普及,以及金融、医疗保健和物联网等产业对现代工作负载的广泛应用。企业正在迁移到无伺服器技术,以利用其灵活且以营运成本主导的模式来优化营运效率。向微服务和云端原生设计的转变实现了敏捷开发、模组化应用部署、独立服务扩展和更高的资源利用率,这些都与无伺服器执行模型相契合。企业现在正应用无伺服器框架来训练复杂的人工智慧模型、运行生成式模拟、进行风险建模以及处理高效能运算任务。云端原生架构与先进运算能力的无缝结合正在推动其广泛应用,尤其是在那些需要自动化系统来运行次世代应用程式的企业中。
| 市场覆盖范围 | |
|---|---|
| 开始年份 | 2025 |
| 预测年份 | 2026-2035 |
| 起始值 | 182亿美元 |
| 预测金额 | 1569亿美元 |
| 复合年增长率 | 24.1% |
由于其柔软性、成本效益以及与人工智慧、分析和事件驱动型工作负载的集成,预计到2035年,公共云端市场规模将达到686亿美元。企业越来越依赖公共云端解决方案,因为它们使企业能够快速部署应用程序,而无需大量的领先基础设施投资。计量收费模式降低了营运成本,同时也使企业能够根据需求动态扩展资源。
到2025年,服务领域将占据61.2%的市场份额,这反映出市场对託管式无伺服器服务、咨询和整合支援的需求不断增长。服务供应商正致力于建立功能丰富的平台,以支援人工智慧、分析和多重云端部署,从而推动技术应用并简化营运。
预计到2025年,北美无伺服器架构市场将占据33.5%的市场份额,并在2035年之前以24.9%的复合年增长率成长。该地区正经历快速的普及,这主要得益于企业数位转型、人工智慧/机器学习整合以及可扩展、高性价比云端解决方案的需求。对GPU加速的无伺服器平台的投资正在推动各行各业实现高效能、即时运算。
目录
第一章调查方法
第二章执行摘要
第三章业界考察
- 生态系分析
- 供应商情况
- 利润率分析
- 成本结构
- 每个阶段的附加价值
- 影响价值链的因素
- 中断
- 产业影响因素
- 司机
- 人工智慧/机器学习整合、即时数据处理和现代工作负载
- 各行各业(包括金融、医疗保健和物联网)的跨领域应用需求推动了这一趋势。
- 成本效益和资源优化(重点关注营运支出(OPEX)而非资本支出(CAPEX))
- 向微服务/云端原生架构转型
- 多重云端和混合云端的日益普及提高了柔软性。
- 产业潜在风险与挑战
- 对底层基础设施的可见性和控制力有限
- 与主要云端服务供应商的供应商锁定风险
- 市场机会
- 无伺服器技术在边缘运算和分散式架构中的兴起
- 以人工智慧代理程式和自动化为导向的 FaaS(函数即服务)解决方案的成长
- 对整合无伺服器后端的低程式码和无程式码平台的需求日益增长
- 在 DevOps 和 AIOps 管线中采用无伺服器架构以实现持续自动化
- 司机
- 成长潜力分析
- 监管环境
- 北美洲
- 欧洲
- 亚太地区
- 拉丁美洲
- 中东和非洲
- 波特五力分析
- PESTEL 分析
- 科技与创新趋势
- 当前技术趋势
- 新兴技术
- 新兴经营模式
- 合规要求
- 专利和智慧财产权分析
- 地缘政治和贸易趋势
第四章 竞争情势
- 介绍
- 公司市占率分析
- 按地区
- 北美洲
- 欧洲
- 亚太地区
- 拉丁美洲
- 中东和非洲
- 按地区
- 主要企业的竞争标竿分析
- 财务绩效比较
- 收入
- 利润率
- 研究与开发
- 产品系列比较
- 产品线的广度
- 科技
- 创新
- 按地区比较存在状况
- 全球扩张分析
- 服务网路覆盖
- 按地区分類的市场渗透率
- 竞争定位矩阵
- 领导企业
- 受让人
- 追踪者
- 小众玩家
- 战略展望矩阵
- 财务绩效比较
- 2022-2025 年主要发展动态
- 併购
- 合作伙伴关係和合资企业
- 技术进步
- 扩张与投资策略
- 数位转型计划
- 新兴/Start-Ups竞赛的趋势
第五章 依服务类型分類的市场估算与预测,2022-2035年
- Function as a Service(FaaS)
- 后端即服务 (BaaS)
第六章 依实施类型分類的市场估计与预测,2022-2035年
- 公共云端
- 私有云端
- 混合云端
第七章 依公司规模分類的市场估计与预测,2022-2035年
- 中小企业
- 大公司
第八章 按组件分類的市场估算与预测,2022-2035年
- 服务
- 专业服务
- 咨询服务
- 培训和教育
- 整合和测试服务
- 支援与维护
- 託管服务
- 专业服务
- 平台
第九章 2022-2035年各产业市场估算与预测
- 资讯科技和电信
- 卫生保健
- 零售与电子商务
- 银行、金融服务和保险(BFSI)
- 政府
- 教育
- 其他的
第十章 2022-2035年各地区市场估计与预测
- 北美洲
- 美国
- 加拿大
- 欧洲
- 德国
- 英国
- 法国
- 义大利
- 西班牙
- 荷兰
- 亚太地区
- 中国
- 印度
- 日本
- 澳洲
- 韩国
- 拉丁美洲
- 巴西
- 墨西哥
- 阿根廷
- 中东和非洲
- 南非
- 沙乌地阿拉伯
- 阿拉伯聯合大公国
第十一章:公司简介
- 主要企业
- Amazon Web Services(AWS)
- Microsoft Azure
- Google Cloud Platform(GCP)
- Oracle Cloud
- 按地区分類的主要企业
- 北美洲
- IBM Cloud
- Red Hat(IBM)
- Salesforce
- 欧洲
- VMware
- TIBCO Software
- Deloitte
- 亚太地区
- Alibaba Cloud
- Fujitsu
- SAP
- 北美洲
- 小众玩家/颠覆者
- DigitalOcean
- Akamai Technologies
- Netlify
- Cloudflare
- Couchbase
- Postman
- Tencent Cloud
- Hewlett Packard Enterprise(HPE)
The Global Serverless Architecture Market was valued at USD 18.2 billion in 2025 and is estimated to grow at a CAGR of 24.1% to reach USD 156.9 billion by 2035.
The growth of the serverless architecture market is being propelled by the increasing integration of AI and machine learning, real-time analytics, and the adoption of modern workloads across industries such as finance, healthcare, and IoT. Organizations are shifting toward serverless technologies to leverage flexible, OPEX-driven models that optimize operational efficiency. The move to microservices and cloud-native designs enables agile development, modular application deployment, independent service scaling, and better resource utilization, which aligns with serverless execution models. Enterprises are now applying serverless frameworks to train complex AI models, run generative simulations, perform risk modeling, and handle high-performance computing tasks. The seamless combination of cloud-native architecture and advanced computing capabilities is driving widespread adoption, particularly among businesses that require automated systems for next-generation applications.
| Market Scope | |
|---|---|
| Start Year | 2025 |
| Forecast Year | 2026-2035 |
| Start Value | $18.2 Billion |
| Forecast Value | $156.9 Billion |
| CAGR | 24.1% |
The public cloud segment is expected to reach USD 68.6 billion by 2035, driven by its flexibility, cost efficiency, and integration with AI, analytics, and event-driven workloads. Businesses are increasingly relying on public cloud solutions because they allow rapid deployment of applications without the need for heavy upfront infrastructure investments. The pay-as-you-go model reduces operational costs while enabling organizations to scale resources dynamically based on demand.
The services segment accounted for a 61.2% share in 2025, reflecting growing demand for managed serverless services, consulting, and integration support. Providers are focusing on creating feature-rich platforms that support AI, analytics, and multi-cloud deployments to facilitate adoption and operational efficiency.
North America Serverless Architecture Market held a 33.5% share in 2025 and is forecasted to grow at a CAGR of 24.9% through 2035. The region is witnessing rapid adoption due to enterprise digital transformation, AI/ML integration, and the need for scalable, cost-effective cloud solutions. Investments in GPU-accelerated serverless platforms are enabling high-performance, real-time computing for a range of industries.
Key players operating in the Global Serverless Architecture Market include Microsoft Azure, Amazon Web Services (AWS), Google Cloud Platform (GCP), IBM Cloud, Oracle Cloud, Alibaba Cloud, Red Hat (IBM), Salesforce, and Fujitsu. Companies in the Global Serverless Architecture Market are focusing on several strategies to strengthen their position. They are investing in research and development to enhance platform capabilities, including AI and analytics integration, multi-cloud support, and real-time processing features. Strategic partnerships with enterprise clients and cloud service providers help expand reach and market penetration. Firms are offering managed services, consulting, and integration support to simplify adoption for businesses.
Table of Contents
Chapter 1 Methodology
- 1.1 Market scope and definition
- 1.2 Research design
- 1.2.1 Research approach
- 1.2.2 Data collection methods
- 1.3 Data mining sources
- 1.3.1 Global
- 1.3.2 Regional/Country
- 1.4 Base estimates and calculations
- 1.4.1 Base year calculation
- 1.4.2 Key trends for market estimation
- 1.5 Primary research and validation
- 1.5.1 Primary sources
- 1.6 Forecast model
- 1.7 Research assumptions and limitations
Chapter 2 Executive Summary
- 2.1 Industry 360° synopsis, 2021 - 2034
- 2.2 Key market trends
- 2.2.1 Service type trends
- 2.2.2 Deployment mode trends
- 2.2.3 Platform trends
- 2.2.4 Organization Size trends
- 2.2.5 Component trends
- 2.2.6 Industry vertical trends
- 2.2.7 Regional trends
- 2.3 TAM analysis, 2025-2034
- 2.4 CXO perspectives: Strategic imperatives
- 2.4.1 Executive decision points
- 2.4.2 Critical success factors
- 2.5 Future outlook and strategic recommendations
Chapter 3 Industry Insights
- 3.1 Industry ecosystem analysis
- 3.1.1 Supplier landscape
- 3.1.2 Profit margin analysis
- 3.1.3 Cost structure
- 3.1.4 Value addition at each stage
- 3.1.5 Factor affecting the value chain
- 3.1.6 Disruptions
- 3.2 Industry impact forces
- 3.2.1 Growth drivers
- 3.2.1.1 Integration with AI/ML, real-time data processing and modern workloads
- 3.2.1.2 Demand from cross-industry adoption across sectors (e.g. finance, healthcare, IoT)
- 3.2.1.3 Cost efficiency and resource-optimization (OPEX over CAPEX)
- 3.2.1.4 Shift toward microservices / cloud-native architectures
- 3.2.1.5 Rising multi-cloud and hybrid-cloud adoption enabling flexibility
- 3.2.2 Industry pitfalls and challenges
- 3.2.2.1 Limited visibility and control over underlying infrastructure
- 3.2.2.2 Vendor lock-in risks across major cloud providers
- 3.2.3 Market opportunities
- 3.2.3.1 Expansion of serverless in edge computing and distributed architectures
- 3.2.3.2 Growth of function-as-a-service solutions for AI agents and automation
- 3.2.3.3 Rising demand for low-code and no-code platforms integrating serverless backends
- 3.2.3.4 Adoption of serverless in DevOps and AIOps pipelines for continuous automation
- 3.2.1 Growth drivers
- 3.3 Growth potential analysis
- 3.4 Regulatory landscape
- 3.4.1 North America
- 3.4.2 Europe
- 3.4.3 Asia Pacific
- 3.4.4 Latin America
- 3.4.5 Middle East & Africa
- 3.5 Porter's analysis
- 3.6 PESTEL analysis
- 3.7 Technology and innovation landscape
- 3.7.1 Current technological trends
- 3.7.2 Emerging technologies
- 3.8 Emerging business models
- 3.9 Compliance requirements
- 3.10 Patent and IP analysis
- 3.11 Geopolitical and trade dynamics
Chapter 4 Competitive Landscape, 2025
- 4.1 Introduction
- 4.2 Company market share analysis
- 4.2.1 By region
- 4.2.1.1 North America
- 4.2.1.2 Europe
- 4.2.1.3 Asia Pacific
- 4.2.1.4 Latin America
- 4.2.1.5 Middle East & Africa
- 4.2.1 By region
- 4.3 Competitive benchmarking of key players
- 4.3.1 Financial performance comparison
- 4.3.1.1 Revenue
- 4.3.1.2 Profit margin
- 4.3.1.3 R&D
- 4.3.2 Product portfolio comparison
- 4.3.2.1 Product range breadth
- 4.3.2.2 Technology
- 4.3.2.3 Innovation
- 4.3.3 Geographic presence comparison
- 4.3.3.1 Global footprint analysis
- 4.3.3.2 Service network coverage
- 4.3.3.3 Market penetration by region
- 4.3.4 Competitive positioning matrix
- 4.3.4.1 Leaders
- 4.3.4.2 Challengers
- 4.3.4.3 Followers
- 4.3.4.4 Niche players
- 4.3.5 Strategic outlook matrix
- 4.3.1 Financial performance comparison
- 4.4 Key developments, 2022-2025
- 4.4.1 Mergers and acquisitions
- 4.4.2 Partnerships and collaborations
- 4.4.3 Technological advancements
- 4.4.4 Expansion and investment strategies
- 4.4.5 Digital transformation initiatives
- 4.5 Emerging/ startup competitors landscape
Chapter 5 Market Estimates and Forecast, By Service Type, 2022 - 2035 (USD Million)
- 5.1 Key trends
- 5.2 Function as a service (FaaS)
- 5.3 Backend as a service (BaaS)
Chapter 6 Market Estimates and Forecast, By Deployment Mode, 2022 - 2035 (USD Million)
- 6.1 Key trends
- 6.2 Public cloud
- 6.3 Private cloud
- 6.4 Hybrid cloud
Chapter 7 Market Estimates and Forecast, By Organization Size, 2022 - 2035 (USD Million)
- 7.1 Key trends
- 7.2 Small and medium enterprises (SME)
- 7.3 Large enterprises
Chapter 8 Market Estimates and Forecast, By Component, 2022 - 2035 (USD Million)
- 8.1 Key trends
- 8.2 Services
- 8.2.1 Professional Services
- 8.2.1.1 Consulting Services
- 8.2.1.2 Training and Education
- 8.2.1.3 Integration and Testing Services
- 8.2.1.4 Support and Maintenance
- 8.2.2 Managed Services
- 8.2.1 Professional Services
- 8.3 Platform
Chapter 9 Market Estimates and Forecast, By Industry Vertical, 2022 - 2035 (USD Million)
- 9.1 Key trends
- 9.2 IT and Telecom
- 9.3 Healthcare
- 9.4 Retail and E-commerce
- 9.5 Banking, Financial Services, and Insurance (BFSI)
- 9.6 Government
- 9.7 Education
- 9.8 Others
Chapter 10 Market Estimates & Forecast, By Region, 2022 - 2035 (USD Million)
- 10.1 Key trends
- 10.2 North America
- 10.2.1 U.S.
- 10.2.2 Canada
- 10.3 Europe
- 10.3.1 Germany
- 10.3.2 UK
- 10.3.3 France
- 10.3.4 Italy
- 10.3.5 Spain
- 10.3.6 Netherlands
- 10.4 Asia Pacific
- 10.4.1 China
- 10.4.2 India
- 10.4.3 Japan
- 10.4.4 Australia
- 10.4.5 South Korea
- 10.5 Latin America
- 10.5.1 Brazil
- 10.5.2 Mexico
- 10.5.3 Argentina
- 10.6 MEA
- 10.6.1 South Africa
- 10.6.2 Saudi Arabia
- 10.6.3 UAE
Chapter 11 Company Profiles
- 11.1 Global Key Players
- 11.1.1 Amazon Web Services (AWS)
- 11.1.2 Microsoft Azure
- 11.1.3 Google Cloud Platform (GCP)
- 11.1.4 Oracle Cloud
- 11.2 Regional Key Players
- 11.2.1 North America
- 11.2.1.1 IBM Cloud
- 11.2.1.2 Red Hat (IBM)
- 11.2.1.3 Salesforce
- 11.2.2 Europe
- 11.2.2.1 VMware
- 11.2.2.2 TIBCO Software
- 11.2.2.3 Deloitte
- 11.2.3 APAC
- 11.2.3.1 Alibaba Cloud
- 11.2.3.2 Fujitsu
- 11.2.3.3 SAP
- 11.2.1 North America
- 11.3 Niche Players / Disruptors
- 11.3.1 DigitalOcean
- 11.3.2 Akamai Technologies
- 11.3.3 Netlify
- 11.3.4 Cloudflare
- 11.3.5 Couchbase
- 11.3.6 Postman
- 11.3.7 Tencent Cloud
- 11.3.8 Hewlett Packard Enterprise (HPE)
 2026年全球无伺服器容器市场报告2026年全球无伺服器架构市场报告
 无伺服器架构全球市场规模、份额、趋势和成长分析报告(2026-2034)
 无伺服器架构市场规模、份额和成长分析(按部署类型、组织规模、垂直产业和地区划分)-2026年至2033年产业预测
 2025 年至 2033 年无伺服器架构市场报告(按服务类型、部署模型、组织规模、产业垂直和地区)
 全球无伺服器架构市场规模、份额、趋势分析报告(按组织规模、部署、服务、产业、地区、展望与预测,2024-2031 年)
 无伺服器架构市场规模、份额、趋势分析报告:按服务、按部署、按组织规模、按行业、按地区、细分市场预测,2024-2030 年