


 |
市场调查报告书
商品编码
1913326
食品涂料配料市场机会、成长要素、产业趋势分析及预测(2026年至2035年)Food Coating Ingredients Market Opportunity, Growth Drivers, Industry Trend Analysis, and Forecast 2026 - 2035 |
||||||
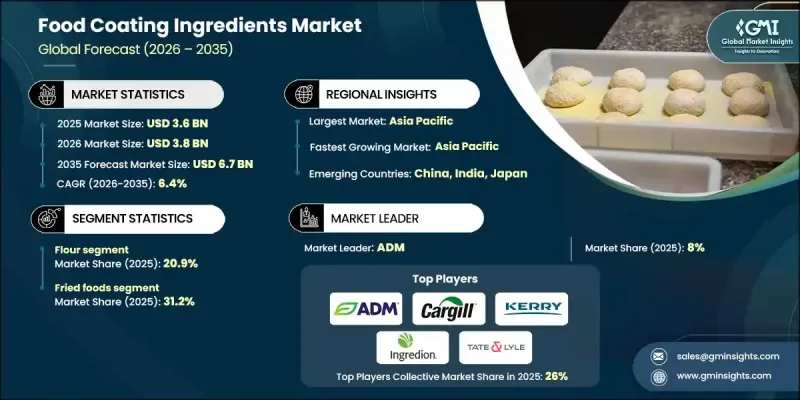
全球食品涂料配料市场预计到 2025 年将达到 36 亿美元,到 2035 年将达到 67 亿美元,年复合成长率为 6.4%。
食品涂层配料是配製好的混合物,用于改善食品的视觉吸引力、口感、味道一致性和货架稳定性。这些解决方案包括涂层、麵包屑、麵粉、淀粉、蛋白质、香辛料和调味体系,为各种食品打造功能性外层。其应用范围涵盖油炸食品、烘焙食品、零食、糖果甜点和包装食品,大型生产商和餐饮服务业都在使用。即食食品需求的成长、对植物来源配方的日益偏好以及对成分透明度的意识提升,正在重塑创新重点。洁净标示的要求对配方决策产生了重大影响,消费者倾向于选择成分简单、易于识别且加工过程最少的产品。随着年轻消费者积极查看标籤和产品成分,供应商正在转向天然、非基因改造、有机和低致敏性解决方案。配方改良的重点在于替代合成成分、减少添加剂,并透过替代保鲜技术延长保质期,从而推动产品开发,以满足不断增长的消费者信任和监管标准。
| 市场覆盖范围 | |
|---|---|
| 开始年份 | 2025 |
| 预测年份 | 2026-2035 |
| 起始值 | 36亿美元 |
| 预测金额 | 67亿美元 |
| 复合年增长率 | 6.4% |
预计到2025年,麵粉基涂层产品将占市场份额的20.9%。小麦粉因其功能性强、用途广泛且经济实惠,仍是油炸食品、烘焙点心和加工食品等类别的核心原料。虽然小麦粉仍然是最常用的麵粉,但由于无麸质产品消费量的增长,大米粉、鹰嘴豆粉和特殊谷物粉的需求也在持续增长。
预计到2025年,油炸食品应用领域将占据31.2%的市场份额,这主要得益于快餐店的扩张、冷冻食品消费量的增长以及全球对裹粉和涂层产品的稳定需求。在过去一段时间内,即食食品的消费量增加了约26%,推动了销量的成长。低脂涂层系统正被越来越多地采用,以减少油脂吸收,同时保持食品的质地和风味。
预计到2025年,北美食品涂料配料市场份额将达到24.1%。该地区受益于强大的餐饮服务业、成熟的冷冻食品行业以及对有机和天然配料的稳定需求。对加工能力和永续生产实践的持续投资将继续支撑区域市场的强劲势头。
目录
第一章调查方法和范围
第二章执行摘要
第三章业界考察
- 生态系分析
- 供应商情况
- 利润率
- 每个阶段的附加价值
- 影响价值链的因素
- 中断
- 产业影响因素
- 司机
- 产业潜在风险与挑战
- 市场机会
- 成长潜力分析
- 监管环境
- 北美洲
- 欧洲
- 亚太地区
- 拉丁美洲
- 中东和非洲
- 波特五力分析
- PESTEL 分析
- 价格趋势
- 未来市场趋势
- 科技与创新趋势
- 当前技术趋势
- 新兴技术
- 专利状态
- 贸易统计(HS编码)
(註:贸易统计数据仅涵盖主要国家。)
- 主要进口国
- 主要出口国
第四章 竞争情势
- 介绍
- 公司市占率分析
- 按地区
- 北美洲
- 欧洲
- 亚太地区
- 拉丁美洲
- 中东和非洲
- 按地区
- 企业矩阵分析
- 主要市场公司的竞争分析
- 竞争定位矩阵
- 重大进展
- 併购
- 伙伴关係与合作
- 新产品发布
- 业务拓展计划
第五章 按类型分類的市场估算与预测,2022-2035年
- 连击
- 麵包屑
- 细粒
- 中等颗粒
- 粗粒
- 麵粉
- 小麦
- 米
- 玉米
- 其他的
- 淀粉
- 玉米
- 马铃薯
- 木薯(木薯粉)
- 小麦
- 米
- 调味料和香辛料
- 草药
- 香辛料
- 混合
- 盐的变化
- 蛋白质
- 动物
- 植物
- 其他的
第六章 按应用领域分類的市场估算与预测,2022-2035年
- 油炸食品
- 肉类/家禽
- 水产品
- 蔬菜
- 乳酪和乳製品
- 烘焙点心
- 咸
- 甜味
- 小吃和开胃菜
- 加工食品
- 糖果甜点
- 其他的
7. 2022-2035年按分销管道分類的市场估算与预测
- 超级市场/大卖场
- 零售店
- 线上零售
- 电子商务市场
- 品牌 D2C
- 其他的
第八章 2022-2035年各地区市场估算与预测
- 北美洲
- 美国
- 加拿大
- 欧洲
- 德国
- 英国
- 法国
- 西班牙
- 义大利
- 其他欧洲地区
- 亚太地区
- 中国
- 印度
- 日本
- 澳洲
- 韩国
- 亚太其他地区
- 拉丁美洲
- 巴西
- 墨西哥
- 阿根廷
- 其他拉丁美洲地区
- 中东和非洲
- 沙乌地阿拉伯
- 南非
- 阿拉伯聯合大公国
- 其他中东和非洲地区
第九章:公司简介
- Archer Daniels Midland Company(ADM)
- Cargill Incorporated
- Kerry Group
- Ingredion Incorporated
- Tate &Lyle PLC
- Ashland Global Holdings Inc
- PGP International, Inc(A Bunge Limited Company)
- Dohler Group
- Bowman Ingredients
- SensoryEffects(A division of Balchem Corporation)
- Bunge Limited
- Continental Mills, Inc
- Givaudan SA
- Kerry Taste &Nutrition
The Global Food Coating Ingredients Market was valued at USD 3.6 billion in 2025 and is estimated to grow at a CAGR of 6.4% to reach USD 6.7 billion by 2035.
Food coating ingredients are formulated blends applied to food products to improve visual appeal, mouthfeel, taste consistency, and storage stability. These solutions include batters, crumbs, flours, starches, proteins, spices, and seasoning systems that form functional outer layers across a wide range of foods. Applications span fried items, bakery products, snacks, confectionery, and processed foods, serving large-scale manufacturers as well as foodservice operators. Rising demand for convenience foods, increasing preference for plant-based formulations, and heightened awareness around ingredient transparency are reshaping innovation priorities. Clean-label expectations now influence formulation decisions on a scale, with buyers favoring simple, recognizable ingredients and minimal processing. Younger consumers actively review labels and product composition, prompting suppliers to shift toward natural, non-GMO, organic, and allergen-conscious solutions. Reformulation efforts focus on replacing synthetic components, reducing additives, and extending shelf life through alternative preservation techniques that align with evolving consumer trust and regulatory standards.
| Market Scope | |
|---|---|
| Start Year | 2025 |
| Forecast Year | 2026-2035 |
| Start Value | $3.6 Billion |
| Forecast Value | $6.7 Billion |
| CAGR | 6.4% |
The flour-based coatings segment accounted for 20.9% share in 2025. Flour remains a core input across fried foods, baked goods, and processed categories due to its functional adaptability and cost efficiency. Wheat flour leads usage volumes, while rice, chickpea, and specialty grain flours continue gaining traction as gluten-free consumption rises.
The fried food applications segment held 31.2% share in 2025, supported by the expansion of quick-service dining, frozen meal consumption, and steady global demand for breaded and battered products. Consumption of ready-to-eat foods increased by about 26% over a defined historical period, reinforcing volume growth. Reduced-fat coating systems are increasingly adopted to lower oil absorption while preserving texture and flavor.
North America Food Coating Ingredients Market held 24.1% share in 2025. The region benefits from a strong foodservice presence, a well-established frozen foods sector, and consistent demand for organic and naturally positioned ingredients. Ongoing investments in processing capacity and sustainable manufacturing practices continue to support regional market strength.
Key companies active in the Global Food Coating Ingredients Market include Kerry Taste & Nutrition, Cargill Incorporated, Ingredion Incorporated, Archer Daniels Midland Company, Tate & Lyle PLC, Givaudan SA, Bunge Limited, Dohler Group, Ashland Global Holdings Inc, SensoryEffects, Continental Mills, Inc, Bowman Ingredients, and PGP International. Companies operating in the Global Food Coating Ingredients Market strengthen their competitive position through product innovation, portfolio diversification, and strategic customer alignment. Leading players invest in clean-label research, plant-based formulations, and functional performance improvements to meet evolving consumer and regulatory expectations. Capacity expansion and regional production optimization improve supply reliability and cost efficiency. Firms also emphasize customized solutions for industrial clients, supported by application testing and technical services.
Table of Contents
Chapter 1 Methodology & Scope
- 1.1 Market scope and definition
- 1.2 Research design
- 1.2.1 Research approach
- 1.2.2 Data collection methods
- 1.3 Data mining sources
- 1.3.1 Global
- 1.3.2 Regional/Country
- 1.4 Base estimates and calculations
- 1.4.1 Base year calculation
- 1.4.2 Key trends for market estimation
- 1.5 Primary research and validation
- 1.5.1 Primary sources
- 1.6 Forecast model
- 1.7 Research assumptions and limitations
Chapter 2 Executive Summary
- 2.1 Industry 360° synopsis
- 2.2 Key market trends
- 2.2.1 Regional
- 2.2.2 Type
- 2.2.3 Application
- 2.2.4 Distribution Channel
- 2.3 TAM Analysis, 2025-2034
- 2.4 CXO perspectives: Strategic imperatives
- 2.4.1 Executive decision points
- 2.4.2 Critical success factors
- 2.5 Future Outlook and Strategic Recommendations
Chapter 3 Industry Insights
- 3.1 Industry ecosystem analysis
- 3.1.1 Supplier landscape
- 3.1.2 Profit margin
- 3.1.3 Value addition at each stage
- 3.1.4 Factor affecting the value chain
- 3.1.5 Disruptions
- 3.2 Industry impact forces
- 3.2.1 Growth drivers
- 3.2.2 Industry pitfalls and challenges
- 3.2.3 Market opportunities
- 3.3 Growth potential analysis
- 3.4 Regulatory landscape
- 3.4.1 North America
- 3.4.2 Europe
- 3.4.3 Asia Pacific
- 3.4.4 Latin America
- 3.4.5 Middle East & Africa
- 3.5 Porter's analysis
- 3.6 PESTEL analysis
- 3.7 Price trends
- 3.8 Future market trends
- 3.9 Technology and Innovation landscape
- 3.9.1 Current technological trends
- 3.9.2 Emerging technologies
- 3.10 Patent Landscape
- 3.11 Trade statistics (HS code)
( Note: the trade statistics will be provided for key countries only)
- 3.11.1 Major importing countries
- 3.11.2 Major exporting countries
Chapter 4 Competitive Landscape, 2025
- 4.1 Introduction
- 4.2 Company market share analysis
- 4.2.1 By region
- 4.2.1.1 North America
- 4.2.1.2 Europe
- 4.2.1.3 Asia Pacific
- 4.2.1.4 LATAM
- 4.2.1.5 MEA
- 4.2.1 By region
- 4.3 Company matrix analysis
- 4.4 Competitive analysis of major market players
- 4.5 Competitive positioning matrix
- 4.6 Key developments
- 4.6.1 Mergers & acquisitions
- 4.6.2 Partnerships & collaborations
- 4.6.3 New Product Launches
- 4.6.4 Expansion Plans
Chapter 5 Market Estimates and Forecast, By Type, 2022-2035 (USD Billion & Tons)
- 5.1 Key trends
- 5.2 Batter
- 5.3 Breadcrumb
- 5.3.1 Fine
- 5.3.2 Medium
- 5.3.3 Coarse
- 5.4 Flour
- 5.4.1 Wheat
- 5.4.2 Rice
- 5.4.3 Corn
- 5.4.4 Others
- 5.5 Starches
- 5.5.1 Corn
- 5.5.2 Potato
- 5.5.3 Tapioca (cassava)
- 5.5.4 Wheat
- 5.5.5 Rice
- 5.6 Seasonings and Spices
- 5.6.1 Herbs
- 5.6.2 Spices
- 5.6.3 Blends
- 5.6.4 Salt variants
- 5.7 Proteins
- 5.7.1 Animal
- 5.7.2 Plant
- 5.8 Others
Chapter 6 Market Estimates and Forecast, By Application, 2022-2035 (USD Billion & Tons)
- 6.1 Key trends
- 6.2 Fried Foods
- 6.2.1 Meat & Poultry
- 6.2.2 Seafood
- 6.2.3 Vegetables
- 6.2.4 Cheese & Dairy
- 6.3 Baked Foods
- 6.3.1 Savory
- 6.3.2 Sweet
- 6.4 Snacks and Appetizers
- 6.5 Processed Foods
- 6.6 Confectionery
- 6.7 Others
Chapter 7 Market Estimates and Forecast, By Distribution Channel, 2022-2035 (USD Billion & Tons)
- 7.1 Key trends
- 7.2 Supermarkets/Hypermarket
- 7.3 Retail stores
- 7.4 Online retail
- 7.4.1 E-commerce marketplaces
- 7.4.2 Brand D2C
- 7.5 Others
Chapter 8 Market Estimates and Forecast, By Region, 2022-2035 (USD Billion & Tons)
- 8.1 Key trends
- 8.2 North America
- 8.2.1 U.S.
- 8.2.2 Canada
- 8.3 Europe
- 8.3.1 Germany
- 8.3.2 UK
- 8.3.3 France
- 8.3.4 Spain
- 8.3.5 Italy
- 8.3.6 Rest of Europe
- 8.4 Asia Pacific
- 8.4.1 China
- 8.4.2 India
- 8.4.3 Japan
- 8.4.4 Australia
- 8.4.5 South Korea
- 8.4.6 Rest of Asia Pacific
- 8.5 Latin America
- 8.5.1 Brazil
- 8.5.2 Mexico
- 8.5.3 Argentina
- 8.5.4 Rest of Latin America
- 8.6 Middle East and Africa
- 8.6.1 Saudi Arabia
- 8.6.2 South Africa
- 8.6.3 UAE
- 8.6.4 Rest of Middle East and Africa
Chapter 9 Company Profiles
- 9.1 Archer Daniels Midland Company (ADM)
- 9.2 Cargill Incorporated
- 9.3 Kerry Group
- 9.4 Ingredion Incorporated
- 9.5 Tate & Lyle PLC
- 9.6 Ashland Global Holdings Inc
- 9.7 PGP International, Inc (A Bunge Limited Company)
- 9.8 Dohler Group
- 9.9 Bowman Ingredients
- 9.10 SensoryEffects (A division of Balchem Corporation)
- 9.11 Bunge Limited
- 9.12 Continental Mills, Inc
- 9.13 Givaudan SA
- 9.14 Kerry Taste & Nutrition


