


 |
市场调查报告书
商品编码
1913351
燃气涡轮机市场机会、成长要素、产业趋势分析及预测(2026-2035年)Gas Turbine Market Opportunity, Growth Drivers, Industry Trend Analysis, and Forecast 2026 - 2035 |
||||||
全球燃气涡轮机市场预计到 2025 年将达到 226 亿美元,到 2035 年将达到 648 亿美元,年复合成长率为 11.2%。
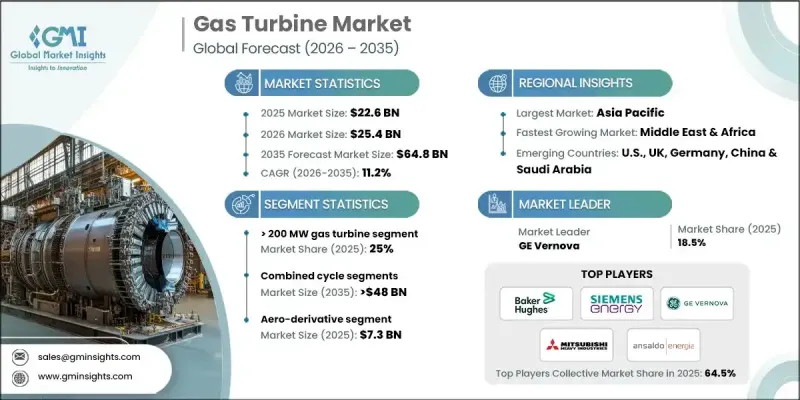
推动市场成长的因素包括:电厂现代化进程加快、对清洁能源系统的需求不断增长,以及全球转型为灵活且高效的发电技术。燃气涡轮机因其能够与间歇性可再生能源互补,且具有启动迅速、排放低等特点,在已开发经济体和新兴经济体中都日益受到重视。涡轮材料、冷却技术和数位化预测性维护的进步,进一步推动了新一代燃气涡轮机的推出,这些新涡轮机经过优化,具有更长的运行时间和更高的热效率。
| 市场覆盖范围 | |
|---|---|
| 开始年份 | 2025 |
| 预测年份 | 2026-2035 |
| 起始值 | 226亿美元 |
| 预测金额 | 648亿美元 |
| 复合年增长率 | 11.2% |
公用事业公司面临越来越大的降低碳排放强度的压力,这推动了对混合动力和氢能燃气涡轮机的投资,从而显着降低了全生命週期排放并提高了电网稳定性。这些创新技术正在帮助公用事业公司和工业营运商逐步淘汰传统的燃煤发电装置。现有燃气涡轮机设备的升级和改造也极大地促进了市场成长,这主要源于营运商对更长设备寿命、更高燃料柔软性和更高联合循环效率的需求。随着全球製造业、资料中心和重工业的电力需求激增,燃气涡轮机仍然是可靠基本负载和尖峰负载发电的基础技术。
预计到2025年,50kW燃气涡轮机市场规模将达到14亿美元,主要驱动力是分散式和社区发电解决方案需求的成长。这些紧凑型燃气涡轮机正越来越多地应用于工业设施、偏远地区、离网地区和微电网等特殊能源环境中,在这些环境中,持续可靠性、高效率和运行柔软性至关重要。它们能够在最小的面积内提供稳定的电力输出,使其成为需要不间断能源供应地区的理想选择。此外,它们的低排放、燃料多样性以及与再生能源来源整合的潜力也备受重视,这与全球朝向更清洁、更具韧性的能源基础设施发展趋势相符。
预计到2035年,联合循环发电市场规模将达到480亿美元,主要得益于其更高的效率。与传统的单一循环系统相比,复合循环发电系统在相同燃料投入下能够产生更多电力。由于其低排放、运行柔软性以及能够同时满足基本负载和尖峰电力需求,联合循环发电厂越来越受到大规模公共产业计划的青睐。世界各国政府和公共产业都在优先发展高效天然气技术,以满足排放的电力需求并实现减排目标,这进一步推动了对联合循环燃气涡轮机的需求。
预计到2025年,亚太地区燃气涡轮机市场将占全球年总收入的35%,并显着超越其他所有地区。该地区的领先地位归功于快速的工业化、大规模的城市化进程以及对燃气发电基础设施的巨额投资。由于天然气燃烧更清洁、运作成本更低,中国、印度、印尼和东南亚各国政府正加速从石油和煤炭发电转型为天然气发电。
目录
第一章调查方法和范围
第二章执行摘要
第三章业界考察
- 生态系分析
- 原物料供应及采购分析
- 製造能力评估
- 供应链韧性与风险因素
- 配电网路分析
- 监管环境
- 产业影响因素
- 司机
- 产业潜在风险与挑战
- 成长潜力分析
- 波特五力分析
- PESTEL 分析
- 燃气涡轮机成本结构分析
- 价格趋势分析(美元/兆瓦)
- 按地区
- 按产能
- 市场动态与新兴趋势
- 智慧技术和工业4.0的采用
- 绿色倡议和ESG策略
- 天然气运输基础设施的定性分析
- 天然气发电的发展趋势
- 电力业替代能源概览
- 对天然气在煤改气转型中的作用进行详细分析
- 全球天然气使用概述
第四章 竞争情势
- 介绍
- 按地区分類的公司市占率分析
- 北美洲
- 欧洲
- 亚太地区
- 中东和非洲
- 拉丁美洲
- 战略仪錶板
- 策略倡议
- 重要伙伴关係与合作
- 重大併购活动
- 产品创新与新产品发布
- 市场扩大策略
- 竞争标竿分析
- 创新与永续性格局
第五章 依产能分類的市场规模及预测(2022-2035年)
- 50千瓦或以下
- 50千瓦至500千瓦
- 500千瓦至1兆瓦以上
- 1兆瓦以上~30兆瓦
- 30兆瓦~70兆瓦
- 70兆瓦~200兆瓦
- 超过200兆瓦
第六章 2022-2035年依产品分類的市场规模及预测
- 飞机衍生
- 大型商用车辆
第七章 依技术分類的市场规模及预测(2022-2035年)
- 开环
- 复合循环
第八章 依应用领域分類的市场规模及预测(2022-2035年)
- 发电厂
- 石油和天然气
- 加工厂
- 航空领域
- 船
- 其他的
第九章 2022-2035年各地区市场规模及预测
- 北美洲
- 美国
- 加拿大
- 墨西哥
- 欧洲
- 英国
- 法国
- 德国
- 俄罗斯
- 义大利
- 荷兰
- 芬兰
- 希腊
- 丹麦
- 罗马尼亚
- 波兰
- 瑞典
- 亚太地区
- 中国
- 澳洲
- 日本
- 印度
- 韩国
- 印尼
- 泰国
- 马来西亚
- 孟加拉
- 中东和非洲
- 沙乌地阿拉伯
- 阿拉伯聯合大公国
- 卡达
- 科威特
- 阿曼
- 埃及
- 土耳其
- 巴林
- 伊拉克
- 约旦
- 黎巴嫩
- 南非
- 奈及利亚
- 阿尔及利亚
- 肯亚
- 迦纳
- 拉丁美洲
- 巴西
- 阿根廷
- 秘鲁
- 智利
第十章:公司简介
- Ansaldo Energia
- Baker Hughes
- Bharat Heavy Electricals Limited
- Capstone Green Energy
- Destinus Energy
- Doosan Enerbility
- FlexEnergy Solutions
- GE Vernova
- Harbin Electric Corporation
- IHI Corporation
- Kawasaki Heavy Industries
- MAN Energy Solutions
- Mitsubishi Heavy Industries
- Nanjing Steam Turbine Motor(Group)
- Rolls-Royce
- Shanghai Electric
- Siemens Energy
- Solar Turbines
- Vericor
- Wartsila
The Global Gas Turbine Market was valued at USD 22.6 billion in 2025 and is estimated to grow at a CAGR of 11.2% to reach USD 64.8 billion by 2035.
The market growth is driven by accelerated power plant modernization, rising demand for cleaner energy systems, and the global shift toward flexible, high-efficiency generation technologies. Gas turbines continue to gain prominence across both developed and emerging economies due to their capability to balance intermittent renewable energy and deliver fast-start, low-emission performance. Advancements in turbine materials, cooling technologies, and digital predictive maintenance have further strengthened the adoption of next-generation units optimized for long-duration operation and superior thermal efficiency.
| Market Scope | |
|---|---|
| Start Year | 2025 |
| Forecast Year | 2026-2035 |
| Start Value | $22.6 Billion |
| Forecast Value | $64.8 Billion |
| CAGR | 11.2% |
The increasing pressure on utilities to reduce carbon intensity has boosted investment in hybrid and hydrogen-ready gas turbines, enabling significant reductions in lifecycle emissions while enhancing grid stability. These innovations support utilities and industrial operators in transitioning from conventional coal-fired units. Upgrades and retrofits for existing turbine fleets also contribute substantially to market growth, as operators seek to extend equipment life, improve fuel flexibility, and enhance combined-cycle efficiency. With global electricity demand surging across manufacturing, data centers, and heavy industries, gas turbines continue to serve as a cornerstone technology for reliable baseload and peak-load power generation.
The 50 kW gas turbine market was valued at USD 1.4 billion in 2025, driven primarily by the growing demand for decentralized and localized power generation solutions. These compact turbines are increasingly utilized in industrial facilities, remote or off-grid locations, and specialized energy setups such as microgrids, where continuous reliability, high efficiency, and operational flexibility are paramount. Their ability to deliver consistent power output with minimal footprint makes them ideal for sectors requiring uninterrupted energy supply. Additionally, these turbines are favored for their low emissions, fuel versatility, and potential integration with renewable energy sources, which aligns with global trends toward cleaner and more resilient energy infrastructure.
The combined cycle segment is expected to reach USD 48 billion by 2035, driven by its superior efficiency and ability to generate more electricity using the same fuel input compared to conventional simple-cycle systems. Combined cycle power plants are increasingly preferred for large-scale utility projects due to their lower emissions profile, operational flexibility, and ability to support baseload as well as peak power requirements. Governments and utilities worldwide are prioritizing high-efficiency natural gas technologies to meet rising electricity demand while aligning with emission reduction goals, strengthening the demand for combined cycle gas turbines.
Asia Pacific Gas Turbine Market held 35% share in 2025 significantly outpacing all other regions in annual revenue. The region's dominance is attributed to rapid industrialization, extensive urban growth, and massive investments in gas-fired power generation infrastructure. Governments in China, India, Indonesia, and Southeast Asia are accelerating the shift from oil- and coal-based power generation to natural gas, driven by cleaner combustion characteristics and lower operating costs.
Major companies shaping the Global Gas Turbine Market include General Electric, Siemens Energy, Mitsubishi Power, Ansaldo Energia, Rolls-Royce, Solar Turbines, Doosan Enerbility, Harbin Electric, BHEL, and OPRA Turbines. These players focus on high-efficiency turbine development, hydrogen integration, service modernization, and OEM-utility partnerships to strengthen their market presence. Leading companies in the Gas Turbine Market are adopting several strategic initiatives to reinforce their global presence. A major focus is on developing hydrogen-capable and low-NOx turbines, enabling operators to transition toward cleaner fuels while future-proofing long-term asset investments. Firms are also expanding aftermarket service portfolios, offering digital monitoring, predictive maintenance, and full lifecycle management to secure recurring revenue streams. Collaborative R&D partnerships with utilities, governments, and material science companies accelerate innovation in high-temperature alloys and cooling technologies.
Table of Contents
Chapter 1 Methodology & Scope
- 1.1 Research design
- 1.1.1 Research approach
- 1.1.2 Data collection methods
- 1.2 Base estimates and calculations
- 1.2.1 Base year calculation
- 1.2.2 Market estimates & forecast parameters
- 1.3 Forecast
- 1.3.1 Key trends for market estimates
- 1.3.2 Quantified market impact analysis
- 1.3.2.1 Mathematical impact of growth parameters on forecast
- 1.3.3 Scenario analysis framework
- 1.4 Primary research and validation
- 1.4.1 Some of the primary sources (but not limited to)
- 1.5 Data mining sources
- 1.5.1 Paid Sources
- 1.5.2 Sources, by region
- 1.6 Research trail & scoring components
- 1.6.1 Research trail components
- 1.6.2 Scoring components
- 1.7 Research transparency addendum
- 1.7.1 Source attribution framework
- 1.7.2 Quality assurance metrics
- 1.7.3 Our commitment to trust
- 1.8 Market definitions
Chapter 2 Executive Summary
- 2.1 Industry synopsis, 2022 - 2035
- 2.1.1 Business trends
- 2.1.2 Capacity trends
- 2.1.3 Product trends
- 2.1.4 Technology trends
- 2.1.5 Application trends
- 2.1.6 Regional trends
Chapter 3 Industry Insights
- 3.1 Industry ecosystem analysis
- 3.1.1 Raw material availability & sourcing analysis
- 3.1.2 Manufacturing capacity assessment
- 3.1.3 Supply chain resilience & risk factors
- 3.1.4 Distribution network analysis
- 3.2 Regulatory landscape
- 3.3 Industry impact forces
- 3.3.1 Growth drivers
- 3.3.2 Industry pitfalls & challenges
- 3.4 Growth potential analysis
- 3.5 Porter's analysis
- 3.5.1 Bargaining power of suppliers
- 3.5.2 Bargaining power of buyers
- 3.5.3 Threat of new entrants
- 3.5.4 Threat of substitutes
- 3.6 PESTEL analysis
- 3.6.1 Political factors
- 3.6.2 Economic factors
- 3.6.3 Social factors
- 3.6.4 Technological factors
- 3.6.5 Legal factors
- 3.6.6 Environmental factors
- 3.7 Cost structure analysis of gas turbines
- 3.8 Price trend analysis (USD/MW)
- 3.8.1 By region
- 3.8.2 By capacity
- 3.9 Market dynamics & emerging trends
- 3.10 Smart technologies & industry 4.0 adoption
- 3.11 Green initiatives & ESG strategies
- 3.12 Qualitative analysis on gas transportation infrastructure
- 3.13 Electricity generation trends from natural gas
- 3.14 Industry overview on alternative energy sources in power generation
- 3.15 Detailed analysis on role of natural gas in coal-to-gas transition
- 3.16 Global gas utilization overview
Chapter 4 Competitive Landscape, 2025
- 4.1 Introduction
- 4.2 Company market share analysis, by region, 2025
- 4.2.1 North America
- 4.2.2 Europe
- 4.2.3 Asia Pacific
- 4.2.4 Middle East & Africa
- 4.2.5 Latin America
- 4.3 Strategic dashboard
- 4.4 Strategic initiatives
- 4.4.1 Key partnerships & collaborations
- 4.4.2 Major M&A activities
- 4.4.3 Product innovations & launches
- 4.4.4 Market expansion strategies
- 4.5 Competitive benchmarking
- 4.6 Innovation & sustainability landscape
Chapter 5 Market Size and Forecast, By Capacity, 2022 - 2035 (USD Million & MW)
- 5.1 Key trends
- 5.2 ≤ 50 kW
- 5.3 > 50 kW to 500 kW
- 5.4 > 500 kW to 1 MW
- 5.5 > 1 MW to 30 MW
- 5.6 > 30 MW to 70 MW
- 5.7 > 70 MW to 200 MW
- 5.8 > 200 MW
Chapter 6 Market Size and Forecast, By Product, 2022 - 2035 (USD Million & MW)
- 6.1 Key trends
- 6.2 Aero-derivative
- 6.3 Heavy duty
Chapter 7 Market Size and Forecast, By Technology, 2022 - 2035 (USD Million & MW)
- 7.1 Key trends
- 7.2 Open cycle
- 7.3 Combined cycle
Chapter 8 Market Size and Forecast, By Application, 2022 - 2035 (USD Million & MW)
- 8.1 Key trends
- 8.2 Power plants
- 8.3 Oil & gas
- 8.4 Process plants
- 8.5 Aviation
- 8.6 Marine
- 8.7 Others
Chapter 9 Market Size and Forecast, By Region, 2022 - 2035 (USD Million & MW)
- 9.1 Key trends
- 9.2 North America
- 9.2.1 U.S.
- 9.2.2 Canada
- 9.2.3 Mexico
- 9.3 Europe
- 9.3.1 UK
- 9.3.2 France
- 9.3.3 Germany
- 9.3.4 Russia
- 9.3.5 Italy
- 9.3.6 Netherlands
- 9.3.7 Finland
- 9.3.8 Greece
- 9.3.9 Denmark
- 9.3.10 Romania
- 9.3.11 Poland
- 9.3.12 Sweden
- 9.4 Asia Pacific
- 9.4.1 China
- 9.4.2 Australia
- 9.4.3 Japan
- 9.4.4 India
- 9.4.5 South Korea
- 9.4.6 Indonesia
- 9.4.7 Thailand
- 9.4.8 Malaysia
- 9.4.9 Bangladesh
- 9.5 Middle East & Africa
- 9.5.1 Saudi Arabia
- 9.5.2 UAE
- 9.5.3 Qatar
- 9.5.4 Kuwait
- 9.5.5 Oman
- 9.5.6 Egypt
- 9.5.7 Turkey
- 9.5.8 Bahrain
- 9.5.9 Iraq
- 9.5.10 Jordan
- 9.5.11 Lebanon
- 9.5.12 South Africa
- 9.5.13 Nigeria
- 9.5.14 Algeria
- 9.5.15 Kenya
- 9.5.16 Ghana
- 9.6 Latin America
- 9.6.1 Brazil
- 9.6.2 Argentina
- 9.6.3 Peru
- 9.6.4 Chile
Chapter 10 Company Profiles
- 10.1 Ansaldo Energia
- 10.2 Baker Hughes
- 10.3 Bharat Heavy Electricals Limited
- 10.4 Capstone Green Energy
- 10.5 Destinus Energy
- 10.6 Doosan Enerbility
- 10.7 FlexEnergy Solutions
- 10.8 GE Vernova
- 10.9 Harbin Electric Corporation
- 10.10 IHI Corporation
- 10.11 Kawasaki Heavy Industries
- 10.12 MAN Energy Solutions
- 10.13 Mitsubishi Heavy Industries
- 10.14 Nanjing Steam Turbine Motor (Group)
- 10.15 Rolls-Royce
- 10.16 Shanghai Electric
- 10.17 Siemens Energy
- 10.18 Solar Turbines
- 10.19 Vericor
- 10.20 Wartsila
 复合循环 (CC)的全球市场 (以季度为基础)
 燃气涡轮机
燃气涡轮机 泛氢燃气涡轮机市场:按配置、容量、部署、燃料混合比、应用和最终用户分類的全球预测,2026-2032年微型燃气涡轮机发电机市场:按燃料类型、功率输出、销售管道、应用和最终用户分類的全球预测(2026-2032年)陆基燃气涡轮机市场:按类型、功率、应用、技术、燃料类型和安装方式划分,全球预测,2026-2032年
 2026-2034年全球燃气涡轮机市场规模、份额、趋势和成长分析报告
 2026年全球燃气涡轮机服务市场报告
 燃气涡轮机服务市场 - 全球产业规模、份额、趋势、机会及预测(按涡轮机类型、涡轮机容量、服务类型、销售管道、最终用途、地区和竞争格局划分,2021-2031年)全球燃气涡轮机市场:市场规模、占有率、成长率、产业分析、类型、应用和区域分析,未来预测(2026-2034)
 涡流涡轮机市场规模、份额和成长分析(按应用、类型、材质、最终用途和地区划分)—2026-2033年产业预测