


 |
市场调查报告书
商品编码
1913412
汽车虚拟机器管理程序市场机会、成长要素、产业趋势分析及预测(2026-2035年)Automotive Hypervisor Market Opportunity, Growth Drivers, Industry Trend Analysis, and Forecast 2026 - 2035 |
||||||
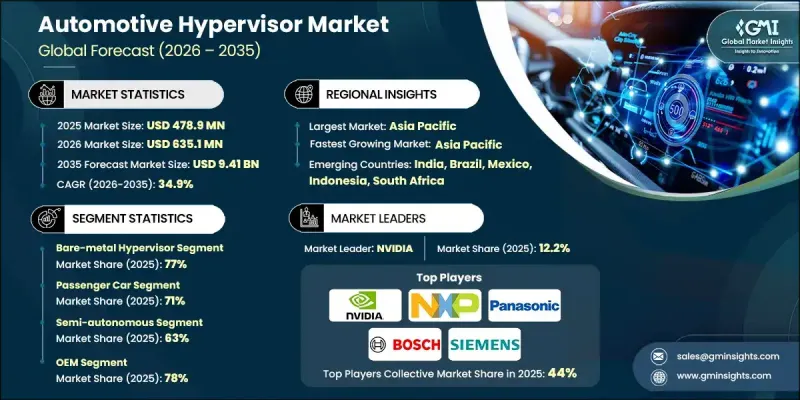
全球汽车虚拟机器管理程式市场预计到 2025 年将达到 4.789 亿美元,到 2035 年将达到 94.1 亿美元,年复合成长率为 34.9%。
汽车产业从以硬体为中心的车辆架构向基于集中式运算平台的软体定义车辆进行结构性转型,推动了市场成长。汽车製造商越来越依赖汽车虚拟机器管理程序,以在共用运算环境中支援多种作业系统和应用程式。这种转变能够加快软体引进週期,提高可扩展性,并增强跨多个汽车平臺部署功能的柔软性。向集中式运算的转变也有助于简化系统设计、降低复杂度并提高软体生命週期管理的效率。随着车辆变得更加互联、智慧和软体主导,虚拟机器管理程式正成为安全工作负载管理、效能最佳化和麵向未来的车辆架构的基础技术。对数位汽车平臺和下一代移动出行解决方案的持续投资进一步加速了这一趋势,使汽车虚拟机管理程序成为现代汽车创新的关键推动因素。
| 市场覆盖范围 | |
|---|---|
| 开始年份 | 2025 |
| 预测年份 | 2026-2035 |
| 起始值 | 4.789亿美元 |
| 预测金额 | 94.1亿美元 |
| 复合年增长率 | 34.9% |
随着高级驾驶辅助系统 (ADAS) 的日益复杂和自动驾驶技术的不断进步,严格分离安全关键型应用和非安全关键型应用的需求也日益增长。汽车虚拟机器管理程式平台据称能够实现工作负载的安全分离,确保系统行为的可预测性,同时满足功能安全要求。製造商正在将多个电控系统整合到数量更少的网域控制器和中央控制器中,以简化车辆架构、降低布线复杂性、减少能耗并提高整体系统效率。
预计到 2025 年,裸金属虚拟机管理程序市占率将达到 77%,从 2026 年到 2035 年的复合年增长率将达到 34.3%。该细分市场之所以获得发展动力,是因为它能够直接与车辆硬体连接,最大限度地减少响应延迟,并支援对安全至关重要的汽车应用而言必不可少的即时系统性能。
预计到 2025 年,乘用车细分市场将占市场份额的 71%,到 2035 年将以 35.5% 的复合年增长率成长。对互联服务和虚拟化资讯娱乐环境的需求不断增长,正在推动基于虚拟机器管理程式的平台的普及,这些平台可以在统一的车载运算系统中运行多个应用程式。
预计到 2025 年,美国汽车虚拟机器管理程式市场规模将达到 1.098 亿美元。该国的成长得益于汽车製造商和技术提供商的大力投资,他们专注于开发联网汽车、自动驾驶和软体定义汽车。
目录
第一章调查方法
第二章执行摘要
第三章业界考察
- 生态系分析
- 供应商情况
- 利润率
- 成本结构
- 每个阶段的附加价值
- 影响价值链的因素
- 中断
- 产业影响因素
- 司机
- 向软体定义车辆(SDV)的过渡
- ADAS和自动驾驶功能的日益融合
- ECU整合与成本优化
- 日益关注功能安全和网路安全
- 产业潜在风险与挑战
- 高整合度和检验复杂性
- 售后市场接受度有限
- 市场机会
- 扩展集中式和区域式车辆架构
- 电动车和自动驾驶汽车的发展
- OTA和互联服务集成
- 商用车和车队车辆的新需求
- 司机
- 成长潜力分析
- 监管环境
- 北美洲
- 美国运输部(DOT) 标准
- 职业安全与健康管理局 (OSHA) 指南
- 美国环保署(EPA)
- 欧洲
- EN ISO 容器标准
- 欧盟海关和安全法规
- BS EN/CEN 标准
- 国家标准(UNE、DIN等)
- 亚太地区
- 中国国家标准(GB)
- 日本JIS标准要求
- 韩国KS认证
- 印度BIS标准
- 泰国工业标准协会(TISI)
- 拉丁美洲
- INMETRO(国家计量研究院)
- INTI认证(国家技术研究院)
- NOM 标准(墨西哥官方标准)
- 中东和非洲
- ESMA/阿联酋合格评定计划 (ECAS)
- 海湾合作委员会技术法规
- SABS认证
- 北美洲
- 波特五力分析
- PESTEL 分析
- 技术与创新展望
- 当前技术趋势
- 新兴技术
- 定价分析
- 产品定价
- 区域定价
- 成本細項分析
- 专利分析
- 永续性和环境方面
- 永续实践
- 减少废弃物策略
- 生产中的能源效率
- 环保倡议
- 碳足迹考量
- 用例
- 虚拟机器管理程式架构与部署模型
- 类型 1、类型 2 和混合临界性架构
- 集中式和分区式ECU布局
- 多领域整合策略(ADAS + IVI + 车身)
- 效能、延迟和确定性之间的权衡
- SoC相容性和硬体协同设计
- 开放原始码与专有虚拟机器管理程式策略
- 功能安全和混合临界性管理
第四章 竞争情势
- 介绍
- 公司市占率分析
- 北美洲
- 欧洲
- 亚太地区
- 拉丁美洲
- 中东和非洲
- 主要市场公司的竞争分析
- 竞争定位矩阵
- 战略展望矩阵
- 重大进展
- 併购
- 伙伴关係与合作
- 新产品发布
- 企业扩张计画和资金筹措
第五章 依虚拟机器管理程式分類的市场估算与预测,2022-2035年
- 裸机管理程序
- 託管虚拟机器管理程序
6. 依自主程度分類的市场估计与预测,2022-2035 年
- 半自主
- 完全自主
第七章 依车辆类型分類的市场估计与预测,2022-2035年
- 搭乘用车
- 掀背车
- 轿车
- SUV
- 商用车辆
- 轻型商用车
- 中型商用车(MCV)
- 重型商用车(HCV)
第八章 按应用领域分類的市场估算与预测,2022-2035年
- ADAS(进阶驾驶辅助系统)
- 资讯娱乐和车载资讯系统
- 动力传动系统和底盘控制系统
- 车联网(V2X)
- 自动驾驶系统
第九章 依销售管道分類的市场估计与预测,2022-2035年
- OEM
- 售后市场
第十章 2022-2035年各地区市场估计与预测
- 北美洲
- 美国
- 加拿大
- 欧洲
- 德国
- 英国
- 法国
- 义大利
- 西班牙
- 北欧国家
- 俄罗斯
- 波兰
- 罗马尼亚
- 亚太地区
- 中国
- 印度
- 日本
- 韩国
- ANZ
- 越南
- 印尼
- 拉丁美洲
- 巴西
- 墨西哥
- 阿根廷
- 中东和非洲
- 南非
- 沙乌地阿拉伯
- 阿拉伯聯合大公国
第十一章 公司简介
- 世界公司
- BlackBerry QNX
- Continental
- Green Hills Software
- NVIDIA
- NXP Semiconductors
- Panasonic
- Renesas Electronics
- Robert Bosch
- Siemens(Mentor Graphics)
- Wind River Systems
- 区域玩家
- Aptiv
- Infineon Technologies
- OpenSynergy
- Sasken Technologies
- STMicroelectronics
- Synopsys
- SYSGO
- Texas Instruments
- Vector Informatik
- VMware
- 新兴企业
- Apex.AI
- Lynx Software Technologies
- OpenSynergy Ecosystem Partners
- SafeRide Technologies
- Virtual Open Systems
The Global Automotive Hypervisor Market was valued at USD 478.9 million in 2025 and is estimated to grow at a CAGR of 34.9% to reach USD 9.41 billion by 2035.
Market expansion is driven by the automotive industry's structural transition from hardware-focused vehicle architectures to software-defined vehicles built around centralized computing platforms. Vehicle manufacturers are increasingly relying on automotive hypervisors to support multiple operating systems and applications on a shared computing environment. This shift is enabling faster software deployment cycles, improved scalability, and greater flexibility in introducing features across multiple vehicle platforms. The move toward centralized computing is also supporting simplified system design, reduced complexity, and more efficient software lifecycle management. As vehicles become more connected, intelligent, and software-driven, hypervisors are emerging as a foundational technology that supports secure workload management, performance optimization, and future-ready vehicle architectures. Growing investment in digital vehicle platforms and next-generation mobility solutions is further accelerating adoption, positioning automotive hypervisors as a critical enabler of modern automotive innovation.
| Market Scope | |
|---|---|
| Start Year | 2025 |
| Forecast Year | 2026-2035 |
| Start Value | $478.9 Million |
| Forecast Value | $9.41 Billion |
| CAGR | 34.9% |
The increasing complexity of advanced driver assistance systems and the progression toward autonomous mobility have heightened the need for strict separation between safety-critical and non-critical applications. Automotive hypervisor platforms are described as enabling secure isolation of workloads, ensuring predictable system behavior while meeting functional safety requirements. Manufacturers are consolidating multiple electronic control units into fewer domain and central controllers to streamline vehicle architecture, reduce wiring complexity, lower energy consumption, and improve overall system efficiency.
The bare-metal hypervisor segment held 77% share in 2025 and is expected to grow at a CAGR of 34.3% from 2026 to 2035. This segment is gaining traction due to its ability to interact directly with vehicle hardware, minimizing response latency and supporting real-time system performance, which is essential for safety-focused automotive applications.
The passenger car segment accounted for 71% share in 2025 and is forecast to grow at a CAGR of 35.5% through 2035. Rising demand for connected services and virtualized infotainment environments is driving adoption of hypervisor-based platforms that allow multiple applications to operate within a unified vehicle computing system.
U.S. Automotive Hypervisor Market reached USD 109.8 million in 2025. Growth in the country is supported by strong investment from automakers and technology providers focused on connected, autonomous, and software-defined vehicle development.
Key companies active in the Global Automotive Hypervisor Market include NVIDIA, BlackBerry, Wind River Systems, NXP Semiconductors, Green Hills Software, Robert Bosch, Continental, Renesas Electronics, Siemens, and Panasonic. Companies operating in the Global Automotive Hypervisor Market are strengthening their competitive position through continuous innovation, ecosystem partnerships, and alignment with software-defined vehicle strategies. Many players are investing heavily in safety-certified hypervisor platforms that support mixed-critical workloads and centralized vehicle architectures. Strategic collaborations with automakers, semiconductor vendors, and software developers are accelerating integration into next-generation vehicle platforms. Firms are also focusing on scalability, cybersecurity, and compliance with functional safety standards to meet evolving regulatory and industry requirements.
Table of Contents
Chapter 1 Methodology
- 1.1 Research approach
- 1.2 Quality commitments
- 1.3 GMI AI policy & data integrity commitment
- 1.4 Research trail & confidence scoring
- 1.4.1 Research trail components
- 1.4.2 Scoring components
- 1.5 Data collection
- 1.5.1 Partial list of primary sources
- 1.6 Data mining sources
- 1.6.1 Paid sources
- 1.7 Base estimates and calculations
- 1.7.1 Base year calculation
- 1.8 Forecast model
- 1.9 Research transparency addendum
Chapter 2 Executive Summary
- 2.1 Industry 360° synopsis
- 2.2 Key market trends
- 2.2.1 Regional
- 2.2.2 Hypervisor
- 2.2.3 Vehicle
- 2.2.4 Level of autonomy
- 2.2.5 Sales channel
- 2.2.6 Application
- 2.3 TAM analysis, 2026-2035
- 2.4 CXO perspectives: Strategic imperatives
- 2.4.1 Executive decision points
- 2.4.2 Critical success factors
- 2.5 Future outlook
- 2.6 Strategic recommendations
Chapter 3 Industry Insights
- 3.1 Industry ecosystem analysis
- 3.1.1 Supplier landscape
- 3.1.2 Profit margin
- 3.1.3 Cost structure
- 3.1.4 Value addition at each stage
- 3.1.5 Factor affecting the value chain
- 3.1.6 Disruptions
- 3.2 Industry impact forces
- 3.2.1 Growth drivers
- 3.2.1.1 Shift toward software-defined vehicles (SDVs)
- 3.2.1.2 Rising ADAS and autonomous feature integration
- 3.2.1.3 ECU consolidation and cost optimization
- 3.2.1.4 Growing focus on functional safety and cybersecurity
- 3.2.2 Industry pitfalls and challenges
- 3.2.2.1 High integration and validation complexity
- 3.2.2.2 Limited aftermarket adoption
- 3.2.3 Market opportunities
- 3.2.3.1 Expansion of centralized and zonal vehicle architectures
- 3.2.3.2 Growth of electric and autonomous vehicles
- 3.2.3.3 Integration of OTA and connected services
- 3.2.3.4 Emerging demand from commercial and fleet vehicles
- 3.2.1 Growth drivers
- 3.3 Growth potential analysis
- 3.4 Regulatory landscape
- 3.4.1 North America
- 3.4.1.1 U.S. Department of Transportation (DOT) Standards
- 3.4.1.2 Occupational Safety and Health Administration (OSHA) Guidelines
- 3.4.1.3 U.S. Environmental Protection Agency (EPA)
- 3.4.2 Europe
- 3.4.2.1 EN ISO Container Standards
- 3.4.2.2 European Union Customs and Safety Regulations
- 3.4.2.3 BS EN / CEN Standards
- 3.4.2.4 National Standards (UNE, DIN, etc.)
- 3.4.3 Asia Pacific
- 3.4.3.1 China GB (Guobiao) Standards
- 3.4.3.2 Japan JIS Requirements
- 3.4.3.3 Korea KS Certification
- 3.4.3.4 Indian BIS Standards
- 3.4.3.5 Thai Industrial Standards Institute (TISI)
- 3.4.4 Latin America
- 3.4.4.1 INMETRO (National Institute of Metrology)
- 3.4.4.2 INTI certification (Instituto Nacional de Tecnologia Industrial)
- 3.4.4.3 NOM standards (Norma Official Mexicana)
- 3.4.5 Middle East & Africa
- 3.4.5.1 ESMA / Emirates Conformity Assessment Scheme (ECAS)
- 3.4.5.2 GCC technical regulations
- 3.4.5.3 SABS certification
- 3.4.1 North America
- 3.5 Porter's analysis
- 3.6 PESTEL analysis
- 3.7 Technology and innovation landscape
- 3.7.1 Current technological trends
- 3.7.2 Emerging technologies
- 3.8 Pricing analysis
- 3.8.1.1 Pricing by product
- 3.8.1.2 Pricing by region
- 3.9 Cost breakdown analysis
- 3.10 Patent analysis
- 3.11 Sustainability and environmental aspects
- 3.11.1 Sustainable practices
- 3.11.2 Waste reduction strategies
- 3.11.3 Energy efficiency in production
- 3.11.4 Eco-friendly initiatives
- 3.11.5 Carbon footprint considerations
- 3.12 Use cases
- 3.13 Hypervisor architecture & deployment models
- 3.13.1 Type-1 vs Type-2 vs mixed-criticality architecture
- 3.13.2 Centralized vs zonal ECU deployment
- 3.13.3 Multi-domain consolidation strategies (ADAS + IVI + body)
- 3.13.4 Performance, latency & determinism trade-offs
- 3.14 SoC compatibility and hardware co-design
- 3.15 Open-source vs proprietary hypervisor strategies
- 3.16 Functional safety and mixed-criticality management
Chapter 4 Competitive Landscape, 2025
- 4.1 Introduction
- 4.2 Company market share analysis
- 4.2.1 North America
- 4.2.2 Europe
- 4.2.3 Asia Pacific
- 4.2.4 LATAM
- 4.2.5 MEA
- 4.3 Competitive analysis of major market players
- 4.4 Competitive positioning matrix
- 4.5 Strategic outlook matrix
- 4.6 Key developments
- 4.6.1 Mergers & acquisitions
- 4.6.2 Partnerships & collaborations
- 4.6.3 New product launches
- 4.6.4 Expansion plans and funding
Chapter 5 Market Estimates & Forecast, By Hypervisor, 2022 - 2035 ($Mn)
- 5.1 Key trends
- 5.2 Bare-metal hypervisor
- 5.3 Hosted hypervisor
Chapter 6 Market Estimates & Forecast, By Level of Autonomy, 2022 - 2035 ($Mn)
- 6.1 Key trends
- 6.2 Semi-autonomous
- 6.3 Fully autonomous
Chapter 7 Market Estimates & Forecast, By Vehicle, 2022 - 2035 ($Mn)
- 7.1 Key trends
- 7.2 Passenger cars
- 7.2.1 Hatchback
- 7.2.2 Sedan
- 7.2.3 SUV
- 7.3 Commercial vehicle
- 7.3.1 LCV (Light commercial vehicle)
- 7.3.2 MCV (Medium commercial vehicle)
- 7.3.3 HCV (Heavy commercial vehicle)
Chapter 8 Market Estimates & Forecast, By Application, 2022 - 2035 ($Mn)
- 8.1 Key trends
- 8.2 ADAS (Advanced Driver Assistance Systems)
- 8.3 Infotainment & telematics
- 8.4 Powertrain & chassis control systems
- 8.5 Vehicle-to-everything (V2X) communication
- 8.6 Autonomous Driving Systems
Chapter 9 Market Estimates & Forecast, By Sales Channel, 2022 - 2035 ($Mn)
- 9.1 Key trends
- 9.2 OEM
- 9.3 Aftermarket
Chapter 10 Market Estimates & Forecast, By Region, 2022 - 2035 ($Mn)
- 10.1 Key trends
- 10.2 North America
- 10.2.1 US
- 10.2.2 Canada
- 10.3 Europe
- 10.3.1 Germany
- 10.3.2 UK
- 10.3.3 France
- 10.3.4 Italy
- 10.3.5 Spain
- 10.3.6 Nordics
- 10.3.7 Russia
- 10.3.8 Poland
- 10.3.9 Romania
- 10.4 Asia Pacific
- 10.4.1 China
- 10.4.2 India
- 10.4.3 Japan
- 10.4.4 South Korea
- 10.4.5 ANZ
- 10.4.6 Vietnam
- 10.4.7 Indonesia
- 10.5 Latin America
- 10.5.1 Brazil
- 10.5.2 Mexico
- 10.5.3 Argentina
- 10.6 MEA
- 10.6.1 South Africa
- 10.6.2 Saudi Arabia
- 10.6.3 UAE
Chapter 11 Company Profiles
- 11.1 Global companies
- 11.1.1 BlackBerry QNX
- 11.1.2 Continental
- 11.1.3 Green Hills Software
- 11.1.4 NVIDIA
- 11.1.5 NXP Semiconductors
- 11.1.6 Panasonic
- 11.1.7 Renesas Electronics
- 11.1.8 Robert Bosch
- 11.1.9 Siemens (Mentor Graphics)
- 11.1.10 Wind River Systems
- 11.2 Regional players
- 11.2.1 Aptiv
- 11.2.2 Infineon Technologies
- 11.2.3 OpenSynergy
- 11.2.4 Sasken Technologies
- 11.2.5 STMicroelectronics
- 11.2.6 Synopsys
- 11.2.7 SYSGO
- 11.2.8 Texas Instruments
- 11.2.9 Vector Informatik
- 11.2.10 VMware
- 11.3 Emerging players
- 11.3.1 Apex.AI
- 11.3.2 Lynx Software Technologies
- 11.3.3 OpenSynergy Ecosystem Partners
- 11.3.4 SafeRide Technologies
- 11.3.5 Virtual Open Systems
 汽车虚拟机器管理程式市场:按组件、应用、车辆类型、部署模式和最终用户划分-2026-2032年全球市场预测
 2026年全球汽车虚拟机器管理程式市场报告
 嵌入式虚拟机器管理程式市场分析与预测(至2035年):类型、产品类型、服务、技术、元件、应用、部署模式、最终用户、功能
 2026-2030年全球虚拟机器管理程式市场
 汽车虚拟机器管理程式市场规模、份额、成长及全球产业分析:按类型、应用和地区分類的洞察,2026-2034 年预测
 嵌入式虚拟机器管理程式市场,按组件、按类型、按技术、按最终用户、按国家和地区 - 2025 年至 2032 年全球行业分析、市场规模、市场份额和预测
 2025-2029年全球汽车虚拟机器管理程式市场
 汽车用管理程序的全球市场:车辆类别,各产品类型,自动化类别,各地区,机会,预测,2018年~2032年
 嵌入式虚拟机器管理程式市场 - 成长、未来展望、竞争分析,2025 年至 2033 年汽车管理程式市场,按类型、车辆类型、最终用户、国家和地区 - 2024-2032 年行业分析、市场最终用户、市场份额和预测