


 |
市场调查报告书
商品编码
1913442
硫酸软骨素市场机会、成长要素、产业趋势分析及预测(2026年至2035年)Chondroitin Sulphate Market Opportunity, Growth Drivers, Industry Trend Analysis, and Forecast 2026 - 2035 |
||||||
全球硫酸软骨素市场预计到 2025 年将达到 15 亿美元,到 2035 年将达到 24 亿美元,年复合成长率为 5.3%。
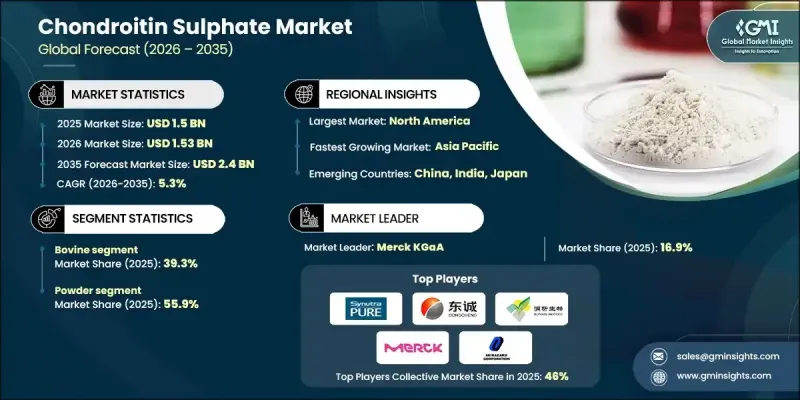
随着全球老化人口和健康意识增强的消费者对关节健康的关注度不断提高,市场正经历稳定成长。关节不适和活动障碍症状的日益增多,推动了含硫酸软骨素的膳食补充剂和功能性产品的消费成长。消费者对天然和来源可靠的成分的偏好不断变化,也推动了市场发展,增强了对高品质配方的需求。生产流程的进步提高了产品的纯度、均一性和规模化生产能力,同时也有助于实现永续性目标。宠物和牲畜健康领域的成长进一步扩大了应用范围,因为关节支持配方在宠物营养中变得越来越重要。数位化零售通路增强了市场进入,使品牌能够触及更广泛的消费群体,同时提供产品透明度和便利性。这些趋势共同增强了硫酸软骨素在人类营养、兽医应用和健康产品类型中的长期需求。
| 市场覆盖范围 | |
|---|---|
| 开始年份 | 2025 |
| 预测年份 | 2026-2035 |
| 起始值 | 15亿美元 |
| 预测金额 | 24亿美元 |
| 复合年增长率 | 5.3% |
2025年,牛硫酸软骨素市占率为39.3%。由于其在关节保健品中的卓越功效以及在保健品製造业的强势地位,该成分将继续被广泛使用。
到 2025 年,粉状硫酸软骨素市占率将达到 55.9%。这种形式的主导地位得益于其配方柔软性、易于添加到补充剂中以及与洁净标示和可自订营养趋势的兼容性。
预计到2025年,北美硫酸软骨素市占率将达到38.2%。该地区需求持续强劲,主要得益于消费者对关节健康的高度重视、膳食补充剂的广泛使用以及成熟的膳食补充剂行业。美国仍然是主要市场贡献者,这主要源于消费者对透明采购和高品质配方产品的强烈偏好。
目录
第一章调查方法和范围
第二章执行摘要
第三章业界考察
- 生态系分析
- 供应商情况
- 利润率
- 每个阶段的附加价值
- 影响价值链的因素
- 中断
- 产业影响因素
- 司机
- 产业潜在风险与挑战
- 市场机会
- 成长潜力分析
- 监管环境
- 北美洲
- 欧洲
- 亚太地区
- 拉丁美洲
- 中东和非洲
- 波特五力分析
- PESTEL 分析
- 价格趋势
- 未来市场趋势
- 科技与创新趋势
- 当前技术趋势
- 新兴技术
- 专利状态
- 贸易统计(HS编码)(註:仅提供主要国家的贸易统计)
- 主要进口国
- 主要出口国
第四章 竞争情势
- 介绍
- 公司市占率分析
- 按地区
- 北美洲
- 欧洲
- 亚太地区
- 拉丁美洲
- 中东和非洲
- 按地区
- 企业矩阵分析
- 主要市场公司的竞争分析
- 竞争定位矩阵
- 重大进展
- 併购
- 伙伴关係与合作
- 新产品发布
- 业务拓展计划
5. 2022-2035年按来源分類的市场估计与预测
- 牛
- 猪肉
- 鸟类
- 鸡肉
- 土耳其
- 其他的
- 鱼贝类
- 鲔鱼
- 鲑鱼
- 其他的
- 其他的
第六章 按类型分類的市场估算与预测,2022-2035年
- 粉末
- 胶囊/片剂
- 液体
第七章 按应用领域分類的市场估算与预测,2022-2035年
- 营养补充品
- 胶囊
- 药片
- 软糖
- 製药
- 骨关节炎治疗药物
- 关节健康产品
- 化妆品和个人护理
- 抗衰老霜
- 皮肤保湿产品
- 食品/饮料
- 其他的
第八章 按分销管道分類的市场估算与预测,2022-2035年
- 直销
- 经销商
- 线上零售
- 药局
第九章 2022-2035年各地区市场估算与预测
- 北美洲
- 美国
- 加拿大
- 欧洲
- 德国
- 英国
- 法国
- 西班牙
- 义大利
- 其他欧洲地区
- 亚太地区
- 中国
- 印度
- 日本
- 澳洲
- 韩国
- 亚太其他地区
- 拉丁美洲
- 巴西
- 墨西哥
- 阿根廷
- 其他拉丁美洲地区
- 中东和非洲
- 沙乌地阿拉伯
- 南非
- 阿拉伯聯合大公国
- 其他中东和非洲地区
第十章:公司简介
- TSI Group Ltd.
- Synutra Ingredients(Shandong)Co., Ltd.
- Yantai Dongcheng Pharmaceutical Group Co., Ltd.
- Jiaxing Hengjie Biopharmaceutical Co., Ltd.
- Qufu Liyang Biochem Industrial Co., Ltd.
- Pacific Rainbow International, Inc.
- Shandong Runxin Biotechnology Co., Ltd.
- ZPD A/S
- Guangdong Hybribio Biotech Co., Ltd.
- Wanbury Limited
- Sierra Ingredients Pty Ltd.
- BGM Pharmaceuticals Co., Ltd.
- YBCC(Qingdao)Co., Ltd.
- Anhui Jintung Fine Chemical Corporation Ltd.
The Global Chondroitin Sulphate Market was valued at USD 1.5 billion in 2025 and is estimated to grow at a CAGR of 5.3% to reach USD 2.4 billion by 2035.
The market is gaining steady momentum as awareness around joint health continues to rise among aging populations and health-focused consumers worldwide. The increasing incidence of joint discomfort and mobility-related conditions is encouraging greater consumption of nutritional supplements and functional products formulated with chondroitin sulphate. The market is also benefiting from shifting consumer preferences toward naturally derived and responsibly sourced ingredients, reinforcing demand for high-quality formulations. Advancements in production methods are improving purity, consistency, and scalability while supporting sustainability goals. Growth in the companion animal and livestock wellness space is further expanding application scope, as joint-support formulations gain importance in pet nutrition. Digital retail channels are strengthening market access, enabling brands to reach a broader consumer base while offering product transparency and convenience. Collectively, these dynamics are reinforcing long-term demand for chondroitin sulphate across human nutrition, veterinary applications, and wellness-focused product categories.
| Market Scope | |
|---|---|
| Start Year | 2025 |
| Forecast Year | 2026-2035 |
| Start Value | $1.5 Billion |
| Forecast Value | $2.4 Billion |
| CAGR | 5.3% |
The bovine-based chondroitin sulphate segment accounted for 39.3% share in 2025. This source continues to see widespread use due to its strong functional performance in joint health formulations and its established presence across supplement manufacturing.
The powdered chondroitin sulphate segment held 55.9% share in 2025. The dominance of this form is supported by its formulation flexibility, ease of incorporation into supplements, and alignment with clean-label and customizable nutrition trends.
North America Chondroitin Sulphate Market held 38.2% share in 2025. The region continues to show strong demand driven by high consumer awareness of joint health, widespread supplement usage, and a mature nutraceutical industry. The United States remains the primary contributor, supported by a strong preference for transparent sourcing and quality-focused formulations.
Key companies active in the Global Chondroitin Sulphate Market include Wanbury Limited, TSI Group Ltd., ZPD A/S, Sierra Ingredients Pty Ltd., Synutra Ingredients (Shandong) Co., Ltd., Pacific Rainbow International, Inc., Guangdong Hybribio Biotech Co., Ltd., Yantai Dongcheng Pharmaceutical Group Co., Ltd., Shandong Runxin Biotechnology Co., Ltd., Jiaxing Hengjie Biopharmaceutical Co., Ltd., BGM Pharmaceuticals Co., Ltd., Qufu Liyang Biochem Industrial Co., Ltd., YBCC (Qingdao) Co., Ltd., and Anhui Jintung Fine Chemical Corporation Ltd. Companies operating in the Global Chondroitin Sulphate Market are focusing on quality enhancement, supply chain transparency, and product differentiation to strengthen their market position. Manufacturers are investing in advanced processing technologies to improve purity, consistency, and sustainability while meeting evolving regulatory standards. Strategic partnerships with supplement brands and distributors are expanding global reach and application diversity. Firms are also prioritizing clean-label positioning and traceability to align with consumer demand for ethically sourced ingredients.
Table of Contents
Chapter 1 Methodology & Scope
- 1.1 Market scope and definition
- 1.2 Research design
- 1.2.1 Research approach
- 1.2.2 Data collection methods
- 1.3 Data mining sources
- 1.3.1 Global
- 1.3.2 Regional/Country
- 1.4 Base estimates and calculations
- 1.4.1 Base year calculation
- 1.4.2 Key trends for market estimation
- 1.5 Primary research and validation
- 1.5.1 Primary sources
- 1.6 Forecast model
- 1.7 Research assumptions and limitations
Chapter 2 Executive Summary
- 2.1 Industry 3600 synopsis
- 2.2 Key market trends
- 2.2.1 Regional
- 2.2.2 Source
- 2.2.3 Form
- 2.2.4 Application
- 2.2.5 Distribution Channel
- 2.3 TAM Analysis, 2025-2034
- 2.4 CXO perspectives: Strategic imperatives
- 2.4.1 Executive decision points
- 2.4.2 Critical success factors
- 2.5 Future Outlook and Strategic Recommendations
Chapter 3 Industry Insights
- 3.1 Industry ecosystem analysis
- 3.1.1 Supplier landscape
- 3.1.2 Profit margin
- 3.1.3 Value addition at each stage
- 3.1.4 Factor affecting the value chain
- 3.1.5 Disruptions
- 3.2 Industry impact forces
- 3.2.1 Growth drivers
- 3.2.2 Industry pitfalls and challenges
- 3.2.3 Market opportunities
- 3.3 Growth potential analysis
- 3.4 Regulatory landscape
- 3.4.1 North America
- 3.4.2 Europe
- 3.4.3 Asia Pacific
- 3.4.4 Latin America
- 3.4.5 Middle East & Africa
- 3.5 Porter's analysis
- 3.6 PESTEL analysis
- 3.7 Price trends
- 3.8 Future market trends
- 3.9 Technology and Innovation landscape
- 3.9.1 Current technological trends
- 3.9.2 Emerging technologies
- 3.10 Patent Landscape
- 3.11 Trade statistics (HS code) ( Note: the trade statistics will be provided for key countries only)
- 3.11.1 Major importing countries
- 3.11.2 Major exporting countries
Chapter 4 Competitive Landscape, 2025
- 4.1 Introduction
- 4.2 Company market share analysis
- 4.2.1 By region
- 4.2.1.1 North America
- 4.2.1.2 Europe
- 4.2.1.3 Asia Pacific
- 4.2.1.4 LATAM
- 4.2.1.5 MEA
- 4.2.1 By region
- 4.3 Company matrix analysis
- 4.4 Competitive analysis of major market players
- 4.5 Competitive positioning matrix
- 4.6 Key developments
- 4.6.1 Mergers & acquisitions
- 4.6.2 Partnerships & collaborations
- 4.6.3 New Product Launches
- 4.6.4 Expansion Plans
Chapter 5 Market Estimates and Forecast, By Source, 2022-2035 (USD Million & Tons)
- 5.1 Key trends
- 5.2 Bovine
- 5.3 Porcine
- 5.4 Avian
- 5.4.1 Chicken
- 5.4.2 Turkey
- 5.4.3 Others
- 5.5 Marine
- 5.5.1 Tuna
- 5.5.2 Salmon
- 5.5.3 Others
- 5.6 Others
Chapter 6 Market Estimates and Forecast, By Form, 2022-2035 (USD Million & Tons)
- 6.1 Key trends
- 6.2 Powder
- 6.3 Capsule/Tablets
- 6.4 Liquid
Chapter 7 Market Estimates and Forecast, By Application, 2022-2035 (USD Million & Tons)
- 7.1 Key trends
- 7.2 Dietary Supplements
- 7.2.1 Capsules
- 7.2.2 Tablets
- 7.2.3 Gummies
- 7.3 Pharmaceuticals
- 7.3.1 Osteoarthritis treatment drugs
- 7.3.2 Joint health formulations
- 7.4 Cosmetic and Personal Care
- 7.4.1 Anti-aging creams
- 7.4.2 Skin hydration products
- 7.5 Food and Beverages
- 7.6 Others
Chapter 8 Market Estimates and Forecast, By Distribution Channel, 2022-2035 (USD Million & Tons)
- 8.1 Key trends
- 8.2 Direct Sales
- 8.3 Distributors
- 8.4 Online Retail
- 8.5 Pharmacies
Chapter 9 Market Estimates and Forecast, By Region, 2022-2035 (USD Million & Tons)
- 9.1 Key trends
- 9.2 North America
- 9.2.1 U.S.
- 9.2.2 Canada
- 9.3 Europe
- 9.3.1 Germany
- 9.3.2 UK
- 9.3.3 France
- 9.3.4 Spain
- 9.3.5 Italy
- 9.3.6 Rest of Europe
- 9.4 Asia Pacific
- 9.4.1 China
- 9.4.2 India
- 9.4.3 Japan
- 9.4.4 Australia
- 9.4.5 South Korea
- 9.4.6 Rest of Asia Pacific
- 9.5 Latin America
- 9.5.1 Brazil
- 9.5.2 Mexico
- 9.5.3 Argentina
- 9.5.4 Rest of Latin America
- 9.6 Middle East and Africa
- 9.6.1 Saudi Arabia
- 9.6.2 South Africa
- 9.6.3 UAE
- 9.6.4 Rest of Middle East and Africa
Chapter 10 Company Profiles
- 10.1 TSI Group Ltd.
- 10.2 Synutra Ingredients (Shandong) Co., Ltd.
- 10.3 Yantai Dongcheng Pharmaceutical Group Co., Ltd.
- 10.4 Jiaxing Hengjie Biopharmaceutical Co., Ltd.
- 10.5 Qufu Liyang Biochem Industrial Co., Ltd.
- 10.6 Pacific Rainbow International, Inc.
- 10.7 Shandong Runxin Biotechnology Co., Ltd.
- 10.8 ZPD A/S
- 10.9 Guangdong Hybribio Biotech Co., Ltd.
- 10.10 Wanbury Limited
- 10.11 Sierra Ingredients Pty Ltd.
- 10.12 BGM Pharmaceuticals Co., Ltd.
- 10.13 YBCC (Qingdao) Co., Ltd.
- 10.14 Anhui Jintung Fine Chemical Corporation Ltd.
 硫酸软骨素:市场占有率分析、产业趋势与统计、成长预测(2026-2031)
 2026年全球硫酸软骨素市场报告
 硫酸软骨素市场-全球产业规模、份额、趋势、机会、预测:按原料、应用、区域和竞争对手划分,2021-2031年
 犬用葡萄糖胺补充剂市场按剂型、成分类型、配方和分销管道划分,全球预测(2026-2032年)
 硫酸软骨素市场规模、份额和成长分析(按来源、形态、应用和地区划分)-2026-2033年产业预测硫酸软骨素市场按形态、来源、生产流程、应用和分销管道划分-2025-2032年全球预测
 2025-2033年硫酸软骨素市场报告,依来源(牛、猪、家禽、鲨鱼等)、形式(粉末、片剂等)、应用(药品和保健品、动物饲料、个人护理和化妆品等)和地区划分
 硫酸软骨素市场规模、份额和趋势分析报告:按来源、应用、地区和细分市场预测,2025-2033 年
 硫酸软骨素市场,规模,占有率,趋势,产业分析报告:供给来源,各用途,各地区,2025年~2034年的市场预测
 硫酸软骨素市场按来源和地区划分