


 |
市场调查报告书
商品编码
1913458
抗解淀粉市场机会、成长要素、产业趋势分析及2026年至2035年预测Resistant Starch Market Opportunity, Growth Drivers, Industry Trend Analysis, and Forecast 2026 - 2035 |
||||||
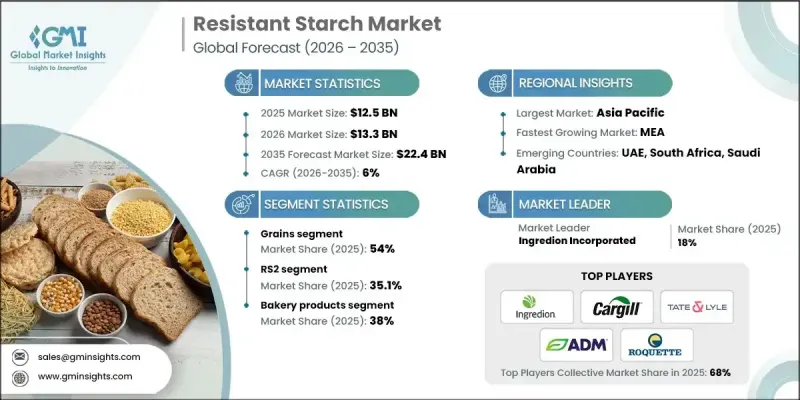
全球抗解淀粉市场预计到 2025 年将达到 125 亿美元,到 2035 年将达到 224 亿美元,年复合成长率为 6%。
代谢性疾病的日益普遍对市场成长产生了显着影响,迫使食品生产商重新设计配方以改善营养成分。抗解淀粉因其能够提高膳食纤维含量、降低血糖值指数,同时保持日常食品熟悉的口感和质地而备受关注。其功能性益处,例如维持消化系统健康、延长饱足感和稳定血糖值的大规模生产,尤其是在广泛种植的作物上。同时,生产商也在探索替代原料来源,以符合永续性目标和洁净标示策略。各种类型的抗解淀粉因其功能适用性而受到关注,其中天然存在的和重结晶的抗性淀粉比化学改性的抗性淀粉更受市场欢迎。这些趋势共同推动了抗性淀粉在全球食品和营养市场的广泛应用。
| 市场覆盖范围 | |
|---|---|
| 开始年份 | 2025 |
| 预测年份 | 2026-2035 |
| 起始值 | 125亿美元 |
| 预测金额 | 224亿美元 |
| 复合年增长率 | 6% |
预计到2025年,谷物类产品将占市场份额的54%,并在2035年之前以5.1%的复合年增长率成长。需求成长主要受消费者对熟悉作物原料的偏好以及区域供应的便利性所驱动,尤其是在亚太市场。源自谷物和蔬菜的抗解淀粉也因其洁净标示、非基因改造特性以及适用于机能性食品应用而备受关注。
预计到 2025 年,烘焙产品市占率将达到 38%,到 2035 年将以 6% 的复合年增长率成长。抗解淀粉正越来越多地被添加到日常食品中,以在不改变消费者体验的前提下,透过减少净碳水化合物和增加消化器官系统益处来微妙地提高营养价值。
预计到 2025 年,美国抗解淀粉市场规模将达到 32 亿美元。强大的创新能力、先进的研究基础设施和高效的零售分销网络支持富含纤维和低血糖指数食品的快速商业化。
目录
第一章调查方法和范围
第二章执行摘要
第三章业界考察
- 生态系分析
- 供应商情况
- 利润率
- 每个阶段的附加价值
- 影响价值链的因素
- 中断
- 产业影响因素
- 司机
- 糖尿病和肥胖症盛行率不断上升
- 偏好洁净标示和天然成分。
- 提高人们对肠道环境和益生元的认识
- 产业潜在风险与挑战
- 与传统淀粉相比,高成本
- 消费者意识和理解力低下
- 市场机会
- 拓展至植物来源及纯素食品领域
- 在医学和临床营养领域的应用
- 司机
- 成长潜力分析
- 监管环境
- 北美洲
- 欧洲
- 亚太地区
- 拉丁美洲
- 中东和非洲
- 波特五力分析
- PESTEL 分析
- 价格趋势
- 按地区
- 副产品
- 未来市场趋势
- 科技与创新趋势
- 当前技术趋势
- 新兴技术
- 专利状态
- 贸易统计(HS编码)(註:仅提供主要国家的贸易统计)
- 主要进口国
- 主要出口国
- 永续性和环境方面
- 永续努力
- 减少废弃物策略
- 生产中的能源效率
- 环保倡议
- 考虑到碳足迹
第四章 竞争情势
- 介绍
- 公司市占率分析
- 按地区
- 北美洲
- 欧洲
- 亚太地区
- 拉丁美洲
- 中东和非洲
- 按地区
- 企业矩阵分析
- 主要市场公司的竞争分析
- 竞争定位矩阵
- 重大进展
- 併购
- 伙伴关係与合作
- 新产品发布
- 业务拓展计划
第五章 市场估计与预测:依来源/生物物种划分,2022-2035年
- 粮食
- 米
- 小麦
- 高粱
- 西米
- 其他谷物
- 蔬菜
- 糯玉米
- 木薯
- 豌豆
- 其他蔬菜
- 其他成分
第六章 2022-2035年按产品分類的市场估算与预测
- RS1
- RS2
- RS3
- RS4
- RS5
第七章 按应用领域分類的市场估算与预测,2022-2035年
- 乳製品
- 烘焙产品
- 麵包
- 饼干
- 饼干
- 其他的
- 糖果甜点
- 营养棒
- 其他的
- 速食食品
- 麵条
- 义式麵食
- 谷物
- 饼干
- 汤
- 其他的
第八章 2022-2035年各地区市场估算与预测
- 北美洲
- 美国
- 加拿大
- 欧洲
- 德国
- 英国
- 法国
- 西班牙
- 义大利
- 其他欧洲地区
- 亚太地区
- 中国
- 印度
- 日本
- 澳洲
- 韩国
- 亚太其他地区
- 拉丁美洲
- 巴西
- 墨西哥
- 阿根廷
- 其他拉丁美洲地区
- 中东和非洲
- 沙乌地阿拉伯
- 南非
- 阿拉伯聯合大公国
- 其他中东和非洲地区
第九章:公司简介
- Xian Kono Chem
- SunOpta
- MSPrebiotics
- Sheekharr Starch Private Limited
- AGRANA Beteiligungs
- Natural Stacks
- Gut Garden
- ADM
- Roquette Freres
- Arcadia Biosciences
- Tate &Lyle
- MGP Ingredients Inc.
- Ingredion Incorporated
- Cargill
The Global Resistant Starch Market was valued at USD 12.5 billion in 2025 and is estimated to grow at a CAGR of 6% to reach USD 22.4 billion by 2035.
Market growth has been strongly influenced by rising rates of metabolic health conditions, which have prompted food producers to redesign formulations with improved nutritional profiles. Resistant starch has gained attention as it allows manufacturers to enhance fiber content and reduce glycemic impact while maintaining the familiar taste and texture of everyday food products. Its functional benefits related to digestive wellness, prolonged satiety, and blood sugar moderation have increased its use across multiple food categories. Between 2021 and 2025, raw material availability and processing efficiency supported large-scale production, particularly from widely cultivated crops. At the same time, producers explored alternative raw material streams to align with sustainability goals and clean-label positioning. Different types of resistant starch gained traction based on functional suitability, with naturally occurring and retrograded variants receiving stronger market acceptance compared to chemically modified options. These combined trends continue to support broad adoption across global food and nutrition markets.
| Market Scope | |
|---|---|
| Start Year | 2025 |
| Forecast Year | 2026-2035 |
| Start Value | $12.5 Billion |
| Forecast Value | $22.4 Billion |
| CAGR | 6% |
The grains segment accounted for 54% share in 2025 and is expected to grow at a CAGR of 5.1% through 2035. Demand is being driven by preference for familiar crop sources and regional availability, particularly in Asia Pacific markets. Grain- and vegetable-derived resistant starches are also gaining attention for their suitability in clean-label, non-GMO, and functional food applications.
The bakery products segment held 38% share in 2025 and is projected to grow at a CAGR of 6% through 2035. Resistant starch is increasingly incorporated into everyday food products to subtly improve nutritional value by lowering net carbohydrates and enhancing digestive benefits without altering consumer experience.
US Resistant Starch Market reached USD 3.2 billion in 2025. Strong innovation capabilities, advanced research infrastructure, and efficient retail distribution support the rapid commercialization of fiber-enriched and low-glycemic food products.
Key companies operating in the Global Resistant Starch Market include Cargill, Ingredion Incorporated, Tate & Lyle, Roquette Freres, ADM, SunOpta, AGRANA Beteiligungs, MGP Ingredients Inc., Arcadia Biosciences, Xian Kono Chem, MSPrebiotics, Sheikharr Starch Private Limited, Natural Stacks, and Gut Garden. Companies in the Global Resistant Starch Market are strengthening their competitive position through continuous investment in research, formulation science, and application-specific solutions. Many players are expanding portfolios with clean-label and naturally sourced resistant starches to meet evolving consumer expectations. Strategic collaborations with food manufacturers enable faster integration into mainstream products. Firms are also focusing on supply chain optimization and sustainable sourcing to improve efficiency and transparency.
Table of Contents
Chapter 1 Methodology & Scope
- 1.1 Market scope and definition
- 1.2 Research design
- 1.2.1 Research approach
- 1.2.2 Data collection methods
- 1.3 Data mining sources
- 1.3.1 Global
- 1.3.2 Regional/Country
- 1.4 Base estimates and calculations
- 1.4.1 Base year calculation
- 1.4.2 Key trends for market estimation
- 1.5 Primary research and validation
- 1.5.1 Primary sources
- 1.6 Forecast model
- 1.7 Research assumptions and limitations
Chapter 2 Executive Summary
- 2.1 Industry 3600 synopsis
- 2.2 Key market trends
- 2.2.1 Regional
- 2.2.2 Source / Organism Type
- 2.2.3 Product
- 2.2.4 Application
- 2.3 TAM Analysis, 2026-2035
- 2.4 CXO perspectives: Strategic imperatives
- 2.4.1 Executive decision points
- 2.4.2 Critical success factors
- 2.5 Future Outlook and Strategic Recommendations
Chapter 3 Industry Insights
- 3.1 Industry ecosystem analysis
- 3.1.1 Supplier landscape
- 3.1.2 Profit margin
- 3.1.3 Value addition at each stage
- 3.1.4 Factor affecting the value chain
- 3.1.5 Disruptions
- 3.2 Industry impact forces
- 3.2.1 Growth drivers
- 3.2.1.1 Rising diabetes and obesity prevalence
- 3.2.1.2 Clean-label and natural ingredient preference
- 3.2.1.3 Growing gut health and prebiotic awareness
- 3.2.2 Industry pitfalls and challenges
- 3.2.2.1 Higher cost versus conventional starches
- 3.2.2.2 Limited consumer awareness and understanding
- 3.2.3 Market opportunities
- 3.2.3.1 Expansion into plant-based and vegan foods
- 3.2.3.2 Use in medical and clinical nutrition
- 3.2.1 Growth drivers
- 3.3 Growth potential analysis
- 3.4 Regulatory landscape
- 3.4.1 North America
- 3.4.2 Europe
- 3.4.3 Asia Pacific
- 3.4.4 Latin America
- 3.4.5 Middle East & Africa
- 3.5 Porter's analysis
- 3.6 PESTEL analysis
- 3.7 Price trends
- 3.7.1 By region
- 3.7.2 By Product
- 3.8 Future market trends
- 3.9 Technology and Innovation landscape
- 3.9.1 Current technological trends
- 3.9.2 Emerging technologies
- 3.10 Patent Landscape
- 3.11 Trade statistics (HS code) ( Note: The trade statistics will be provided for key countries only)
- 3.11.1 Major importing countries
- 3.11.2 Major exporting countries
- 3.12 Sustainability and environmental aspects
- 3.12.1 Sustainable practices
- 3.12.2 Waste reduction strategies
- 3.12.3 Energy efficiency in production
- 3.12.4 Eco-friendly initiatives
- 3.13 Carbon footprint consideration
Chapter 4 Competitive Landscape, 2025
- 4.1 Introduction
- 4.2 Company market share analysis
- 4.2.1 By region
- 4.2.1.1 North America
- 4.2.1.2 Europe
- 4.2.1.3 Asia Pacific
- 4.2.1.4 LATAM
- 4.2.1.5 MEA
- 4.2.1 By region
- 4.3 Company matrix analysis
- 4.4 Competitive analysis of major market players
- 4.5 Competitive positioning matrix
- 4.6 Key developments
- 4.6.1 Mergers & acquisitions
- 4.6.2 Partnerships & collaborations
- 4.6.3 New Product Launches
- 4.6.4 Expansion Plans
Chapter 5 Market Estimates and Forecast, By Source / Organism Type, 2022-2035 (USD Billion) (Kilo Tons)
- 5.1 Key trends
- 5.2 Grains
- 5.2.1 Rice
- 5.2.2 Wheat
- 5.2.3 Sorghum
- 5.2.4 Sago
- 5.2.5 Other grains
- 5.3 Vegetables
- 5.3.1 Waxy corn
- 5.3.2 Tapioca
- 5.3.3 Pea
- 5.3.4 Other vegetables
- 5.4 Other sources
Chapter 6 Market Estimates and Forecast, By Product, 2022-2035 (USD Billion) (Kilo Tons)
- 6.1 Key trends
- 6.2 RS1
- 6.3 RS2
- 6.4 RS3
- 6.5 RS4
- 6.6 RS5
Chapter 7 Market Estimates and Forecast, By Application, 2022-2035 (USD Billion) (Kilo Tons)
- 7.1 Key trends
- 7.2 Dairy products
- 7.3 Bakery products
- 7.3.1 Bread
- 7.3.2 Cookies
- 7.3.3 Biscuits
- 7.3.4 Others
- 7.4 Sugar confections
- 7.4.1 Nutrition Bars
- 7.4.2 Others
- 7.5 Convenience foods
- 7.5.1 Noodles
- 7.5.2 Pasta
- 7.5.3 Breakfast Cereals
- 7.5.4 Crackers
- 7.5.5 Soup
- 7.5.6 Others
Chapter 8 Market Estimates and Forecast, By Region, 2022-2035 (USD Billion) (Kilo Tons)
- 8.1 Key trends
- 8.2 North America
- 8.2.1 U.S.
- 8.2.2 Canada
- 8.3 Europe
- 8.3.1 Germany
- 8.3.2 UK
- 8.3.3 France
- 8.3.4 Spain
- 8.3.5 Italy
- 8.3.6 Rest of Europe
- 8.4 Asia Pacific
- 8.4.1 China
- 8.4.2 India
- 8.4.3 Japan
- 8.4.4 Australia
- 8.4.5 South Korea
- 8.4.6 Rest of Asia Pacific
- 8.5 Latin America
- 8.5.1 Brazil
- 8.5.2 Mexico
- 8.5.3 Argentina
- 8.5.4 Rest of Latin America
- 8.6 Middle East and Africa
- 8.6.1 Saudi Arabia
- 8.6.2 South Africa
- 8.6.3 UAE
- 8.6.4 Rest of Middle East and Africa
Chapter 9 Company Profiles
- 9.1 Xian Kono Chem
- 9.2 SunOpta
- 9.3 MSPrebiotics
- 9.4 Sheekharr Starch Private Limited
- 9.5 AGRANA Beteiligungs
- 9.6 Natural Stacks
- 9.7 Gut Garden
- 9.8 ADM
- 9.9 Roquette Freres
- 9.10 Arcadia Biosciences
- 9.11 Tate & Lyle
- 9.12 MGP Ingredients Inc.
- 9.13 Ingredion Incorporated
- 9.14 Cargill


