


 |
市场调查报告书
商品编码
1928898
储水式热水器市场机会、成长要素、产业趋势分析及2026年至2035年预测Storage Water Heater Market Opportunity, Growth Drivers, Industry Trend Analysis, and Forecast 2026 - 2035 |
||||||
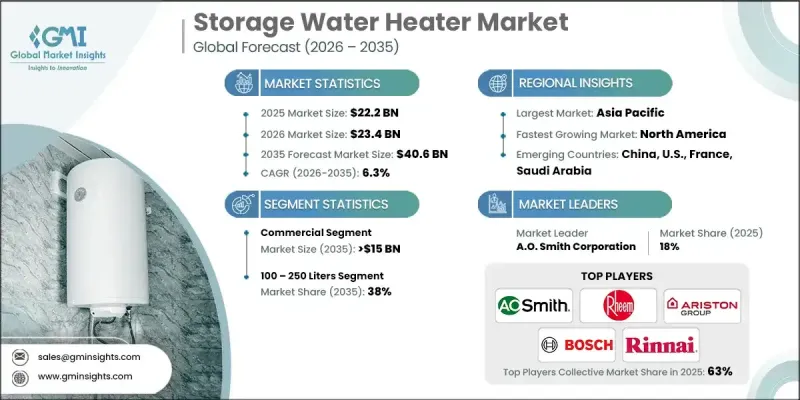
全球储水式热水器市场预计到 2025 年将达到 222 亿美元,到 2035 年将达到 406 亿美元,年复合成长率为 6.3%。
技术进步,例如更优良的隔热材料、更智慧的控制系统和高效的热交换器设计,提升了大容量热水器的性能和易用性,从而推动了热水器市场的成长。更严格的国家和国际能源效率标准,以及对永续热水解决方案的持续投入,进一步促进了热水器的普及。企业正优先考虑节能环保热水器,以实现其永续性目标。同时,政府的奖励、补贴和税额扣抵也推动了商业和住宅热水器的升级改造。与智慧电网和太阳能、地热系统等再生能源来源的整合,可以优化能源利用、降低成本并减少对石化燃料的依赖。新兴市场的都市化、生活水准的提高以及电气化程度的提升,进一步推动了热水器的普及,使其成为住宅和商业应用中不可或缺的组件。
| 市场覆盖范围 | |
|---|---|
| 开始年份 | 2025 |
| 预测年份 | 2026-2035 |
| 起始值 | 222亿美元 |
| 预测金额 | 406亿美元 |
| 复合年增长率 | 6.3% |
受家庭能源需求成长和日常可靠热水需求的推动,预计到2035年,住宅市场将以5.5%的复合年增长率成长。节能型热水器采用增强型隔热材料、智慧温控器,并与家庭能源系统集成,在降低能源费用的同时,也提升了便利性和性能。
预计到2035年,30公升容量的热水器市场规模将达到40亿美元,主要得益于小规模家庭、公寓和空间有限的场所对这类热水器的青睐。这类热水器非常适合厨房和浴室等即用即热的场所,这些场所通常需要快速加热且热水需求量不大。新兴经济体的都市化加快、紧凑型住宅趋势、价格可负担性提高以及电气化程度的提高,都推动了这个市场的成长。
预计到2025年,美国储水式热水器市场规模将达到30亿美元,其成长主要得益于储能技术的普及和对可再生能源计划的大力投资。对可靠且永续的热水解决方案的需求正在推动太阳能光电与储能係统结合的应用。
目录
第一章调查方法和范围
第二章执行摘要
第三章业界考察
- 产业生态系统
- 原物料供应及采购分析
- 製造能力评估
- 供应链韧性与风险因素
- 配电网路分析
- 监管环境
- 产业影响因素
- 司机
- 产业潜在风险与挑战
- 成长潜力分析
- 价格趋势分析
- 按产能
- 按地区
- 成本结构分析
- 波特分析
- 供应商的议价能力
- 买方的议价能力
- 新进入者的威胁
- 替代品的威胁
- PESTEL 分析
- 新的机会与趋势
- 数位化和物联网集成
- 拓展新兴市场
- 投资分析及未来展望
第四章 竞争情势
- 介绍
- 公司市占率分析
- 北美洲
- 欧洲
- 亚太地区
- 欧亚大陆
- CIS
- 中东和非洲
- 拉丁美洲
- 战略仪錶板
- 策略倡议
- 创新与科技趋势
第五章 依产能分類的市场规模及预测(2023-2035年)
- 少于30公升
- 30至100公升
- 100至250升
- 250至400升
- 超过400公升
第六章 依能源来源分類的市场规模及预测(2023-2035年)
- 电
- 气体
第七章 依应用领域分類的市场规模及预测(2023-2035年)
- 住宅
- 商业的
- 学院和高等教育机构
- 办公室
- 政府/军队
- 其他的
第八章 2023-2035年各地区市场规模及预测
- 北美洲
- 我们
- 加拿大
- 欧洲
- 英国
- 法国
- 德国
- 义大利
- 奥地利
- 西班牙
- 荷兰
- 丹麦
- 芬兰
- 瑞典
- 挪威
- 亚太地区
- 中国
- 日本
- 韩国
- 印度
- 澳洲
- 印尼
- 马来西亚
- 新加坡
- 泰国
- 纽西兰
- 菲律宾
- 越南
- 欧亚大陆
- 俄罗斯
- 白俄罗斯
- 哈萨克
- 吉尔吉斯斯坦
- 亚美尼亚
- CIS
- 亚塞拜然
- 摩尔多瓦
- 塔吉克
- 土库曼
- 乌兹别克
- 中东和非洲
- 沙乌地阿拉伯
- 阿拉伯聯合大公国
- 卡达
- 科威特
- 阿曼
- 土耳其
- 南非
- 奈及利亚
- 埃及
- 以色列
- 伊拉克
- 拉丁美洲
- 巴西
- 阿根廷
- 智利
- 墨西哥
第九章:公司简介
- AO Smith
- Ariston Holding NV
- Bosch Thermotechnology Ltd.
- Bradford White Corporation, USA
- Essency
- Ferroli SpA
- Groupe Atlantic
- Havells India Ltd.
- Hubbell Heaters
- Haier Inc.
- Jaquar India
- Linuo Ritter International Co., Ltd.
- Nihon Itomic Co., Ltd.
- Rheem Manufacturing Company
- Rinnai America Corporation
- State Industries.
- Saudi Ceramics Company
- Viessmann
- Vaillant
- Whirlpool Corporation
The Global Storage Water Heater Market was valued at USD 22.2 billion in 2025 and is estimated to grow at a CAGR of 6.3% to reach USD 40.6 billion by 2035.
Growth is driven by technological advancements, including superior insulation materials, smarter control systems, and more efficient heat exchanger designs that enhance the performance and usability of large-capacity units. Rising adoption is further supported by stricter domestic and international energy efficiency standards, as well as increasing investments in sustainable water heating solutions. Businesses are prioritizing energy-efficient, environmentally friendly water heaters to meet corporate sustainability targets, while government incentives, rebates, and tax credits are motivating commercial and residential upgrades. Integration with smart grids and renewable energy sources, such as solar thermal and geothermal systems, enables optimized energy use, lower costs, and reduced reliance on fossil fuels. Urbanization, rising living standards, and electrification in emerging markets further bolster adoption, positioning storage water heaters as essential in both residential and commercial applications.
| Market Scope | |
|---|---|
| Start Year | 2025 |
| Forecast Year | 2026-2035 |
| Start Value | $22.2 Billion |
| Forecast Value | $40.6 Billion |
| CAGR | 6.3% |
The residential segment is expected to grow at a CAGR of 5.5% by 2035, driven by increased household energy demand and a need for reliable hot water for daily use. Energy-efficient models, equipped with enhanced insulation, smart thermostats, and home energy system integration, are reducing utility costs while improving convenience and performance.
The 30-liter category is projected to reach USD 4 billion by 2035, favored in smaller households, apartments, and space-constrained areas. These units are ideal for point-of-use applications, including kitchens and bathrooms, where quick heating and limited hot water requirements are common. Growth is supported by rising urbanization, compact housing trends, affordability, and expanding electrification in emerging economies.
U.S. Storage Water Heater Market reached USD 3 billion in 2025, with growth fueled by energy storage integration and strong investments in renewable energy projects. Solar-plus-storage adoption is increasing, driven by the demand for reliable, sustainable hot water solutions.
Key companies in the Global Storage Water Heater Market include Rheem Manufacturing Company, A.O. Smith, Ariston Holding N.V., Viessmann, Bosch Thermotechnology, Bradford White Corporation, Whirlpool Corporation, Linuo Ritter International Co., Jaquar India, Havells India Ltd., Nihon Itomic Co., Rinnai America Corporation, Ferroli S.p.A, Groupe Atlantic, Haier Inc., Essency, Hubbell Heaters, State Industries, Vaillant, and Saudi Ceramics Company. Industry players strengthen their presence by prioritizing innovation, sustainability, and energy efficiency. Companies invest heavily in R&D to develop high-performance, low-energy water heaters with smart controls and renewable integration. Expanding distribution networks across emerging and developed markets improves accessibility. Strategic collaborations with utility providers and government programs enable them to leverage incentives, rebates, and tax benefits. Enhanced after-sales services, predictive maintenance solutions, and digital monitoring systems improve customer satisfaction and loyalty.
Table of Contents
Chapter 1 Methodology & Scope
- 1.1 Research design
- 1.1.1 Research approach
- 1.1.2 Data collection methods
- 1.2 Base estimates and calculations
- 1.2.1 Base year calculation
- 1.2.2 Key trends for market estimates
- 1.3 Forecast model
- 1.3.1 Key trends for market estimates
- 1.3.1.1 Quantified market impact analysis
- 1.3.1.2 Mathematical impact of growth parameters on forecast
- 1.3.2 Scenario analysis framework
- 1.3.1 Key trends for market estimates
- 1.4 Primary research and validation
- 1.4.1 Some of the primary sources (but not limited to)
- 1.5 Data mining sources
- 1.5.1 Paid Sources
- 1.5.2 Sources, by region
- 1.6 Research trail & scoring components
- 1.6.1 Research trail components
- 1.6.2 Scoring components
- 1.7 Research transparency addendum
- 1.7.1 Source attribution framework
- 1.7.2 Quality assurance metrics
- 1.7.3 Our commitment to trust
- 1.8 Market definitions
Chapter 2 Executive Summary
- 2.1 Industry 360-degree synopsis, 2023 - 2035
- 2.2 Business trends
- 2.3 Capacity trends
- 2.4 Energy source trends
- 2.5 Application trends
- 2.6 Regional trends
Chapter 3 Industry Insights
- 3.1 Industry ecosystem
- 3.1.1 Raw material availability & sourcing analysis
- 3.1.2 Manufacturing capacity assessment
- 3.1.3 Supply chain resilience & risk factors
- 3.1.4 Distribution network analysis
- 3.2 Regulatory landscape
- 3.3 Industry impact forces
- 3.3.1 Growth drivers
- 3.3.2 Industry pitfalls & challenges
- 3.4 Growth potential analysis
- 3.5 Price trend analysis
- 3.5.1 By capacity
- 3.5.2 By region
- 3.6 Cost structure analysis
- 3.7 Porter';s analysis
- 3.7.1 Bargaining power of suppliers
- 3.7.2 Bargaining power of buyers
- 3.7.3 Threat of new entrants
- 3.7.4 Threat of substitutes
- 3.8 PESTEL analysis
- 3.8.1 Political factors
- 3.8.2 Economic factors
- 3.8.3 Social factors
- 3.8.4 Technological factors
- 3.8.5 Legal factors
- 3.8.6 Environmental factors
- 3.9 Emerging opportunities & trends
- 3.9.1 Digitalization & IoT integration
- 3.9.2 Emerging market penetration
- 3.10 Investment analysis and future outlook
Chapter 4 Competitive landscape, 2025
- 4.1 Introduction
- 4.2 Company market share analysis, 2024
- 4.2.1 North America
- 4.2.2 Europe
- 4.2.3 Asia Pacific
- 4.2.4 Eurasia
- 4.2.5 CIS
- 4.2.6 Middle East & Africa
- 4.2.7 Latin America
- 4.3 Strategic dashboard
- 4.4 Strategic initiatives
- 4.5 Innovation & technology landscape
Chapter 5 Market Size and Forecast, By Capacity, 2023 - 2035 (USD Billion & ‘000 Units)
- 5.1 Key trends
- 5.2 < 30 liters
- 5.3 30 -100 liters
- 5.4 100 - 250 liters
- 5.5 250 - 400 liters
- 5.6 > 400 liters
Chapter 6 Market Size and Forecast, By Energy Source, 2023 - 2035 (USD Billion & ‘000 Units)
- 6.1 Key trends
- 6.2 Electric
- 6.3 Gas
Chapter 7 Market Size and Forecast, By Application, 2023 - 2035 (USD Billion & ‘000 Units)
- 7.1 Key trends
- 7.2 Residential
- 7.3 Commercial
- 7.3.1 College/University
- 7.3.2 Offices
- 7.3.3 Government/Military
- 7.3.4 Others
Chapter 8 Market Size and Forecast, By Region, 2023 - 2035 (USD Billion & ‘000 Units)
- 8.1 Key trends
- 8.2 North America
- 8.2.1 U.S.
- 8.2.2 Canada
- 8.3 Europe
- 8.3.1 UK
- 8.3.2 France
- 8.3.3 Germany
- 8.3.4 Italy
- 8.3.5 Austria
- 8.3.6 Spain
- 8.3.7 Netherlands
- 8.3.8 Denmark
- 8.3.9 Finland
- 8.3.10 Sweden
- 8.3.11 Norway
- 8.4 Asia Pacific
- 8.4.1 China
- 8.4.2 Japan
- 8.4.3 South Korea
- 8.4.4 India
- 8.4.5 Australia
- 8.4.6 Indonesia
- 8.4.7 Malaysia
- 8.4.8 Singapore
- 8.4.9 Thailand
- 8.4.10 New Zealand
- 8.4.11 Philippines
- 8.4.12 Vietnam
- 8.5 Eurasia
- 8.5.1 Russia
- 8.5.2 Belarus
- 8.5.3 Kazakhstan
- 8.5.4 Kyrgyzstan
- 8.5.5 Armenia
- 8.6 CIS
- 8.6.1 Azerbaijan
- 8.6.2 Moldova
- 8.6.3 Tajikistan
- 8.6.4 Turkmenistan
- 8.6.5 Uzbekistan
- 8.7 Middle East & Africa
- 8.7.1 Saudi Arabia
- 8.7.2 UAE
- 8.7.3 Qatar
- 8.7.4 Kuwait
- 8.7.5 Oman
- 8.7.6 Turkey
- 8.7.7 South Africa
- 8.7.8 Nigeria
- 8.7.9 Egypt
- 8.7.10 Israel
- 8.7.11 Iraq
- 8.8 Latin America
- 8.8.1 Brazil
- 8.8.2 Argentina
- 8.8.3 Chile
- 8.8.4 Mexico
Chapter 9 Company Profiles
- 9.1 A.O. Smith
- 9.2 Ariston Holding N.V.
- 9.3 Bosch Thermotechnology Ltd.
- 9.4 Bradford White Corporation, USA
- 9.5 Essency
- 9.6 Ferroli S.p.A
- 9.7 Groupe Atlantic
- 9.8 Havells India Ltd.
- 9.9 Hubbell Heaters
- 9.10 Haier Inc.
- 9.11 Jaquar India
- 9.12 Linuo Ritter International Co., Ltd.
- 9.13 Nihon Itomic Co., Ltd.
- 9.14 Rheem Manufacturing Company
- 9.15 Rinnai America Corporation
- 9.16 State Industries.
- 9.17 Saudi Ceramics Company
- 9.18 Viessmann
- 9.19 Vaillant
- 9.20 Whirlpool Corporation
 热水器市场:2026-2032年全球市场预测(依能源来源、安装类型、容量、应用、销售管道及安装类型划分)瓦斯热水器市场:依产品类型、技术、燃料类型、安装类型、容量、应用、通路划分,全球预测(2026-2032年)房车无水箱热水器市场按燃料类型、房车类型、安装类型、容量范围、技术类型、销售管道和最终用户划分,全球预测,2026-2032年
 工业热水器市场分析及预测(至2035年):依类型、产品类型、服务、技术、组件、应用、最终用户、功能、安装类型划分房车热水器市场按类型、燃料类型、车辆类型和分销管道划分-2026-2032年全球预测
 全球热水器市场(2025 年)
 日本热水器市场规模、份额、趋势及预测(按产品类型、应用和地区划分,2026-2034年)
 热水器市场规模、份额和成长分析(按类型、技术、产品类型、容量、应用和地区划分)-2026-2033年产业预测
 储水式热水器市场规模、份额和成长分析(按能源来源、水箱容量、材质、最终用户和地区划分)—2026-2033年产业预测
 瓦斯热水器市场规模、份额及成长分析(按类型、瓦斯类型、点火方式、容量、效率及地区划分)-2026-2033年产业预测