


 |
市场调查报告书
商品编码
1928914
氮气市场机会、成长要素、产业趋势分析及2026年至2035年预测Nitrogen Gas Market Opportunity, Growth Drivers, Industry Trend Analysis, and Forecast 2026 - 2035 |
||||||
全球氮气市场预计到 2025 年价值 474 亿美元,到 2035 年达到 812 亿美元,年复合成长率为 5.5%。
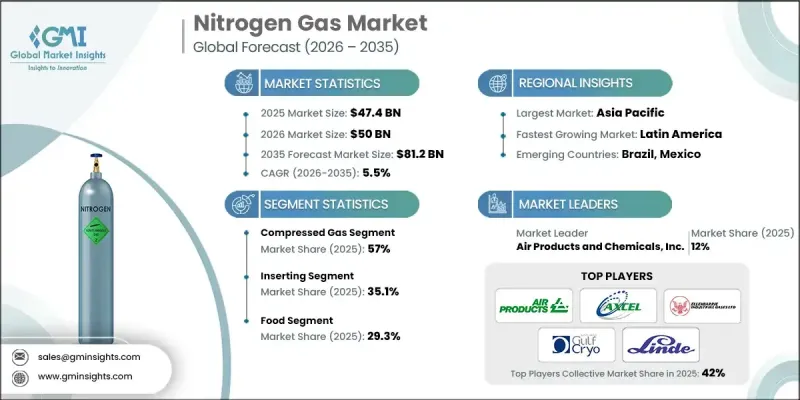
这一成长主要受能源密集产业生产活动的增加所驱动,这些活动推动了氮气在惰性保护、覆盖和製程保护等领域的应用。先进生命科学製造业的生产扩张也支撑了需求,氮气被广泛用于受控环境、保存和稳定化製程。高纯度氮气在敏感生物材料的保存和先进治疗药物的生产中应用日益广泛。电子和半导体生产的快速成长也促进了氮气消费量的成长,氮气在维持生产过程中的受控气氛方面发挥关键作用。同时,生产商正优先考虑透过改进空气分离技术以及整合绿能和热源来提高能源效率和减少排放。重工业终端用户正在加速向现场发电系统和管道供应模式转型,这提高了供应可靠性并减少了运输相关的排放。这些因素共同推动了多个产业部门的长期市场扩张。
| 市场覆盖范围 | |
|---|---|
| 开始年份 | 2025 |
| 预测年份 | 2026-2035 |
| 起始值 | 474亿美元 |
| 预测金额 | 812亿美元 |
| 复合年增长率 | 5.5% |
2025年,压缩氮气市占率达到57%,预计到2035年将以5.3%的复合年增长率成长。供应商受益于同时提供压缩氮气和液态氮气,这两种形式分别满足不同的运作需求。压缩氮气广泛应用于常规工业製程,通常透过气瓶、气束或散装系统输送。而液态氮对需要快速、高强度冷却和低温性能的应用至关重要。
预计到 2025 年,插入式气体处理市占率将达到 35.1%,2026 年至 2035 年的复合年增长率将达到 14.8%。氮气解决方案以及覆盖、吹扫和相关功能正在成为多个工业领域的标准配置,以提高操作安全性、降低污染风险并满足日益严格的品质和安全标准。
预计到 2025 年,北美氮气市场规模将达到 119 亿美元。这一增长得益于多元化的工业基础、成熟的管道输送和现场製氮基础设施,以及先进製造业的蓬勃发展。
目录
第一章调查方法和范围
第二章执行摘要
第三章业界考察
- 生态系分析
- 供应商情况
- 利润率
- 每个阶段的附加价值
- 影响价值链的因素
- 中断
- 产业影响因素
- 司机
- 工业和製造业产出增加
- 食品加工和低温运输物流的成长
- 製药、生物技术和半导体产业的扩张
- 产业潜在风险与挑战
- 空气分离装置的高能耗
- 透过现场发电减少大宗货物运输
- 市场机会
- 引入环境友善、低碳氮生产工艺
- 新兴市场的工业化与基础设施发展
- 司机
- 成长潜力分析
- 监管环境
- 北美洲
- 欧洲
- 亚太地区
- 拉丁美洲
- 中东和非洲
- 波特分析
- PESTEL 分析
- 价格趋势
- 按地区
- 按形式
- 未来市场趋势
- 科技与创新趋势
- 当前技术趋势
- 新兴技术
- 专利状态
- 贸易统计(HS编码)
(註:贸易统计数据仅涵盖主要国家。)
- 主要进口国
- 主要出口国
- 永续性和环境方面
- 永续努力
- 减少废弃物策略
- 生产中的能源效率
- 环保倡议
- 考虑到碳足迹
第四章 竞争情势
- 介绍
- 公司市占率分析
- 按地区
- 北美洲
- 欧洲
- 亚太地区
- 拉丁美洲
- 中东和非洲
- 按地区
- 企业矩阵分析
- 主要市场公司的竞争分析
- 竞争定位矩阵
- 重大进展
- 併购
- 伙伴关係与合作
- 新产品发布
- 业务拓展计划
第五章 按类型分類的市场估算与预测,2022-2035年
- 压缩气体
- 高压汽缸
- 大宗/管式拖车
- 现场生成的压缩氮气
- 液态氮体
- 散装储存槽
- 杜瓦瓶/便携式容器
- 现场低温设备
第六章 按应用领域分類的市场估算与预测,2022-2035年
- 惰性
- 反应器和容器惰性
- 储存槽惰性
- 管道惰性
- 毯子
- 食品饮料头部空间覆盖
- 化学品和溶剂储罐的覆盖层
- 石油和燃料储存的覆盖层
- 焊接和切割
- 金属焊接保护气体混合物
- 雷射和等离子切割支持
- 热处理和硬焊气氛
- 清除
- 管道和工艺管线的清洗
- 设备启动和关闭期间的吹扫
- 维护和安全操作的吹扫
- 其他的
7. 2022-2035年按最终用途产业分類的市场估算与预测
- 化妆品
- 食物
- 车
- 製药
- 其他的
第八章 2022-2035年各地区市场估算与预测
- 北美洲
- 我们
- 加拿大
- 欧洲
- 德国
- 英国
- 法国
- 西班牙
- 义大利
- 其他欧洲地区
- 亚太地区
- 中国
- 印度
- 日本
- 澳洲
- 韩国
- 亚太其他地区
- 拉丁美洲
- 巴西
- 墨西哥
- 阿根廷
- 其他拉丁美洲地区
- 中东和非洲
- 沙乌地阿拉伯
- 南非
- 阿拉伯聯合大公国
- 其他中东和非洲地区
第九章:公司简介
- Air Products and Chemicals, Inc.
- Axcel Gases
- Ellenbarrie industrial Gases.
- Gulfcryo
- Linde PLC
- Messer Group
- Omega Air
- PARKER HANNIFIN CORP
- Praxair Technology, Inc.
- Southern Industrial Gas
- Universal Industrial Gases, Inc.
- Yingde Gases Group
The Global Nitrogen Gas Market was valued at USD 47.4 billion in 2025 and is estimated to grow at a CAGR of 5.5% to reach USD 81.2 billion by 2035.
Growth is driven by rising production activity across energy-intensive industries, which has increased the use of nitrogen for inerting, blanketing, and process protection applications. Expanding output in advanced life science manufacturing has further supported demand, as nitrogen is widely used for controlled environments, preservation, and stabilization processes. High-purity nitrogen continues to see increased adoption in the storage of sensitive biological materials and in advanced therapeutic manufacturing workflows. The rapid expansion of electronics and semiconductor production has also contributed to higher consumption, as nitrogen plays a critical role in maintaining controlled atmospheres during fabrication. At the same time, producers are prioritizing improvements in energy efficiency and emissions reduction by enhancing air separation technologies and integrating cleaner power and heat sources. End users across heavy industries are increasingly shifting toward on-site generation systems and pipeline-based supply models, which improve supply reliability while lowering transportation-related emissions. These combined factors are reinforcing long-term market expansion across multiple industrial sectors.
| Market Scope | |
|---|---|
| Start Year | 2025 |
| Forecast Year | 2026-2035 |
| Start Value | $47.4 Billion |
| Forecast Value | $81.2 Billion |
| CAGR | 5.5% |
The compressed nitrogen segment accounted for 57% share in 2025 and is forecast to grow at a CAGR of 5.3% through 2035. Suppliers benefit from offering both compressed and liquid formats, as each supports different operational requirements. Compressed nitrogen is widely used in routine industrial processes delivered via cylinders, bundles, or bulk systems, while liquid nitrogen is essential for applications requiring rapid and high-intensity cooling and cryogenic performance.
The inserting segment held a 35.1% share in 2025 and is expected to grow at a CAGR of 14.8% from 2026 to 2035. Along with blanketing, purging, and related functions, nitrogen-based solutions are becoming standardized across multiple industries to enhance operational safety, reduce contamination risks, and meet increasingly strict quality and safety standards.
North America Nitrogen Gas Market segment reached USD 11.9 billion in 2025. This growth is supported by a diverse industrial base and mature infrastructure for pipeline distribution and on-site nitrogen generation, alongside rising activity in advanced manufacturing sectors.
Key companies active in the Global Nitrogen Gas Market include Linde PLC, Air Products and Chemicals, Inc., Praxair Technology, Inc., Messer Group, Yingde Gases Group, PARKER HANNIFIN CORP, Gulfcryo, Omega Air, Ellenbarrie Industrial Gases, Universal Industrial Gases, Inc., Southern Industrial Gas, and Axcel Gases. Companies operating in the Global Nitrogen Gas Market are strengthening their market positions through capacity expansion, infrastructure investment, and technology optimization. Many players are focusing on on-site generation solutions and long-term supply agreements to secure stable demand and improve customer retention. Investments in advanced air separation systems are helping reduce operating costs and environmental impact. Strategic partnerships and geographic expansion are used to improve market reach, while portfolio diversification across purity levels and delivery modes allows suppliers to address a broader range of industrial requirements and maintain competitive differentiation.
Table of Contents
Chapter 1 Methodology & Scope
- 1.1 Market scope and definition
- 1.2 Research design
- 1.2.1 Research approach
- 1.2.2 Data collection methods
- 1.3 Data mining sources
- 1.3.1 Global
- 1.3.2 Regional/Country
- 1.4 Base estimates and calculations
- 1.4.1 Base year calculation
- 1.4.2 Key trends for market estimation
- 1.5 Primary research and validation
- 1.5.1 Primary sources
- 1.6 Forecast model
- 1.7 Research assumptions and limitations
Chapter 2 Executive Summary
- 2.1 Industry 360° synopsis
- 2.2 Key market trends
- 2.2.1 Regional
- 2.2.2 Form
- 2.2.3 Application
- 2.2.4 End Use Industry
- 2.3 TAM Analysis, 2026-2035
- 2.4 CXO perspectives: Strategic imperatives
- 2.4.1 Executive decision points
- 2.4.2 Critical success factors
- 2.5 Future Outlook and Strategic Recommendations
Chapter 3 Industry Insights
- 3.1 Industry ecosystem analysis
- 3.1.1 Supplier landscape
- 3.1.2 Profit margin
- 3.1.3 Value addition at each stage
- 3.1.4 Factor affecting the value chain
- 3.1.5 Disruptions
- 3.2 Industry impact forces
- 3.2.1 Growth drivers
- 3.2.1.1 Rising industrial production and manufacturing output
- 3.2.1.2 Growth in food processing and cold-chain logistics
- 3.2.1.3 Expansion of pharma, biotech and semiconductor sectors
- 3.2.2 Industry pitfalls and challenges
- 3.2.2.1 High energy costs for air separation plants
- 3.2.2.2 On-site generation reducing bulk delivery volumes
- 3.2.3 Market opportunities
- 3.2.3.1 Adoption of green, low-carbon nitrogen production
- 3.2.3.2 Emerging market industrialisation and infrastructure
- 3.2.1 Growth drivers
- 3.3 Growth potential analysis
- 3.4 Regulatory landscape
- 3.4.1 North America
- 3.4.2 Europe
- 3.4.3 Asia Pacific
- 3.4.4 Latin America
- 3.4.5 Middle East & Africa
- 3.5 Porter';s analysis
- 3.6 PESTEL analysis
- 3.7 Price trends
- 3.7.1 By region
- 3.7.2 By form
- 3.8 Future market trends
- 3.9 Technology and Innovation landscape
- 3.9.1 Current technological trends
- 3.9.2 Emerging technologies
- 3.10 Patent Landscape
- 3.11 Trade statistics (HS code)
( Note: the trade statistics will be provided for key countries only)
- 3.11.1 Major importing countries
- 3.11.2 Major exporting countries
- 3.12 Sustainability and environmental aspects
- 3.12.1 Sustainable practices
- 3.12.2 Waste reduction strategies
- 3.12.3 Energy efficiency in production
- 3.12.4 Eco-friendly initiatives
- 3.13 Carbon footprint consideration
Chapter 4 Competitive Landscape, 2025
- 4.1 Introduction
- 4.2 Company market share analysis
- 4.2.1 By region
- 4.2.1.1 North America
- 4.2.1.2 Europe
- 4.2.1.3 Asia Pacific
- 4.2.1.4 LATAM
- 4.2.1.5 MEA
- 4.2.1 By region
- 4.3 Company matrix analysis
- 4.4 Competitive analysis of major market players
- 4.5 Competitive positioning matrix
- 4.6 Key developments
- 4.6.1 Mergers & acquisitions
- 4.6.2 Partnerships & collaborations
- 4.6.3 New Product Launches
- 4.6.4 Expansion Plans
Chapter 5 Market Estimates and Forecast, By Form, 2022-2035 (USD Billion) (Kilo Tons)
- 5.1 Key trends
- 5.2 Compressed gas
- 5.2.1 High-pressure cylinders
- 5.2.2 Bulk / tube trailers
- 5.2.3 On-site generated compressed nitrogen
- 5.3 Liquid nitrogen gas
- 5.3.1 Bulk storage tanks
- 5.3.2 Dewars / portable containers
- 5.3.3 On-site cryogenic plants
Chapter 6 Market Estimates and Forecast, By Application, 2022-2035 (USD Billion) (Kilo Tons)
- 6.1 Key trends
- 6.2 Inerting
- 6.2.1 Reactor and vessel inerting
- 6.2.2 Storage tank inerting
- 6.2.3 Pipeline inerting
- 6.3 Blanketing
- 6.3.1 Food and beverage headspace blanketing
- 6.3.2 Chemical and solvent tank blanketing
- 6.3.3 Oil and fuel storage blanketing
- 6.4 Welding & cutting
- 6.4.1 Metal welding shielding gas blends
- 6.4.2 Laser cutting and plasma cutting support
- 6.4.3 Heat treatment and brazing atmospheres
- 6.5 Purging
- 6.5.1 Pipeline and process line purging
- 6.5.2 Start-up and shutdown purging of equipment
- 6.5.3 Purging for maintenance and safety operations
- 6.6 Others
Chapter 7 Market Estimates and Forecast, By End Use Industry, 2022-2035 (USD Billion) (Kilo Tons)
- 7.1 Key trends
- 7.2 Cosmetics
- 7.3 Food
- 7.4 Automotive
- 7.5 Pharmaceutical
- 7.6 Others
Chapter 8 Market Estimates and Forecast, By Region, 2022-2035 (USD Billion) (Kilo Tons)
- 8.1 Key trends
- 8.2 North America
- 8.2.1 U.S.
- 8.2.2 Canada
- 8.3 Europe
- 8.3.1 Germany
- 8.3.2 UK
- 8.3.3 France
- 8.3.4 Spain
- 8.3.5 Italy
- 8.3.6 Rest of Europe
- 8.4 Asia Pacific
- 8.4.1 China
- 8.4.2 India
- 8.4.3 Japan
- 8.4.4 Australia
- 8.4.5 South Korea
- 8.4.6 Rest of Asia Pacific
- 8.5 Latin America
- 8.5.1 Brazil
- 8.5.2 Mexico
- 8.5.3 Argentina
- 8.5.4 Rest of Latin America
- 8.6 Middle East and Africa
- 8.6.1 Saudi Arabia
- 8.6.2 South Africa
- 8.6.3 UAE
- 8.6.4 Rest of Middle East and Africa
Chapter 9 Company Profiles
- 9.1 Air Products and Chemicals, Inc.
- 9.2 Axcel Gases
- 9.3 Ellenbarrie industrial Gases.
- 9.4 Gulfcryo
- 9.5 Linde PLC
- 9.6 Messer Group
- 9.7 Omega Air
- 9.8 PARKER HANNIFIN CORP
- 9.9 Praxair Technology, Inc.
- 9.10 Southern Industrial Gas
- 9.11 Universal Industrial Gases, Inc.
- 9.12 Yingde Gases Group


