


 |
市场调查报告书
商品编码
1928929
低速车辆市场机会、成长要素、产业趋势分析及2026年至2035年预测Low Speed Vehicle Market Opportunity, Growth Drivers, Industry Trend Analysis, and Forecast 2026 - 2035 |
||||||
全球低速车辆市场预计到 2025 年将达到 104 亿美元,到 2035 年将达到 218 亿美元,年复合成长率为 7.8%。
随着世界都市化,交通拥堵、空气污染和噪音污染日益严重,对永续、高效的替代交通途径的需求也日益迫切。低速车辆(LSV)正逐渐成为人口密集都市区、封闭式社区、度假村、校园和工业设施等短途出行的实用解决方案。这些车辆采用电力或替代燃料驱动,排放气体极低,有助于改善空气质量,减少对环境的影响。其紧凑的设计和限速使其在拥堵环境中安全灵活。电动车电池技术的进步(例如,更高的能量密度、更快的充电速度和更长的电池寿命)显着提升了低速车辆的效率和吸引力。这些改进降低了营运成本,提高了性能,从而推动了个人交通、商业物流和工业应用领域对低速车辆的需求。儘管新冠疫情对市场产生了复杂的影响,但全球对低排放、经济高效的交通解决方案的需求仍在持续成长。
| 市场覆盖范围 | |
|---|---|
| 开始年份 | 2025 |
| 预测年份 | 2026-2035 |
| 起始值 | 104亿美元 |
| 预测金额 | 218亿美元 |
| 复合年增长率 | 7.8% |
2025年,工业多用途车辆细分市场占43%的市场份额,预计从2026年到2035年将以8.9%的复合年增长率成长。工业低速车辆(LSV)因其坚固耐用的设计、较长的运作週期以及1500至2500磅的有效载荷能力,在製造业、建筑业、物流业和其他商业应用中至关重要。
预计到2025年,内燃机(ICE)汽车市占率将达到61%,并在2035年之前以7.1%的复合年增长率成长。内燃机低速商用车(ICE LSV)凭藉其续航里程优势、便捷的运作以及对特定应用的适用性,仍占有重要的市场份额。这类车辆通常配备3至10马力的发动机,并搭载自动变速箱或无段变速箱(CVT)。
2025 年,美国低速车辆市场价值将达到 38 亿美元。需求成长的驱动因素包括封闭式社区、休閒设施、校园和工业设施中低速车辆的日益普及,以及允许低速车辆在某些公共道路上行驶的法规,还有物流和物料搬运作业中电气化程度的提高。
目录
第一章调查方法和范围
第二章执行摘要
第三章业界考察
- 生态系分析
- 供应商情况
- 原物料供应商
- 零件供应商
- 製造商
- 技术提供者
- 分销管道
- 最终用途
- 成本结构
- 利润率
- 每个阶段的附加价值
- 垂直整合趋势
- 颠覆者
- 供应商情况
- 影响因素
- 司机
- 封闭/管制区域内的城市交通
- 拓展旅游、饭店和休閒产业的业务
- 电气化和永续性要求
- 降低营运成本
- 产业潜在风险与挑战
- 范围和性能限制
- 道路通行限制和监管不一致
- 市场机会
- 用锂离子电池取代铅酸电池
- 具备互联/远端资讯处理功能的低速车队
- 可客製化模组化实用车身
- 住宅高级生活低速车 (LSV)
- 司机
- 技术趋势与创新生态系统
- 目前技术
- 新兴技术
- 成长潜力分析
- 监管环境
- 北美洲
- 美国国家公路交通安全管理局低速车辆(LSV)标准(FMVSS 500)
- 美国各州有关合法上路低速车辆(LSV)的法规
- 加拿大运输部轻型商用车法规
- 欧洲
- 欧盟四轮轻型车辆类别 L6e/L7e
- 联合国欧洲经济委员会(UNECE)车辆安全法规
- 欧盟电池法规
- 欧盟报废车辆指令
- 亚太地区
- 中国新能源车与低速车GB标准
- 印度电动车的CMVR法规
- 国土运输省微型交通工具管理条例
- 拉丁美洲
- 巴西 CONTRAN 标准
- 阿根廷 IRAM 标准
- 墨西哥NOM车辆标准
- 中东和非洲
- 沙乌地阿拉伯 SASO 标准
- 阿联酋证券及市场管理局 (ESMA) 法规
- 墨西哥湾沿岸地区GSO电动车标准
- 南非SANS法规
- 北美洲
- 波特分析
- PESTEL 分析
- 价格趋势
- 按地区
- 副产品
- 专利分析
- 生产统计
- 生产基地
- 消费基础
- 出口和进口
- 永续性和环境方面
- 永续实践
- 减少废弃物策略
- 生产中的能源效率
- 环保倡议
- 碳足迹考量
- 车辆架构和平台策略
- 底盘和滑板平台
- 模组化车身与实用附件策略
- 跨应用程式的平台重复使用
- OEM厂商与本地组装
- 本地组装vs. 品牌OEM厂商
- 白牌/自有品牌生产
- CKD/SKD组装趋势
- 车队所有权和采购行为分析
- 车队买家与个人买家
- 购买、租赁与车队管理模式
- 更新周期和运转率
- 低速车辆可行性及实施评估
- 总拥有成本 (TCO) 基准
- 电池、充电系统和动力传动系统实用性
- 道路通行审批和合规的经济学
- 应用层级的投资收益报酬率 (ROI) 与投资回收期
- 基础设施发展现状与营运风险
- 分销和市场进入模式
第四章 竞争情势
- 介绍
- 公司市占率分析
- 北美洲
- 欧洲
- 亚太地区
- 拉丁美洲
- 中东和非洲
- 竞争定位矩阵
- 战略展望矩阵
- 重大进展
- 併购
- 伙伴关係与合作
- 新产品发布
- 企业扩张计画和资金筹措
第五章 依车辆类型分類的市场估计与预测,2022-2035年
- 高尔夫球车
- 商用多用途车辆
- 工业多用途车辆
- 个人代步车
6. 2022-2035年按推进方式分類的市场估计与预测
- 内燃机(ICE)
- 电的
第七章 按产量分類的市场估计与预测,2022-2035年
- 大于15千瓦
- 6-15kW
- <15kW
第八章 依速度等级分類的市场估算与预测,2022-2035年
- 时速15英里或更低
- 每小时 15-25 英里
- 超过25英里/小时
第九章 按应用领域分類的市场估算与预测,2022-2035年
- 高尔夫球场
- 饭店和度假村
- 飞机场
- 工业设施
- 其他的
第十章 2022-2035年各地区市场估计与预测
- 北美洲
- 我们
- 加拿大
- 欧洲
- 英国
- 德国
- 法国
- 义大利
- 西班牙
- 比利时
- 荷兰
- 瑞典
- 俄罗斯
- 亚太地区
- 中国
- 印度
- 日本
- 澳洲
- 新加坡
- 韩国
- 越南
- 印尼
- 拉丁美洲
- 巴西
- 墨西哥
- 阿根廷
- 中东和非洲
- 南非
- 沙乌地阿拉伯
- 阿拉伯聯合大公国
第十一章 公司简介
- 世界玩家
- Columbia Vehicle
- Deere &Company
- Garia
- ICON Electric Vehicles
- Kandi Technologies
- KUBOTA
- Polaris GEM
- Star EV
- Textron
- The Toro Company
- Tomberlin
- Yamaha Motor
- 区域玩家
- American Landmaster
- Bradshaw EV
- Moto Electric Vehicles
- Motrec International
- Suzhou Eagle Electric Vehicle Manufacturing
- EVolution Electric Vehicles
- Melex
- Bintelli
- 新兴企业
- Stealth
- Tropos Motors
- Marshell
- Durable EV
- Eco Vehicle brands
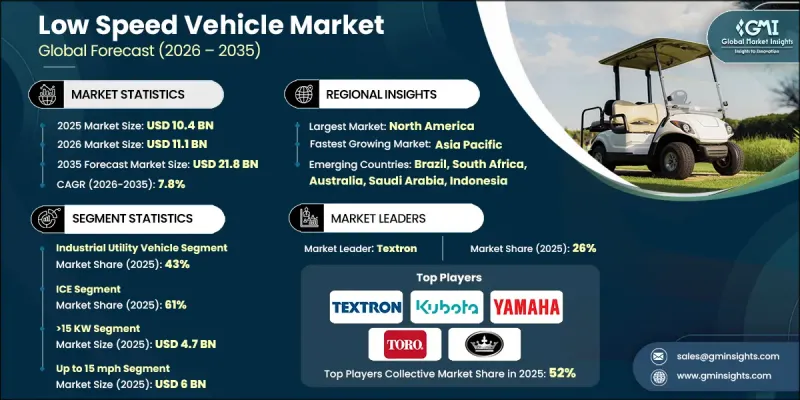
The Global Low Speed Vehicle Market was valued at USD 10.4 billion in 2025 and is estimated to grow at a CAGR of 7.8% to reach USD 21.8 billion by 2035.
Rising urbanization worldwide is intensifying traffic congestion, air pollution, and noise, creating an urgent demand for sustainable, efficient transportation alternatives. LSVs are emerging as a practical solution for short-distance travel in densely populated urban areas, gated communities, resorts, campuses, and industrial facilities. These vehicles, powered by electricity or alternative fuels, produce minimal emissions, supporting cleaner air and reduced environmental impact. Their compact design and speed limitations make them safe and maneuverable in crowded settings. Advances in EV battery technology, including higher energy density, faster charging, and longer lifecycle, have significantly increased LSV efficiency and appeal. These improvements lower operating costs and enhance performance, making LSVs attractive for personal mobility, commercial logistics, and industrial applications. While the COVID-19 pandemic created mixed market effects, demand for low-emission and cost-effective transportation solutions continues to grow globally.
| Market Scope | |
|---|---|
| Start Year | 2025 |
| Forecast Year | 2026-2035 |
| Start Value | $10.4 Billion |
| Forecast Value | $21.8 Billion |
| CAGR | 7.8% |
The industrial utility vehicle segment held a 43% share in 2025 and is projected to grow at a CAGR of 8.9% from 2026 to 2035. Industrial LSVs are essential in manufacturing, construction, logistics, and other commercial applications due to their rugged design, extended duty cycles, and payload capacities of 1,500-2,500 lbs.
The internal Combustion Engine (ICE) vehicles segment held a 61% share in 2025, expected to grow at a CAGR of 7.1% through 2035. ICE LSVs retain a significant market presence because of operational range advantages, ease of refueling, and suitability for specific applications, typically powered by 3-10 horsepower engines with automated or continuously variable transmissions.
United States Low Speed Vehicle Market generated USD 3.8 billion in 2025. The demand is driven by widespread adoption in gated communities, recreational spaces, campuses, and industrial facilities, supported by regulations permitting LSVs on select public roads and increasing electrification efforts in logistics and materials handling operations.
Key players in the Global Low Speed Vehicle Market include Bradshaw EV, Columbia Vehicle, Polaris GEM, EVolution Electric Vehicles, Yamaha Motor, Textron, Deere & Company, Star EV, The Toro Company, and KUBOTA. Companies in the Global Low Speed Vehicle Market are strengthening their positions through continuous innovation in battery technology, enhancing vehicle efficiency, and extending lifecycle performance. Manufacturers are expanding product lines to target industrial, commercial, and personal mobility sectors. Strategic partnerships, acquisitions, and collaborations enable faster market penetration and global reach. Firms are also investing in digital marketing, e-commerce channels, and localized distribution to increase brand visibility. Electrification initiatives, after-sales support, and customized solutions for logistics and gated communities further solidify market foothold and long-term competitiveness.
Table of Contents
Chapter 1 Methodology & Scope
- 1.1 Market scope and definition
- 1.2 Research design
- 1.2.1 Research approach
- 1.2.2 Data collection methods
- 1.3 Data mining sources
- 1.3.1 Global
- 1.3.2 Regional/Country
- 1.4 Base estimates and calculations
- 1.4.1 Base year calculation
- 1.4.2 Key trends for market estimation
- 1.5 Primary research and validation
- 1.5.1 Primary sources
- 1.6 Forecast model
- 1.7 Research assumptions and limitations
Chapter 2 Executive Summary
- 2.1 Industry 3600 synopsis
- 2.2 Key market trends
- 2.2.1 Regional
- 2.2.2 Vehicle
- 2.2.3 Propulsion
- 2.2.4 Power Output
- 2.2.5 Speed Class
- 2.2.6 Application
- 2.3 TAM Analysis, 2026-2035
- 2.4 CXO perspectives: Strategic imperatives
- 2.4.1 Key decision points for industry executives
- 2.4.2 Critical success factors for market players
- 2.5 Future outlook and strategic recommendations
Chapter 3 Industry Insights
- 3.1 Industry ecosystem analysis
- 3.1.1 Supplier landscape
- 3.1.1.1 Raw material suppliers
- 3.1.1.2 Component suppliers
- 3.1.1.3 Manufacturers
- 3.1.1.4 Technology providers
- 3.1.1.5 Distribution channel
- 3.1.1.6 End Use
- 3.1.2 Cost structure
- 3.1.3 Profit margin
- 3.1.4 Value addition at each stage
- 3.1.5 Vertical integration trends
- 3.1.6 Disruptors
- 3.1.1 Supplier landscape
- 3.2 Impact on forces
- 3.2.1 Growth drivers
- 3.2.1.1 Urban mobility inside gated/controlled areas
- 3.2.1.2 Tourism, hospitality & leisure expansion
- 3.2.1.3 Electrification push & sustainability mandates
- 3.2.1.4 Operational cost savings
- 3.2.2 Industry pitfalls & challenges
- 3.2.2.1 Range & performance limitations
- 3.2.2.2 Limited road access & regulatory inconsistencies
- 3.2.3 Market opportunities
- 3.2.3.1 Lithium-ion replacing lead-acid
- 3.2.3.2 Connected / telematics-enabled LSV fleets
- 3.2.3.3 Customization & modular utility bodies
- 3.2.3.4 Premium & lifestyle LSVs for residential use
- 3.2.1 Growth drivers
- 3.3 Technology trends & innovation ecosystem
- 3.3.1 Current technologies
- 3.3.2 Emerging technologies
- 3.4 Growth potential analysis
- 3.5 Regulatory landscape
- 3.5.1 North America
- 3.5.1.1 U.S. NHTSA Low-Speed Vehicle (LSV) Standards (FMVSS 500)
- 3.5.1.2 U.S. State-Level Street-Legal LSV Rules
- 3.5.1.3 Canada Transport Canada LSV Regulations
- 3.5.2 Europe
- 3.5.2.1 EU Quadricycle Category L6e / L7e
- 3.5.2.2 UNECE Vehicle Safety Regulations
- 3.5.2.3 EU Battery Regulation
- 3.5.2.4 EU End-of-Life Vehicle Directive
- 3.5.3 Asia-Pacific
- 3.5.3.1 China GB Standards for NEVs and LSVs
- 3.5.3.2 India CMVR Rules for Electric Vehicles
- 3.5.3.3 Japan MLIT Micro-Mobility Regulations
- 3.5.4 Latin America
- 3.5.4.1 Brazil CONTRAN Standards
- 3.5.4.2 Argentina IRAM Standards
- 3.5.4.3 Mexico NOM Vehicle Standards
- 3.5.5 Middle East & Africa
- 3.5.5.1 Saudi Arabia SASO Standards
- 3.5.5.2 UAE ESMA Regulations
- 3.5.5.3 GSO Gulf Standards for Electric Vehicles
- 3.5.5.4 South Africa SANS Regulations
- 3.5.1 North America
- 3.6 Porter';s analysis
- 3.7 PESTEL analysis
- 3.8 Price trends
- 3.8.1 By region
- 3.8.2 By product
- 3.9 Patent analysis
- 3.10 Production statistics
- 3.10.1 Production hubs
- 3.10.2 Consumption hubs
- 3.10.3 Export and import
- 3.11 Sustainability and environmental aspects
- 3.11.1 Sustainable practices
- 3.11.2 Waste reduction strategies
- 3.11.3 Energy efficiency in production
- 3.11.4 Eco-friendly initiatives
- 3.11.5 Carbon footprint considerations
- 3.12 Vehicle Architecture & Platform Strategy
- 3.12.1 Chassis & skateboard platforms
- 3.12.2 Modular body & utility attachment strategy
- 3.12.3 Platform reuse across applications
- 3.13 OEM vs Regional Assembler Landscape
- 3.13.1 Local assemblers vs branded OEMs
- 3.13.2 White-label / private-label manufacturing
- 3.13.3 CKD/SKD assembly trends
- 3.14 Fleet Ownership & Buying Behavior Analysis
- 3.14.1 Fleet buyers vs individual buyers
- 3.14.2 Purchase vs lease vs managed fleet models
- 3.14.3 Replacement cycles and utilization rates
- 3.15 Feasibility & adoption of low-speed vehicles assessment
- 3.15.1 Total Cost of Ownership (TCO) benchmarking
- 3.15.2 Battery, charging & powertrain viability
- 3.15.3 Street-legality & compliance economics
- 3.15.4 Application-level ROI & payback
- 3.15.5 Infrastructure readiness & operating risk
- 3.16 Distribution & Go-To-Market Models
Chapter 4 Competitive Landscape, 2025
- 4.1 Introduction
- 4.2 Company market share analysis
- 4.2.1 North America
- 4.2.2 Europe
- 4.2.3 Asia-Pacific
- 4.2.4 Latin America
- 4.2.5 Middle East & Africa
- 4.3 Competitive positioning matrix
- 4.4 Strategic outlook matrix
- 4.5 Key developments
- 4.5.1 Mergers & acquisitions
- 4.5.2 Partnerships & collaborations
- 4.5.3 New product launches
- 4.5.4 Expansion plans and funding
Chapter 5 Market Estimates & Forecast, By Vehicle, 2022 - 2035 ($Bn, Units)
- 5.1 Key trends
- 5.2 Golf Cart
- 5.3 Commercial utility vehicle
- 5.4 Industrial utility vehicle
- 5.5 Personal mobility vehicle
Chapter 6 Market Estimates & Forecast, By Propulsion, 2022 - 2035 ($Bn, units)
- 6.1 Key trends
- 6.2 ICE
- 6.3 Electric
Chapter 7 Market Estimates & Forecast, By Power Output, 2022 - 2035 ($Bn, Units)
- 7.1 Key trends
- 7.2 >15 KW
- 7.3 6-15KW
- 7.4 <15KW
Chapter 8 Market Estimates & Forecast, By Speed Class, 2022 - 2035 ($Bn, Units)
- 8.1 Key trends
- 8.2 Up to 15 mph
- 8.3 15-25 mph
- 8.4 Above 25 mph
Chapter 9 Market Estimates & Forecast, By Application, 2022 - 2035 ($Bn, Units)
- 9.1 Key trends
- 9.2 Golf courses
- 9.3 Hotels & resorts
- 9.4 Airports
- 9.5 Industrial facilities
- 9.6 Others
Chapter 10 Market Estimates & Forecast, By Region, 2022 - 2035 ($Bn, Units)
- 10.1 North America
- 10.1.1 US
- 10.1.2 Canada
- 10.2 Europe
- 10.2.1 UK
- 10.2.2 Germany
- 10.2.3 France
- 10.2.4 Italy
- 10.2.5 Spain
- 10.2.6 Belgium
- 10.2.7 Netherlands
- 10.2.8 Sweden
- 10.2.9 Russia
- 10.3 Asia Pacific
- 10.3.1 China
- 10.3.2 India
- 10.3.3 Japan
- 10.3.4 Australia
- 10.3.5 Singapore
- 10.3.6 South Korea
- 10.3.7 Vietnam
- 10.3.8 Indonesia
- 10.4 Latin America
- 10.4.1 Brazil
- 10.4.2 Mexico
- 10.4.3 Argentina
- 10.5 MEA
- 10.5.1 South Africa
- 10.5.2 Saudi Arabia
- 10.5.3 UAE
Chapter 11 Company Profiles
- 11.1 Global players
- 11.1.1 Columbia Vehicle
- 11.1.2 Deere & Company
- 11.1.3 Garia
- 11.1.4 ICON Electric Vehicles
- 11.1.5 Kandi Technologies
- 11.1.6 KUBOTA
- 11.1.7 Polaris GEM
- 11.1.8 Star EV
- 11.1.9 Textron
- 11.1.10 The Toro Company
- 11.1.11 Tomberlin
- 11.1.12 Yamaha Motor
- 11.2 Regional players
- 11.2.1 American Landmaster
- 11.2.2 Bradshaw EV
- 11.2.3 Moto Electric Vehicles
- 11.2.4 Motrec International
- 11.2.5 Suzhou Eagle Electric Vehicle Manufacturing
- 11.2.6 EVolution Electric Vehicles
- 11.2.7 Melex
- 11.2.8 Bintelli
- 11.3 Emerging players
- 11.3.1 Stealth
- 11.3.2 Tropos Motors
- 11.3.3 Marshell
- 11.3.4 Durable EV
- 11.3.5 Eco Vehicle brands
 2026年全球低速车辆市场报告
 低速车辆市场:按推进系统、车辆类型、应用和销售管道的全球市场预测,2026-2032年
 低速车辆市场规模、份额、成长及全球产业分析:按类型、应用和地区分類的洞察,2026-2034 年预测全球低速车辆市场规模、份额、趋势和成长分析报告(2026-2034年)
 低速车辆市场-全球产业规模、份额、趋势、机会与预测:按推进系统、车辆类型、应用、地区和竞争格局划分,2021-2031年低速电动汽车电池市场:按化学成分、车辆类型、容量范围、销售管道、应用和最终用户划分 - 全球预测 2026-2032
 低速车辆市场规模、份额和成长分析(按车辆类型、功率输出、电池类型、应用、推进方式、类别和地区划分)-2026-2033年产业预测
 L5级电动车市场:按类型、最高速度、马达功率、总车辆重量(GVW)、应用、国家及地区划分-全球产业分析、市场规模、市场份额及2025-2032年预测
 低速卡车市场(按推进方式和地区划分)
 电动 L5 车辆市场 - 马达容量:小于 4 kW、4.1 kW 至 7.5 kW、7.6 kW 至 10 kW 和大于 10 kW;最高速度 - 全球产业分析、规模、份额、成长、趋势和预测,2025 年至 2035 年