


 |
市场调查报告书
商品编码
1928994
取放设备市场机会、成长要素、产业趋势分析及预测(2026年至2035年)Pick and Place Machine Market Opportunity, Growth Drivers, Industry Trend Analysis, and Forecast 2026 - 2035 |
||||||
全球取放设备市场预计到 2025 年将达到 28 亿美元,到 2035 年将达到 46 亿美元,年复合成长率为 4.9%。
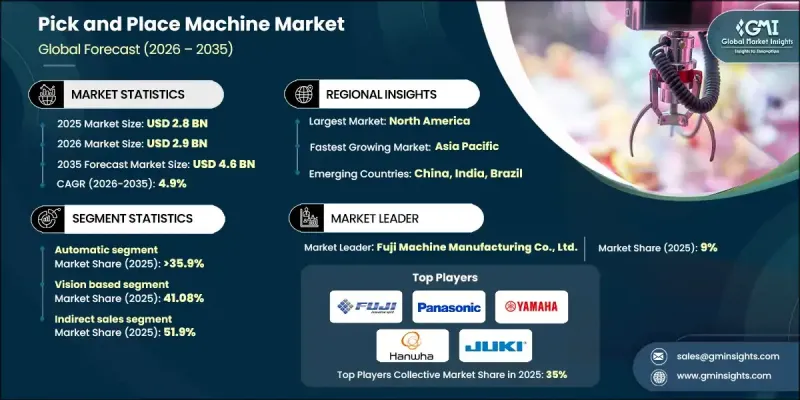
市场扩张的驱动力在于对高速、高精度表面黏着技术(SMT) 贴片系统日益增长的需求,而这些系统对于现代电子製造至关重要。对更高效率、精度和稳定品质的不断提升的需求正在推动行业整合,主要企业透过併购竞争对手来扩展自身能力。这种整合带来了更丰富的产品系列、更高的研发投入以及更强大的全球市场地位。传统的手动贴片机和半自动贴片机越来越难以满足小型化电子产品(尤其是在 5G、汽车和电动车领域)对精度和速度的要求。采用节能伺服马达和热稳定性材料的全自动系统可降低运作过程中的功率损耗,并符合永续的高科技製造实务。采用这些先进设备能够帮助製造商在保持精度和运作效率的同时,实现大批量生产目标。
| 市场覆盖范围 | |
|---|---|
| 开始年份 | 2025 |
| 预测年份 | 2026-2035 |
| 起始值 | 28亿美元 |
| 预测金额 | 46亿美元 |
| 复合年增长率 | 4.9% |
预计到2025年,自动化贴片设备将占据35.9%的市场份额,并创造10亿美元的收入。自动化贴片机正逐渐成为主流,因为它们能够提供现代电子製造所需的亚微米级贴片精度、高速运作和扩充性。这些系统对于工业4.0的普及至关重要,能够与机器人、智慧工厂网路和预测性维护平台无缝整合。智慧型手机、电动车(EV)以及汽车和航太产业电控系统(ECU)产量的不断增长,进一步推动了对高性能自动化贴片系统的需求。它们能够减少人为错误、优化生产效率并确保产品品质的稳定性,使其成为大规模生产不可或缺的工具。
到2025年,基于视觉的取放系统将占据41.08%的市场份额,市场规模将达到12亿美元。视觉系统能够对小型、高密度零件进行即时光学辨识、对准和缺陷检测,从而确保极高的产量比率。这项技术对于放置小间距零件和处理复杂组件至关重要,并能达到极高的精确度。检测和放置的同步整合能够减少返工和废弃物,从而提高整体生产效率。在航太、医疗设备组装和汽车电子等行业,製造商越来越依赖基于视觉的系统来满足严格的品质标准、缩短生产週期并降低错误率。
截至2025年,美国贴片设备市场占据了全球84.5%的市场。这一主导地位得益于先进机器人技术、人工智慧组装系统和高精度製造技术的早期应用。汽车和航太产业的强劲需求推动了市场成长,在这些产业中,贴片设备对于组装复杂的电控系统、感测器和高密度基板至关重要。此外,对运作环境和极高精度要求的医疗设备产业也促进了市场成长。在北美,完善的电子製造生态系统、高额的研发投入以及智慧工厂理念的普及,持续推动市场发展。
目录
第一章调查方法和范围
第二章执行摘要
第三章业界考察
- 生态系分析
- 供应商情况
- 利润率
- 每个阶段的附加价值
- 影响价值链的因素
- 产业影响因素
- 司机
- 电子元件小型化
- 向工业4.0和智慧工厂转型
- 电动汽车电子设备的需求不断增长
- 产业潜在风险与挑战
- 高初始投资
- 高混合小批量生产中的程式设计复杂度
- 机会
- 人工智慧驱动的预测性维护
- 5G和卫星通讯的扩展
- 司机
- 成长潜力分析
- 未来市场趋势
- 科技与创新趋势
- 当前技术趋势
- 新兴技术
- 价格趋势
- 按地区
- 按类型
- 监管环境
- 标准和合规要求
- 区域法规结构
- 认证标准
- 波特分析
- PESTEL 分析
第四章 竞争情势
- 介绍
- 公司市占率分析
- 按地区
- 企业矩阵分析
- 主要市场公司的竞争分析
- 竞争定位矩阵
- 重大进展
- 併购
- 伙伴关係与合作
- 新产品发布
- 扩张计划
第五章 按类型分類的市场估算与预测,2022-2035年
- 手动输入
- 半自动
- 自动的
第六章 按技术分類的市场估计与预测,2022-2035年
- 基于视觉
- 部队基地
- 雷射法
- 杂交种
第七章 依产能分類的市场估计与预测,2022-2035年
- 主要趋势
- 每小时 10,000 杯或更少
- 10,000~20,000 CPH
- 每小时 20,000 杯或更多
第八章 按应用领域分類的市场估算与预测,2022-2035年
- 家用电子电器
- 车
- 包装产业
- 製药
- 后勤
- 其他的
9. 2022-2035年按分销管道分類的市场估算与预测
- 直接地
- 间接
第十章 2022-2035年各地区市场估计与预测
- 北美洲
- 我们
- 加拿大
- 欧洲
- 德国
- 英国
- 法国
- 义大利
- 西班牙
- 亚太地区
- 中国
- 日本
- 印度
- 澳洲
- 韩国
- 拉丁美洲
- 巴西
- 墨西哥
- 阿根廷
- 中东和非洲
- 南非
- 沙乌地阿拉伯
- 阿拉伯聯合大公国
第十一章 公司简介
- ASM Assembly Systems GmbH &Co. KG
- Fuji Machine Manufacturing Co., Ltd.
- Juki Corporation
- Panasonic Corporation
- Yamaha Motor Co., Ltd.
- Hanwha Corporation
- Mycronic AB
- Nordson Corporation
- Hanwha Techwin
- ASM Pacific Technology Ltd.
- Universal Instruments Corporation
- Europlacer Group
- Essemtec AG
- Viscom AG
- Speedline Technologies, Inc.
The Global Pick and Place Machine Market was valued at USD 2.8 billion in 2025 and is estimated to grow at a CAGR of 4.9% to reach USD 4.6 billion by 2035.
The market's expansion is driven by the increasing demand for high-speed, precise surface-mount technology (SMT) placement systems, which are essential for modern electronics manufacturing. Efficiency gains, accuracy, and the need for consistent quality have encouraged industry consolidation, as leading companies merge or acquire competitors to expand their capabilities. This consolidation has resulted in broader product portfolios, increased R&D investments, and stronger global market presence. Traditional manual component placement or semi-automatic machines are increasingly unable to meet the precision and speed requirements of miniaturized electronics, especially in the 5G, automotive, and EV sectors. Fully automated systems with energy-efficient servo motors and thermally stable materials offer reduced operational power loss and align with sustainable, high-tech manufacturing practices. Adoption of these advanced machines allows manufacturers to meet high-volume production targets while maintaining precision and operational efficiency.
| Market Scope | |
|---|---|
| Start Year | 2025 |
| Forecast Year | 2026-2035 |
| Start Value | $2.8 Billion |
| Forecast Value | $4.6 Billion |
| CAGR | 4.9% |
The automatic pick and place segment accounted for 35.9% share in 2025, generating USD 1 billion. Automatic machines dominate because they provide sub-micron placement accuracy, high-speed operation, and scalability required by modern electronics manufacturing. These systems are integral to Industry 4.0 implementations, enabling seamless integration with robotics, smart factory networks, and predictive maintenance platforms. The increasing production of smartphones, EVs, and electronic control units in the automotive and aerospace industries further drives the demand for high-performance automated placement systems. Their ability to reduce human error, optimize throughput, and ensure consistent quality makes them essential for high-volume manufacturing.
Vision-based pick and place systems held 41.08% share, generating USD 1.2 billion in 2025. Vision systems provide real-time optical recognition, alignment, and defect detection for small, high-density components, ensuring extremely high yield rates. This technology is critical for placing fine-pitch components and handling complex assemblies with exceptional accuracy. Its ability to integrate inspection and placement simultaneously reduces rework and waste, improving overall production efficiency. Manufacturers increasingly rely on vision-based systems to achieve faster cycle times, lower error rates, and compliance with stringent quality standards required in aerospace, medical device assembly, and automotive electronics.
U.S. Pick and Place Machine Market held 84.5% share in 2025. This dominance is fueled by early adoption of advanced robotics, AI-integrated assembly systems, and high-precision manufacturing technologies. Strong demand comes from the automotive and aerospace sectors, where pick and place machines are essential for assembling complex electronic control units, sensors, and high-density boards. Additionally, the medical device segment is contributing to growth, requiring specialized machines capable of cleanroom operation and extreme precision. North America's well-established electronics manufacturing ecosystem, combined with high R&D investment and adoption of smart factory concepts, continues to propel the market forward.
Major players operating in the Global Pick and Place Machine Market include ASM Pacific Technology Ltd., Yamaha Motor Co., Ltd., ASM Assembly Systems GmbH & Co. KG, Juki Corporation, Panasonic Corporation, Hanwha Techwin, Mycronic AB, Nordson Corporation, Universal Instruments Corporation, Speedline Technologies, Inc., Europlacer Group, Essemtec AG, Viscom AG, Hanwha Corporation, and others. These companies lead through continuous innovation, global expansion, and the development of automated, vision-integrated systems that meet evolving electronics manufacturing needs. Companies in the Pick and Place Machine Market are adopting multiple strategies to strengthen their market position. They focus heavily on mergers and acquisitions to consolidate technological expertise and expand regional reach. Product innovation, including AI-assisted placement, vision-based defect detection, and energy-efficient servo motors, enhances performance and sustainability. Firms invest in Industry 4.0 solutions to integrate machines into smart factories and provide connected, data-driven platforms for predictive maintenance.
Table of Contents
Chapter 1 Methodology and Scope
- 1.1 Market scope and definition
- 1.2 Research design
- 1.2.1 Research approach
- 1.2.2 Data collection methods
- 1.3 Data mining sources
- 1.3.1 Global
- 1.3.2 Regional/Country
- 1.4 Base estimates and calculations
- 1.4.1 Base year calculation
- 1.4.2 Key trends for market estimation
- 1.5 Primary research and validation
- 1.5.1 Primary sources
- 1.6 Forecast model
- 1.7 Research assumptions and limitations
Chapter 2 Executive Summary
- 2.1 Industry 360° synopsis
- 2.2 Key market trends
- 2.2.1 Regional
- 2.2.2 Type
- 2.2.3 Technology
- 2.2.4 Capacity
- 2.2.5 Application
- 2.2.6 Distribution Channel
- 2.3 CXO perspectives: Strategic imperatives
- 2.3.1 Key decision points for industry executives
- 2.3.2 Critical success factors for market players
- 2.4 Future outlook and strategic recommendations
Chapter 3 Industry Insights
- 3.1 Industry ecosystem analysis
- 3.1.1 Supplier landscape
- 3.1.2 Profit margin
- 3.1.3 Value addition at each stage
- 3.1.4 Factor affecting the value chain
- 3.2 Industry impact forces
- 3.2.1 Growth drivers
- 3.2.1.1 Miniaturization of electronic components
- 3.2.1.2 Transition to industry 4.0 and smart factories
- 3.2.1.3 Rise in electric vehicle (EV) electronics
- 3.2.2 Industry pitfalls & challenges
- 3.2.2.1 High initial capital expenditure
- 3.2.2.2 Complexity of programming for high-mix production
- 3.2.3 Opportunities
- 3.2.3.1 Ai-driven predictive maintenance
- 3.2.3.2 Expansion of 5G and satellite communication
- 3.2.1 Growth drivers
- 3.3 Growth potential analysis
- 3.4 Future market trends
- 3.5 Technology and innovation landscape
- 3.5.1 Current technological trends
- 3.5.2 Emerging technologies
- 3.6 Price trends
- 3.6.1 By region
- 3.6.2 By type
- 3.7 Regulatory landscape
- 3.7.1 Standards and compliance requirements
- 3.7.2 Regional regulatory frameworks
- 3.7.3 Certification standards
- 3.8 Porter';s analysis
- 3.9 PESTEL analysis
Chapter 4 Competitive Landscape, 2025
- 4.1 Introduction
- 4.2 Company market share analysis
- 4.2.1 By region
- 4.2.1.1 North America
- 4.2.1.2 Europe
- 4.2.1.3 Asia Pacific
- 4.2.1.4 Latin America
- 4.2.1.5 Middle East and Africa
- 4.2.1 By region
- 4.3 Company matrix analysis
- 4.4 Competitive analysis of major market players
- 4.5 Competitive positioning matrix
- 4.6 Key developments
- 4.6.1 Mergers & acquisitions
- 4.6.2 Partnerships & collaborations
- 4.6.3 New product launches
- 4.6.4 Expansion plans
Chapter 5 Market Estimates and Forecast, By Type, 2022 - 2035 (USD Billion) (Thousand Units)
- 5.1 Key trends
- 5.2 Manual
- 5.3 Semi-automatic
- 5.4 Automatic
Chapter 6 Market Estimates and Forecast, By Technology, 2022 - 2035 (USD Billion) (Thousand Units)
- 6.1 Key trends
- 6.2 Vision based
- 6.3 Force based
- 6.4 Laser based
- 6.5 Hybrid
Chapter 7 Market Estimates and Forecast, By Capacity, 2022 - 2035 (USD Billion) (Thousand Units)
- 7.1 Key trend
- 7.2 Upto 10,000 CPH
- 7.3 10,000-20,000 CPH
- 7.4 Above 20,000 CPH
Chapter 8 Market Estimates and Forecast, By Application, 2022 - 2035 (USD Billion) (Thousand Units)
- 8.1 Key trends
- 8.2 Consumer electronics
- 8.3 Automotive
- 8.4 Packaging industry
- 8.5 Pharmaceutical
- 8.6 Logistics
- 8.7 Others
Chapter 9 Market Estimates and Forecast, By Distribution Channel, 2022 - 2035 (USD Billion) (Thousand Units)
- 9.1 Key trends
- 9.2 Direct
- 9.3 Indirect
Chapter 10 Market Estimates and Forecast, By Region, 2022 - 2035 (USD Billion) (Thousand Units)
- 10.1 Key trends
- 10.2 North America
- 10.2.1 U.S.
- 10.2.2 Canada
- 10.3 Europe
- 10.3.1 Germany
- 10.3.2 UK
- 10.3.3 France
- 10.3.4 Italy
- 10.3.5 Spain
- 10.4 Asia Pacific
- 10.4.1 China
- 10.4.2 Japan
- 10.4.3 India
- 10.4.4 Australia
- 10.4.5 South Korea
- 10.5 Latin America
- 10.5.1 Brazil
- 10.5.2 Mexico
- 10.5.3 Argentina
- 10.6 Middle East and Africa
- 10.6.1 South Africa
- 10.6.2 Saudi Arabia
- 10.6.3 UAE
Chapter 11 Company Profiles
- 11.1 ASM Assembly Systems GmbH & Co. KG
- 11.2 Fuji Machine Manufacturing Co., Ltd.
- 11.3 Juki Corporation
- 11.4 Panasonic Corporation
- 11.5 Yamaha Motor Co., Ltd.
- 11.6 Hanwha Corporation
- 11.7 Mycronic AB
- 11.8 Nordson Corporation
- 11.9 Hanwha Techwin
- 11.10 ASM Pacific Technology Ltd.
- 11.11 Universal Instruments Corporation
- 11.12 Europlacer Group
- 11.13 Essemtec AG
- 11.14 Viscom AG
- 11.15 Speedline Technologies, Inc.
 2026年全球取放设备市场报告
 基于视觉的取放设备市场:按类型、组件、应用和最终用户产业划分 - 全球预测(2026-2032 年)
 全球贴片机市场:2032 年预测 - 按类型、产能、技术、分销管道、应用和地区进行分析
 全球贴片机市场