


 |
市场调查报告书
商品编码
1936501
益生元纤维市场机会、成长要素、产业趋势分析及预测(2026年至2035年)Prebiotic Fibers Market Opportunity, Growth Drivers, Industry Trend Analysis, and Forecast 2026 - 2035 |
||||||
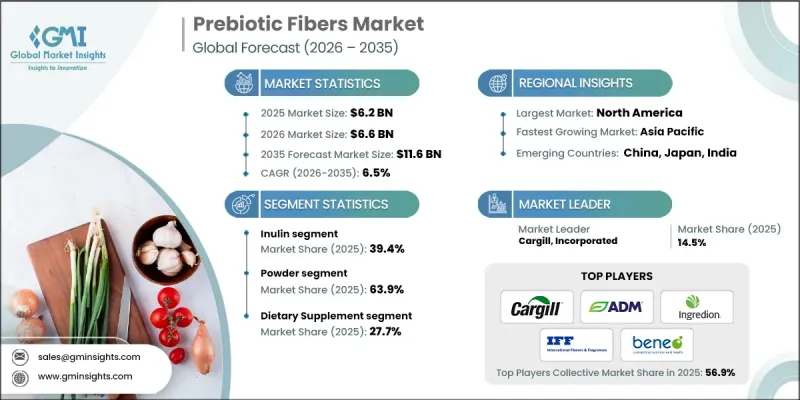
全球益生元纺织品市场预计到 2025 年价值 62 亿美元,到 2035 年达到 116 亿美元,年复合成长率为 6.5%。
益生元纤维已从一种小众补充剂转变为日常食品和饮料中的主流功能性成分。製造商正在开发口味中性、稳定性高的配方,使其适用于添加到乳製品替代品、零食和饮料中,让消费者能够轻鬆地将益生元融入日常生活。个人化营养的兴起进一步塑造了市场格局,促使企业开发针对特定肠道菌丛的益生元混合物,以支持肠道菌丛并顺应数位化健康趋势。益生元纤维不再只是一种功能性添加剂;它正日益被认为是维持消化系统健康的重要成分。洁净标示、植物来源和强化食品的创新正在拓展其应用范围,并推动全球消费者的参与。这种增长得益于健康意识的提高、可支配收入的增加以及支持膳食补充剂和机能性食品普及的法规结构。
| 市场覆盖范围 | |
|---|---|
| 开始年份 | 2025 |
| 预测年份 | 2026-2035 |
| 起始值 | 62亿美元 |
| 预测金额 | 116亿美元 |
| 复合年增长率 | 6.5% |
预计到 2025 年,菊糖市占率将达到 39.4%,到 2035 年将以 7% 的复合年增长率成长。菊糖和寡果醣(FOS) 预计到 2025 年将占益生元纤维市场总量的一半以上,这反映了其广泛的接受度和功能性益处。
2025 年,颗粒剂製剂市占率为 6.7%,价值 4.147 亿美元。由于其精确的剂量控制、缓释特性以及与低水分配方的相容性,这些剂型在点心棒、谷物和临床营养产品中应用广泛,因此备受青睐,并可灵活地融入机能性食品中。
预计到2025年,北美益生元纤维市场规模将达到23亿美元,并在整个预测期内保持持续成长。消费者对肠道菌丛的高度关注、健康饮食习惯的养成以及对植物来源和洁净标示产品的需求,是推动北美市场主导地位的主要因素。膳食补充剂和机能性食品监管的支持,以及婴幼儿营养和强化食品领域的技术创新,正在进一步推动市场扩张。北美市场的成熟度,加上持续的研发活动,使其在益生元纤维的产品创新和消费者接受度方面都占据关键地位。
目录
第一章调查方法和范围
第二章执行摘要
第三章业界考察
- 生态系分析
- 供应商情况
- 利润率
- 每个阶段的附加价值
- 影响价值链的因素
- 中断
- 产业影响因素
- 司机
- 消费者对消化系统健康的日益关注正在推动对益生元纤维成分的需求。
- 人们对机能性食品食品和洁净标示食品的偏好日益增长,正在推动益生元纤维的广泛应用。
- 人们对预防医学的兴趣日益浓厚,导致改善肠道环境的成分每日摄取量增加。
- 产业潜在风险与挑战
- 高剂量引起的胃肠道不适限制了消费者对某些益生元纤维的耐受性。
- 监管定义和健康声明缺乏统一性,给製造商带来不确定性。
- 与传统纤维相比,成本较高使其竞争力下降。
- 市场机会
- 低剂量、高活性益生元的研发消除了抗药性担忧。
- 个人化营养正在催生对标靶益生元纤维解决方案的需求。
- 拓展至动物营养领域,使应用范围不限于人类消费。
- 司机
- 成长潜力分析
- 监管环境
- 北美洲
- 欧洲
- 亚太地区
- 拉丁美洲
- 中东和非洲
- 波特五力分析
- PESTEL 分析
- 价格趋势
- 按地区
- 依产品类型
- 未来市场趋势
- 科技与创新趋势
- 当前技术趋势
- 新兴技术
- 专利状态
- 贸易统计(HS编码)
- 主要进口国
- 主要出口国
- 永续性和环境方面
- 永续努力
- 减少废弃物策略
- 生产中的能源效率
- 环保倡议
- 考虑到碳足迹
第四章 竞争情势
- 介绍
- 公司市占率分析
- 按地区
- 北美洲
- 欧洲
- 亚太地区
- 拉丁美洲
- 中东和非洲
- 按地区
- 企业矩阵分析
- 主要市场公司的竞争分析
- 竞争定位矩阵
- 重大进展
- 併购
- 伙伴关係与合作
- 新产品发布
- 业务拓展计划
第五章 依产品类型分類的市场估算与预测,2022-2035年
- 菊糖
- 寡果醣(FOS)
- 半乳寡糖(GOS)
- 人乳低聚醣(HMO)
- 抗解淀粉
- 木寡糖(XOS)
- 聚葡萄糖
- 乳果糖
- 抗性糊精
- 其他的
第六章 按类型分類的市场估算与预测,2022-2035年
- 粉末
- 液体/糖浆
- 颗粒
- 胶囊/片剂
7. 按最终用户分類的市场估计和预测,2022-2035 年
- 麵包糖果甜点
- 乳製品
- 饮料
- 谷物和点心棒
- 加工食品
- 营养补充品
- 婴幼儿营养食品
- 临床营养
- 製药
- 家禽饲料
- 猪饲料
- 反刍动物饲料
- 水产养殖
- 宠物食品
第八章 2022-2035年各地区市场估算与预测
- 北美洲
- 我们
- 加拿大
- 欧洲
- 德国
- 英国
- 法国
- 西班牙
- 义大利
- 其他欧洲地区
- 亚太地区
- 中国
- 印度
- 日本
- 澳洲
- 韩国
- 亚太其他地区
- 拉丁美洲
- 巴西
- 墨西哥
- 阿根廷
- 其他拉丁美洲地区
- 中东和非洲
- 沙乌地阿拉伯
- 南非
- 阿拉伯聯合大公国
- 其他中东和非洲地区
第九章:公司简介
- Archer Daniels Midland Company
- BENEO GmbH
- Cargill, Incorporated
- Royal FrieslandCampina NV
- Ingredion Incorporated
- International Flavors &Fragrances Inc.(IFF)
- Roquette Freres
- Sensus BV
- Tate &Lyle PLC
- Tereos Group
The Global Prebiotic Fibers Market was valued at USD 6.2 billion in 2025 and is estimated to grow at a CAGR of 6.5% to reach USD 11.6 billion by 2035.
Prebiotic fibers have transitioned from being a niche supplement to a mainstream functional ingredient in everyday food and beverage products. Manufacturers are developing neutral-tasting, stable formulations suitable for integration into dairy alternatives, snack foods, and beverages, allowing consumers to incorporate prebiotics seamlessly into daily routines. The rise of personalized nutrition is further shaping the market, with companies creating targeted prebiotic blends designed to support individual gut microbiomes and align with digital health trends. Prebiotic fibers are no longer just functional additives; they are increasingly recognized as essential components for maintaining digestive wellness. Innovations in clean-label, plant-based, and fortifiable foods are expanding the applications and driving consumer engagement globally. This growth is supported by rising health consciousness, increased disposable income, and regulatory frameworks encouraging dietary supplement and functional food adoption.
| Market Scope | |
|---|---|
| Start Year | 2025 |
| Forecast Year | 2026-2035 |
| Start Value | $6.2 Billion |
| Forecast Value | $11.6 Billion |
| CAGR | 6.5% |
The inulin segment held a 39.4% share in 2025 and is expected to grow at a CAGR of 7% through 2035. Inulin, together with fructooligosaccharides (FOS), represents over half of the total prebiotic fiber market by 2025, reflecting their broad acceptance and functional benefits.
The granular formulations segment accounted for 6.7% share, valued at USD 414.7 million in 2025. These formats are favored for applications in snack bars, cereals, and clinical nutrition products due to their precise dosing capabilities, controlled release properties, and compatibility with low-moisture formulations, enabling versatile integration into functional foods.
North America Prebiotic Fibers Market reached USD 2.3 billion in 2025 and is poised for sustained growth over the forecast period. High consumer awareness about the gut microbiome, health-conscious eating habits, and demand for plant-based and clean-label products underpin this leadership. Regulatory support for dietary supplements and functional foods, along with innovations in baby nutrition and fortified products, further enhances market expansion. The region's maturity, combined with ongoing research and development activities, positions it as a hub for both product innovation and consumer adoption of prebiotic fibers.
Key companies operating in the Global Prebiotic Fibers Market include Archer Daniels Midland Company, Cargill, Incorporated, Royal FrieslandCampina N.V., Tate & Lyle PLC, BENEO GmbH, Ingredion Incorporated, Roquette Freres, International Flavors & Fragrances Inc. (IFF), Sensus BV, and Tereos Group. Companies in the prebiotic fibers market strengthen their market position through several strategic approaches. Product innovation remains central, with firms developing neutral-taste, stable prebiotic formulations for diverse food and beverage applications. Expanding into personalized nutrition solutions allows them to cater to individual gut health needs. Strategic collaborations with food manufacturers, retailers, and healthcare providers enhance distribution reach and brand visibility. Investments in R&D and clinical validation support efficacy claims, building consumer trust. Companies also focus on geographic expansion into emerging markets with growing health awareness. Emphasis on sustainable sourcing and clean-label production practices enhances brand reputation and meets evolving regulatory requirements. Marketing campaigns highlighting digestive wellness benefits further reinforce consumer adoption and loyalty.
Table of Contents
Chapter 1 Methodology & Scope
- 1.1 Research approach
- 1.2 Quality Commitments
- 1.2.1 GMI AI policy & data integrity commitment
- 1.2.1.1 Source consistency protocol
- 1.2.1 GMI AI policy & data integrity commitment
- 1.3 Research Trail & Confidence Scoring
- 1.3.1 Research Trail Components
- 1.3.2 Scoring Components
- 1.4 Data Collection
- 1.4.1 Partial list of primary sources
- 1.5 Data mining sources
- 1.5.1 Paid sources
- 1.5.1.1 Sources, by region
- 1.5.1 Paid sources
- 1.6 Base estimates and calculations
- 1.6.1 Base year calculation for any one approach
- 1.7 Forecast model
- 1.7.1 Quantified market impact analysis
- 1.7.1.1 Mathematical impact of growth parameters on forecast
- 1.7.1 Quantified market impact analysis
- 1.8 Research transparency addendum
- 1.8.1 Source attribution framework
- 1.8.2 Quality assurance metrics
- 1.8.3 Our commitment to trust
Chapter 2 Executive Summary
- 2.1 Industry 360° synopsis
- 2.2 Key market trends
- 2.2.1 Regional
- 2.2.2 Product Type
- 2.2.3 Form
- 2.2.4 End User
- 2.3 TAM Analysis, 2025-2034
- 2.4 CXO perspectives: Strategic imperatives
- 2.4.1 Executive decision points
- 2.4.2 Critical success factors
- 2.5 Future Outlook and Strategic Recommendations
Chapter 3 Industry Insights
- 3.1 Industry ecosystem analysis
- 3.1.1 Supplier landscape
- 3.1.2 Profit margin
- 3.1.3 Value addition at each stage
- 3.1.4 Factor affecting the value chain
- 3.1.5 Disruptions
- 3.2 Industry impact forces
- 3.2.1 Growth drivers
- 3.2.1.1 Increasing consumer focus on digestive wellness is driving demand for prebiotic fiber ingredients.
- 3.2.1.2 Rising preference for functional and clean-label foods supports wider prebiotic fiber incorporation.
- 3.2.1.3 Growing emphasis on preventive healthcare encourages routine consumption of gut-health ingredients.
- 3.2.2 Industry pitfalls and challenges
- 3.2.2.1 Gastrointestinal discomfort at higher doses limits consumer tolerance of certain prebiotic fibers.
- 3.2.2.2 Inconsistent regulatory definitions and health claims create uncertainty for manufacturers.
- 3.2.2.3 Higher costs compared to conventional fibers reduce price competitiveness.
- 3.2.3 Market opportunities
- 3.2.3.1 Development of low-dose, high-efficacy prebiotics addresses tolerance concerns.
- 3.2.3.2 Personalized nutrition creates demand for targeted prebiotic fiber solutions.
- 3.2.3.3 Expansion into animal nutrition broadens applications beyond human consumption.
- 3.2.1 Growth drivers
- 3.3 Growth potential analysis
- 3.4 Regulatory landscape
- 3.4.1 North America
- 3.4.2 Europe
- 3.4.3 Asia Pacific
- 3.4.4 Latin America
- 3.4.5 Middle East & Africa
- 3.5 Porter's analysis
- 3.6 PESTEL analysis
- 3.7 Price trends
- 3.7.1 By region
- 3.7.2 By product type
- 3.8 Future market trends
- 3.9 Technology and Innovation landscape
- 3.9.1 Current technological trends
- 3.9.2 Emerging technologies
- 3.10 Patent Landscape
- 3.11 Trade statistics (HS code)
- 3.11.1 Major importing countries
- 3.11.2 Major exporting countries
- 3.12 Sustainability and environmental aspects
- 3.12.1 Sustainable practices
- 3.12.2 Waste reduction strategies
- 3.12.3 Energy efficiency in production
- 3.12.4 Eco-friendly initiatives
- 3.13 Carbon footprint consideration
Chapter 4 Competitive Landscape, 2025
- 4.1 Introduction
- 4.2 Company market share analysis
- 4.2.1 By region
- 4.2.1.1 North America
- 4.2.1.2 Europe
- 4.2.1.3 Asia Pacific
- 4.2.1.4 LATAM
- 4.2.1.5 MEA
- 4.2.1 By region
- 4.3 Company matrix analysis
- 4.4 Competitive analysis of major market players
- 4.5 Competitive positioning matrix
- 4.6 Key developments
- 4.6.1 Mergers & acquisitions
- 4.6.2 Partnerships & collaborations
- 4.6.3 New Product Launches
- 4.6.4 Expansion Plans
Chapter 5 Market Estimates and Forecast, By Product Type, 2022-2035 (USD Billion) (Kilo Tons)
- 5.1 Key trends
- 5.2 Inulin
- 5.3 Fructooligosaccharides (FOS)
- 5.4 Galactooligosaccharides (GOS)
- 5.5 Human Milk Oligosaccharides (HMOs)
- 5.6 Resistant Starch
- 5.7 Xylooligosaccharides (XOS)
- 5.8 Polydextrose
- 5.9 Lactulose
- 5.10 Resistant Dextrin
- 5.11 Others
Chapter 6 Market Estimates and Forecast, By Form, 2022-2035 (USD Billion) (Kilo Tons)
- 6.1 Key trends
- 6.2 Powder
- 6.3 Liquid/Syrup
- 6.4 Granules
- 6.5 Capsules/Tablets
Chapter 7 Market Estimates and Forecast, By End User, 2022-2035 (USD Billion) (Kilo Tons)
- 7.1 Key trends
- 7.2 Bakery & Confectionery
- 7.3 Dairy Products
- 7.4 Beverages
- 7.5 Cereals & Snack Bars
- 7.6 Processed Foods
- 7.7 Dietary Supplements
- 7.8 Infant Nutrition
- 7.9 Clinical Nutrition
- 7.10 Pharmaceuticals
- 7.11 Poultry Feed
- 7.12 Swine Feed
- 7.13 Ruminant Feed
- 7.14 Aquaculture
- 7.15 Pet Food
Chapter 8 Market Estimates and Forecast, By Region, 2022-2035 (USD Billion) (Kilo Tons)
- 8.1 Key trends
- 8.2 North America
- 8.2.1 U.S.
- 8.2.2 Canada
- 8.3 Europe
- 8.3.1 Germany
- 8.3.2 UK
- 8.3.3 France
- 8.3.4 Spain
- 8.3.5 Italy
- 8.3.6 Rest of Europe
- 8.4 Asia Pacific
- 8.4.1 China
- 8.4.2 India
- 8.4.3 Japan
- 8.4.4 Australia
- 8.4.5 South Korea
- 8.4.6 Rest of Asia Pacific
- 8.5 Latin America
- 8.5.1 Brazil
- 8.5.2 Mexico
- 8.5.3 Argentina
- 8.5.4 Rest of Latin America
- 8.6 Middle East and Africa
- 8.6.1 Saudi Arabia
- 8.6.2 South Africa
- 8.6.3 UAE
- 8.6.4 Rest of Middle East and Africa
Chapter 9 Company Profiles
- 9.1 Archer Daniels Midland Company
- 9.2 BENEO GmbH
- 9.3 Cargill, Incorporated
- 9.4 Royal FrieslandCampina N.V.
- 9.5 Ingredion Incorporated
- 9.6 International Flavors & Fragrances Inc. (IFF)
- 9.7 Roquette Freres
- 9.8 Sensus BV
- 9.9 Tate & Lyle PLC
- 9.10 Tereos Group


