


 |
市场调查报告书
商品编码
1936565
解酒产品市场机会、成长要素、产业趋势分析及2026年至2035年预测Hangover Cure Products Market Opportunity, Growth Drivers, Industry Trend Analysis, and Forecast 2026 - 2035 |
||||||
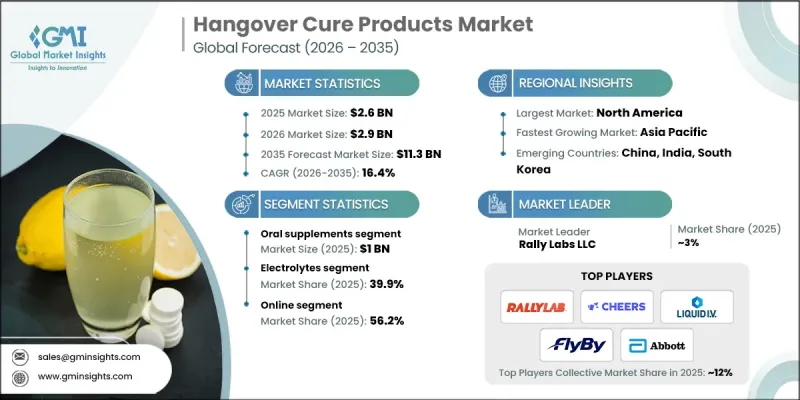
全球解酒产品市场预计到 2025 年价值 26 亿美元,到 2035 年达到 113 亿美元,年复合成长率为 16.4%。
全球酒精消费量的成长,尤其是在年轻人群体中,是推动市场成长的关键因素。社会行为的改变、夜生活参与度的提高以及可支配收入的增加,都促使都市区和半都市区的社交饮酒频率不断上升。人们对酒精消费的文化态度转变以及全球趋势在开发中国家日益增长的影响,进一步扩大了消费群。随着社交饮酒的日益普遍,人们对便利的解酒方案的需求也日益增长。同时,人们对个人健康和保健意识的提高,也促使他们对能够缓解身体不适且不损害长期健康的保健产品产生兴趣。消费者越来越倾向于选择能够预防和帮助復原的方案,以配合他们积极健康的生活方式,这将支撑解酒产品市场在预测期内的持续成长。
| 市场覆盖范围 | |
|---|---|
| 开始年份 | 2025 |
| 预测期 | 2026-2035 |
| 起始值 | 26亿美元 |
| 预测金额 | 113亿美元 |
| 复合年增长率 | 16.4% |
预计到2025年,口服保健品市场规模将达到10亿美元,2026年至2035年的复合年增长率将达到17.1%。片剂和胶囊因其使用方便、剂量精准和便于携带等优点,继续在该领域占据主导地位。这些剂型因其符合忙碌的生活方式以及较长的保质期而备受青睐,进一步巩固了其强大的市场地位。
2025年,电解质产品市占率达到39.9%,预计2026年至2035年将以17.3%的复合年增长率成长。电解质配方产品透过补充必需矿物质来支持体液平衡和恢復,因此被广泛采用,成为寻求有效解酒方法的消费者的首选。
美国解酒产品市场预计到2025年将达到5亿美元,2026年至2035年复合年增长率将达到15.8%。高酒精消费量、强烈的健康意识、完善的零售基础设施以及功能性保健品的广泛应用,持续支撑着该市场的领先地位。此外,美国发达的数位商业环境和高级产品定位也进一步推动了市场渗透。
目录
第一章调查方法和范围
第二章执行摘要
第三章业界考察
- 生态系分析
- 供应商情况
- 利润率
- 每个阶段的附加价值
- 影响价值链的因素
- 产业影响因素
- 司机
- 全球酒精消费量不断成长
- 健康与保健意识
- 电子商务的扩张
- 挑战与困难
- 监管和安全问题
- 激烈的竞争和对价格的敏感性
- 机会
- 形状和成分方面的创新
- 新兴市场的成长
- 司机
- 成长潜力分析
- 未来市场趋势
- 科技与创新趋势
- 当前技术趋势
- 新兴技术
- 价格趋势
- 按地区
- 副产品
- 监管环境
- 北美洲
- 美国:消费品安全委员会(CPSC)联邦法规(CFR)第16篇第1512部分
- 加拿大:国际标准化组织(ISO)4210
- 欧洲
- 德国:德国标准化协会 (DIN) 欧洲标准 (EN) ISO 4210
- 英国:欧洲标准 (EN) ISO 4210 /英国合格评定 (UKCA)
- 法国:欧洲标准 (EN) ISO 4210
- 亚太地区
- 中国:国家标准(GB)3565
- 印度:印度标准 (IS) 10613
- 日本:日本工业标准(JIS)D 9110
- 拉丁美洲
- 巴西:巴西技术标准协会 (ABNT) 巴西标准 (NBR) ISO 4210
- 墨西哥:国际标准化组织(ISO)4210
- 中东和非洲
- 南非:南非国家标准 (SANS) 311
- 沙乌地阿拉伯:沙乌地阿拉伯标准、计量和品质组织 (SASO) 海湾标准组织 (GSO) ISO 4210
- 北美洲
- 贸易统计(HS编码-21069099)
- 主要进口国
- 主要出口国
- 波特五力分析
- PESTEL 分析
第四章 竞争情势
- 介绍
- 公司市占率分析
- 按地区
- 北美洲
- 欧洲
- 亚太地区
- 拉丁美洲
- 中东和非洲
- 按地区
- 企业矩阵分析
- 主要市场公司的竞争分析
- 竞争定位矩阵
- 重大进展
- 併购
- 伙伴关係与合作
- 新产品发布
- 扩张计划
第五章 依产品类型分類的市场估算与预测,2022-2035年
- 口服补充剂
- 预防宿醉的饮料
- 粉末
- 修补
- 其他的
第六章 依原料分類的市场估算与预测,2022-2035年
- 电解质
- 维他命
- 胺基酸
- 抗氧化剂
- 其他的
7. 按配方分類的市场估计和预测,2022-2035 年
- 草药
- 合成
第八章 按分销管道分類的市场估算与预测,2022-2035年
- 在线的
- 电子商务
- 公司网站
- 离线
- 药局/药局
- 超级市场/大卖场
- 专卖店
- 其他的
第九章 2022-2035年各地区市场估算与预测
- 北美洲
- 我们
- 加拿大
- 欧洲
- 德国
- 英国
- 法国
- 义大利
- 西班牙
- 亚太地区
- 中国
- 印度
- 日本
- 韩国
- 澳洲
- 拉丁美洲
- 巴西
- 墨西哥
- 阿根廷
- 中东和非洲
- 沙乌地阿拉伯
- 阿拉伯聯合大公国
- 南非
第十章:公司简介
- Abbott
- AfterDrink Ltd.
- Bayer AG
- Cheers Health
- DOTSHOT
- Drinkwel, LLC
- Flyby
- LES Labs
- Liquid IV, Inc.
- More Labs
- No Days Wasted
- Purple Tree Labs
- Rally Labs LLC
- The Himalaya Drug Company
- Toniiq
The Global Hangover Cure Products Market was valued at USD 2.6 billion in 2025 and is estimated to grow at a CAGR of 16.4% to reach USD 11.3 billion by 2035.
Rising alcohol consumption worldwide, particularly among younger adult populations, is a major factor contributing to market expansion. Shifts in social behavior, increased participation in nightlife activities, and greater disposable income levels are encouraging more frequent social drinking across urban and semi-urban regions. Changing cultural attitudes toward alcohol consumption and the growing influence of global lifestyle trends in developing economies are further expanding the consumer base. As social drinking becomes more common, demand is increasing for convenient solutions that help manage the aftereffects of alcohol intake. At the same time, heightened awareness around personal health and wellness is driving interest in functional products that address physical discomfort without compromising long-term well-being. Consumers increasingly seek preventive and recovery-focused options that align with active, health-conscious lifestyles, supporting sustained growth of the hangover cure products market throughout the forecast period.
| Market Scope | |
|---|---|
| Start Year | 2025 |
| Forecast Year | 2026-2035 |
| Start Value | $2.6 Billion |
| Forecast Value | $11.3 Billion |
| CAGR | 16.4% |
The oral supplements segment generated USD 1 billion in 2025 and is expected to grow at a CAGR of 17.1% from 2026 to 2035. Tablets and capsules continue to lead this segment due to their ease of use, accurate dosing, and portability. These formats fit well with fast-paced lifestyles and are favored for their longer shelf life and perceived reliability, reinforcing their strong market position.
The electrolytes segment held 39.9% share in 2025 and is projected to grow at a CAGR of 17.3% during 2026-2035. Electrolyte-based formulations are widely adopted because they support hydration balance and recovery by replenishing essential minerals, making them a preferred choice among consumers seeking effective hangover relief solutions.
US Hangover Cure Products Market generated USD 0.5 billion in 2025 and is expected to grow at a CAGR of 15.8% from 2026 to 2035. High alcohol consumption levels, strong wellness awareness, advanced retail infrastructure, and widespread adoption of functional supplements continue to support market leadership. The country's well-developed digital commerce ecosystem and premium product positioning further enhance market penetration.
Key companies operating in the Global Hangover Cure Products Market include Bayer AG, Abbott, Liquid I.V., Inc., The Himalaya Drug Company, Cheers Health, More Labs, Drinkwel, LLC, Rally Labs LLC, Flyby, DOTSHOT, No Days Wasted, Toniiq, Purple Tree Labs, AfterDrinkm Ltd., LES Labs, and Liquid I.V., Inc. Companies in the hangover cure products market strengthen their foothold by investing in research-driven formulations and clean-label ingredient profiles. Many brands focus on combining functional nutrition with scientifically supported ingredients to build consumer trust. Expanding digital marketing strategies and influencer partnerships helps increase brand visibility among younger demographics. Firms also emphasize convenient formats, premium positioning, and transparent labeling to attract health-conscious buyers. Strategic expansion across e-commerce and retail channels improves accessibility, while product diversification allows companies to address varying consumer preferences and usage occasions, supporting long-term market competitiveness.
Table of Contents
Chapter 1 Methodology & Scope
- 1.1 Market scope & definitions
- 1.2 Research design
- 1.2.1 Research approach
- 1.2.2 Data collection methods
- 1.3 Base estimates and calculations
- 1.3.1 Base year calculation
- 1.3.2 Market estimates & forecasts parameters
- 1.4 Forecast Model
- 1.4.1 Key trends for market estimates
- 1.4.2 Quantified market impact analysis
- 1.4.2.1 Mathematical impact of growth parameters on forecast
- 1.4.3 Scenario analysis framework
- 1.5 Primary research and validation
- 1.5.1 Some of the primary sources (but not limited to)
- 1.6 Data mining sources
- 1.6.1 Paid Sources
- 1.7 Primary research and validation
- 1.7.1 Primary sources
- 1.8 Research Trail & confidence scoring
- 1.8.1 Research trail components
- 1.8.2 Scoring components
- 1.9 Research transparency addendum
- 1.9.1 Source attribution framework
- 1.9.2 Quality assurance metrics
- 1.9.3 Our commitment to trust
- 1.10 Market Definitions
Chapter 2 Executive Summary
- 2.1 Industry 3600 synopsis
- 2.2 Key market trends
- 2.2.1 Regional
- 2.2.2 Product Type
- 2.2.3 Price range
- 2.2.4 End use
- 2.2.5 Distribution channels
- 2.3 CXO perspectives: Strategic imperatives
- 2.3.1 Key decision points for industry executives
- 2.3.2 Critical success factors for market players
- 2.4 Future outlook and strategic recommendations
Chapter 3 Industry Insights
- 3.1 Industry ecosystem analysis
- 3.1.1 Supplier landscape
- 3.1.2 Profit margin
- 3.1.3 Value addition at each stage
- 3.1.4 Factor affecting the value chain
- 3.2 Industry impact forces
- 3.2.1 Growth drivers
- 3.2.1.1 Rising alcohol consumption globally
- 3.2.1.2 Health & wellness awareness
- 3.2.1.3 E-commerce expansion
- 3.2.2 Pitfalls & Challenges
- 3.2.2.1 Regulatory & safety concerns
- 3.2.2.2 Intense competition & price sensitivity
- 3.2.3 Opportunities
- 3.2.3.1 Innovation in formats & ingredients
- 3.2.3.2 Emerging markets growth
- 3.2.1 Growth drivers
- 3.3 Growth potential analysis
- 3.4 Future market trends
- 3.5 Technology and innovation landscape
- 3.5.1 Current technological trends
- 3.5.2 Emerging technologies
- 3.6 Price trends
- 3.6.1 By region
- 3.6.2 By product
- 3.7 Regulatory landscape
- 3.7.1 North America
- 3.7.1.1 US: Consumer Product Safety Commission (CPSC) 16 Code of Federal Regulations (CFR) part 1512
- 3.7.1.2 Canada: International Organization for Standardization (ISO) 4210
- 3.7.2 Europe
- 3.7.2.1 Germany: Deutsches Institut fur Normung (DIN) European Norm (EN) ISO 4210
- 3.7.2.2 UK: European Norm (EN) ISO 4210 / United Kingdom Conformity Assessed (UKCA)
- 3.7.2.3 France: European Norm (EN) ISO 4210
- 3.7.3 Asia Pacific
- 3.7.3.1 China: Guobiao (GB) 3565
- 3.7.3.2 India: Indian Standard (IS) 10613
- 3.7.3.3 Japan: Japanese Industrial Standard (JIS) D 9110
- 3.7.4 Latin America
- 3.7.4.1 Brazil: Associacao Brasileira de Normas Tecnicas (ABNT) Norma Brasileira (NBR) ISO 4210
- 3.7.4.2 Mexico: International Organization for Standardization (ISO) 4210
- 3.7.5 Middle East & Africa
- 3.7.5.1 South Africa: South African National Standard (SANS) 311
- 3.7.5.2 Saudi Arabia: Saudi Standards, Metrology and Quality Organization (SASO) Gulf Standardization Organization (GSO) ISO 4210
- 3.7.1 North America
- 3.8 Trade statistics (HS Code - 21069099)
- 3.8.1 Major importing countries
- 3.8.2 Major exporting countries
- 3.9 Porter's analysis
- 3.10 PESTEL analysis
Chapter 4 Competitive Landscape, 2025
- 4.1 Introduction
- 4.2 Company market share analysis
- 4.2.1 By Region
- 4.2.1.1 North America
- 4.2.1.2 Europe
- 4.2.1.3 Asia Pacific
- 4.2.1.4 Latin America
- 4.2.1.5 Middle East & Africa
- 4.2.1 By Region
- 4.3 Company matrix analysis
- 4.4 Competitive analysis of major market players
- 4.5 Competitive positioning matrix
- 4.6 Key developments
- 4.6.1 Mergers & acquisitions
- 4.6.2 Partnerships & collaborations
- 4.6.3 New product launches
- 4.6.4 Expansion plans
Chapter 5 Market Estimates & Forecast, By Product Type, 2022 - 2035, (USD Billion) (Million Units)
- 5.1 Key trends
- 5.2 Oral supplements
- 5.3 Hangover drinks
- 5.4 Powder
- 5.5 Patches
- 5.6 Others
Chapter 6 Market Estimates & Forecast, By Ingredients, 2022 - 2035, (USD Billion) (Million Units)
- 6.1 Key trends
- 6.2 Electrolytes
- 6.3 Vitamins
- 6.4 Amino acids
- 6.5 Antioxidants
- 6.6 Others
Chapter 7 Market Estimates & Forecast, By Formulation, 2022 - 2035, (USD Billion) (Million Units)
- 7.1 Key trends
- 7.2 Herbal
- 7.3 Synthetic
Chapter 8 Market Estimates & Forecast, By Distribution Channel, 2022 - 2035, (USD Billion) (Million Units)
- 8.1 Key trends
- 8.2 Online
- 8.2.1 E-commerce
- 8.2.2 Company websites
- 8.3 Offline
- 8.3.1 Pharmacies/drugstores
- 8.3.2 Supermarkets/hypermarkets
- 8.3.3 Specialty stores
- 8.3.4 Others
Chapter 9 Market Estimates & Forecast, By Region, 2022 - 2035, (USD Billion) (Million Units)
- 9.1 Key trends
- 9.2 North America
- 9.2.1 U.S.
- 9.2.2 Canada
- 9.3 Europe
- 9.3.1 Germany
- 9.3.2 UK
- 9.3.3 France
- 9.3.4 Italy
- 9.3.5 Spain
- 9.4 Asia Pacific
- 9.4.1 China
- 9.4.2 India
- 9.4.3 Japan
- 9.4.4 South Korea
- 9.4.5 Australia
- 9.5 Latin America
- 9.5.1 Brazil
- 9.5.2 Mexico
- 9.5.3 Argentina
- 9.6 MEA
- 9.6.1 Saudi Arabia
- 9.6.2 UAE
- 9.6.3 South Africa
Chapter 10 Company Profiles
- 10.1 Abbott
- 10.2 AfterDrink Ltd.
- 10.3 Bayer AG
- 10.4 Cheers Health
- 10.5 DOTSHOT
- 10.6 Drinkwel, LLC
- 10.7 Flyby
- 10.8 LES Labs
- 10.9 Liquid I.V., Inc.
- 10.10 More Labs
- 10.11 No Days Wasted
- 10.12 Purple Tree Labs
- 10.13 Rally Labs LLC
- 10.14 The Himalaya Drug Company
- 10.15 Toniiq


