


 |
市场调查报告书
商品编码
1936568
区域供冷市场机会、成长要素、产业趋势分析及2026年至2035年预测District Cooling Market Opportunity, Growth Drivers, Industry Trend Analysis, and Forecast 2026 - 2035 |
||||||
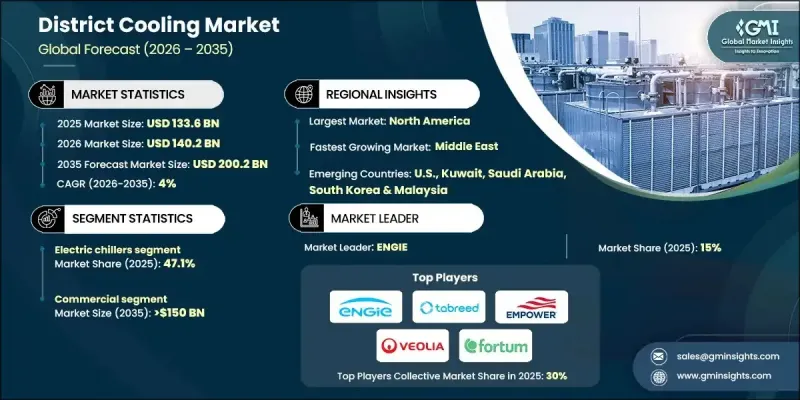
全球区域供冷市场预计到 2025 年将达到 1,336 亿美元,到 2035 年将达到 2,002 亿美元,年复合成长率为 4%。
城市化进程的加速以及人口密集地区对高效空间冷却需求的不断增长,推动了市场成长。为响应全球永续性目标,人们日益重视降低能源消耗和碳排放,这进一步增强了产业发展动能。区域供冷系统运作集中式冷冻水生产,并透过隔热管网向多栋建筑输送冷水,是独立式冷冻系统的高效替代方案。这些解决方案有助于降低电力需求、优化负载管理并减少对环境的影响。能源成本的上涨以及对优化热效率日益增长的需求,促使人们倾向于选择集中式冷冻基础设施。替代能源和热回收技术的整合进一步提升了系统性能和永续性。政府主导的节能项目和绿建筑标准正在推动其更广泛的应用。对系统升级、管网扩建和先进储热技术的持续投资,提高了运作韧性和长期成本效益,从而巩固了全球市场的稳定成长。
| 市场覆盖范围 | |
|---|---|
| 开始年份 | 2025 |
| 预测年份 | 2026-2035 |
| 起始值 | 1336亿美元 |
| 预测金额 | 2002亿美元 |
| 复合年增长率 | 4% |
到2025年,基于电动冷却器机组的区域供冷系统市场份额将达到47.1%。此细分市场的成长主要得益于大型冷冻机组的日益普及,这些机组旨在支援集中式基础设施。冷却器效率的提升、性能优化以及智慧控制技术的集成,正不断推动其在大规模供冷网路中的应用。
预计到2025年,商业应用领域将占市场份额的76.7%,到2035年将达到1,500亿美元。市场需求主要源自于对可靠、节能的冷冻解决方案的需求,这些解决方案需能满足大规模建筑群的需求,并符合不断发展的能源效率标准。自动化和系统最佳化技术的进步也持续推动着商业领域的成长。
预计到 2025 年,美国区域供冷市场将创造 1,090 亿美元的收入,占市场份额的 90.5%。强有力的监管、节能製冷技术的采用以及高密度城市发展将继续支撑该市场的主导地位和长期扩张。
目录
第一章调查方法和范围
第二章执行摘要
第三章业界考察
- 生态系分析
- 主要供应商和技术提供商
- 物流、配送和服务
- 监管环境
- 产业影响因素
- 司机
- 产业潜在风险与挑战
- 成长潜力分析
- 波特五力分析
- PESTEL 分析
- 区域供冷系统的成本结构分析
- 区域价格趋势分析
- 新的机会与趋势
- 数位化和物联网集成
- 案例研究分析—斯德哥尔摩综合区域供热冷冻系统
- 计划概述
- 关键事实和数据
- 客户区隔
- 支持区域供热和製冷(DHC)的政策和奖励
第四章 竞争情势
- 介绍
- 按地区分類的公司市占率分析
- 北美洲
- 欧洲
- 亚太地区
- 中东
- 世界其他地区
- 战略仪錶板
- Key partnerships &collaborations
- Major M&A activities
- Product innovations &launches
- Market expansion strategies
- 策略倡议
- 竞争标竿分析
- 创新与科技趋势
第五章 依製造技术分類的市场规模及预测(2022-2035年)
- 自然冷却
- 吸收式製冷机
- 热泵
- 电动冷冻机组
- 其他的
第六章 依应用领域分類的市场规模及预测(2022-2035年)
- 住宅
- 商业的
- 学院和高等教育机构
- 办公大楼
- 政府大楼
- 其他的
- 产业
第七章 2022-2035年各地区市场规模及预测
- 北美洲
- 我们
- 加拿大
- 欧洲
- 德国
- 波兰
- 瑞典
- 义大利
- 法国
- 芬兰
- 奥地利
- 挪威
- 亚太地区
- 中国
- 日本
- 韩国
- 新加坡
- 马来西亚
- 中东
- 沙乌地阿拉伯
- 阿拉伯聯合大公国
- 卡达
- 阿曼
- 科威特
- 巴林
- 世界其他地区
第八章:公司简介
- ADC Energy Systems
- AtkinsRealis
- Cetetherm
- Danfoss
- DC Pro Engineering
- Emicool
- Emirates Central Cooling Systems Corporation PJSC
- ENGIE
- Fortum
- Goteborg Energi
- Helen
- Keppel
- LOGSTOR Denmark Holding
- Marafeq Qatar
- Pal Group
- Qatar District Cooling Company
- Ramboll Group
- Shinryo Corporation
- Siemens
- SP Group
- Stellar Energy
- Tabreed
- Vattenfall
- Veolia
- Wien Energie
The Global District Cooling Market was valued at USD 133.6 billion in 2025 and is estimated to grow at a CAGR of 4% to reach USD 200.2 billion by 2035.
Market growth is supported by accelerating urban development and rising demand for efficient space cooling across densely populated environments. Increasing focus on lowering energy consumption and carbon emissions in line with global sustainability objectives continues to strengthen industry momentum. District cooling systems operate through centralized production of chilled water that is distributed to multiple buildings via insulated networks, offering a highly efficient alternative to standalone cooling systems. These solutions support reduced electricity demand, improved load management, and lower environmental impact. Rising energy costs and the need for optimized thermal efficiency are driving preference for centralized cooling infrastructure. Integration of alternative energy sources and recovery technologies further enhances system performance and sustainability. Government-backed energy efficiency programs and green construction standards are supporting broader adoption. Continued investment in system upgrades, distribution expansion, and advanced thermal storage technologies is improving operational resilience and long-term cost efficiency, reinforcing steady market expansion worldwide.
| Market Scope | |
|---|---|
| Start Year | 2025 |
| Forecast Year | 2026-2035 |
| Start Value | $133.6 Billion |
| Forecast Value | $200.2 Billion |
| CAGR | 4% |
The electric chiller-based district cooling systems segment accounted for 47.1% share in 2025. Growth in this segment is driven by the rising deployment of high-capacity cooling equipment designed to support centralized infrastructure. Advancements in chiller efficiency, performance optimization, and intelligent control integration continue to strengthen adoption across large-scale cooling networks.
The commercial applications segment held 76.7% share in 2025 and is projected to reach USD 150 billion by 2035. Demand is driven by the need for reliable, energy-efficient cooling solutions that support large building clusters and comply with evolving efficiency standards. Increased automation and system optimization continue to support growth across commercial developments.
United States District Cooling Market held 90.5% share in 2025, generating USD 109 billion. Strong regulatory enforcement, adoption of energy-efficient cooling technologies, and high-density urban development continue to support market leadership and long-term expansion.
Key companies operating in the Global District Cooling Market include ENGIE, Tabreed, Danfoss, Siemens, Veolia, Keppel, Fortum, Vattenfall, Emirates Central Cooling Systems Corporation PJSC, LOGSTOR Denmark Holding, Ramboll Group, ADC Energy Systems, Cetetherm, Marafeq Qatar, Qatar District Cooling Company, Shinryo Corporation, SP Group, Helen, Goteborg Energi, Stellar Energy, Pal Group, Wien Energie, DC Pro Engineering, and AtkinsRealis. These players maintain strong market positions through integrated service capabilities and large-scale infrastructure expertise. To strengthen their presence in pharmaceutical and healthcare applications, district cooling providers focus on delivering highly reliable and uninterrupted cooling solutions that meet stringent operational and regulatory requirements. Companies invest in redundant system design, advanced monitoring, and predictive maintenance to ensure continuous temperature control, which is critical for healthcare environments. Strategic collaborations with healthcare infrastructure developers support early system integration.
Table of Contents
Chapter 1 Methodology & Scope
- 1.1 Research approach
- 1.2 Quality commitments
- 1.2.1 GMI AI policy & data integrity commitment
- 1.2.1.1 Source consistency protocol
- 1.2.1 GMI AI policy & data integrity commitment
- 1.3 Research trail & confidence scoring
- 1.3.1 Research trail components
- 1.3.2 Scoring components
- 1.4 Data collection
- 1.4.1 Partial list of primary sources
- 1.5 Data mining sources
- 1.5.1 Paid sources
- 1.5.1.1 Sources, by region
- 1.5.1 Paid sources
- 1.6 Base estimates and calculations
- 1.6.1 Base year calculation for any one approach
- 1.7 Market estimates & forecasts parameters
- 1.8 Forecast model
- 1.8.1 Quantified market impact analysis
- 1.8.1.1 Mathematical impact of growth parameters on forecast
- 1.8.1 Quantified market impact analysis
- 1.9 Research transparency addendum
- 1.9.1 Source attribution framework
- 1.9.2 Quality assurance metrics
- 1.9.3 Our commitment to trust
- 1.10 Market definitions
Chapter 2 Executive Summary
- 2.1 Industry synopsis, 2022 - 2035
- 2.2 Business trends
- 2.3 Production technique trends
- 2.4 Application trends
- 2.5 Regional trends
Chapter 3 Industry Insights
- 3.1 Industry ecosystem analysis
- 3.1.1 Key suppliers and technology providers
- 3.1.2 Logistics, distribution, and services
- 3.2 Regulatory landscape
- 3.3 Industry impact forces
- 3.3.1 Growth drivers
- 3.3.2 Industry pitfalls & challenges
- 3.4 Growth potential analysis
- 3.5 Porter's analysis
- 3.5.1 Bargaining power of suppliers
- 3.5.2 Bargaining power of buyers
- 3.5.3 Threat of new entrants
- 3.5.4 Threat of substitutes
- 3.6 PESTEL analysis
- 3.6.1 Political factors
- 3.6.2 Economic factors
- 3.6.3 Social factors
- 3.6.4 Technological factors
- 3.6.5 Legal factors
- 3.6.6 Environmental factors
- 3.7 Cost structure analysis of district cooling system
- 3.8 Price trend analysis, by region
- 3.9 Emerging opportunities & trends
- 3.10 Digitalization and IoT integration
- 3.11 Case study analysis - Integrated DHC system in Stockholm
- 3.11.1 Project overview
- 3.11.2 Key facts & figures
- 3.11.3 Customer segmentation
- 3.11.4 Policies & incentives supporting the DHC
Chapter 4 Competitive Landscape, 2026
- 4.1 Introduction
- 4.2 Company market share analysis, by region, 2025
- 4.2.1 North America
- 4.2.2 Europe
- 4.2.3 Asia Pacific
- 4.2.4 Middle East
- 4.2.5 Rest of World
- 4.3 Strategic dashboard
- 4.3.1 Key partnerships & collaborations
- 4.3.2 Major M&A activities
- 4.3.3 Product innovations & launches
- 4.3.4 Market expansion strategies
- 4.4 Strategic initiatives
- 4.5 Competitive benchmarking
- 4.6 Innovation & technology landscape
Chapter 5 Market Size and Forecast, By Production Technique, 2022 - 2035 (USD Million & TJ)
- 5.1 Key trends
- 5.2 Free cooling
- 5.3 Absorption cooling
- 5.4 Heat pumps
- 5.5 Electric chillers
- 5.6 Others
Chapter 6 Market Size and Forecast, By Application, 2022 - 2035 (USD Million & TJ)
- 6.1 Key trends
- 6.2 Residential
- 6.3 Commercial
- 6.3.1 College/university
- 6.3.2 Office building
- 6.3.3 Government building
- 6.3.4 Others
- 6.4 Industrial
Chapter 7 Market Size and Forecast, By Region, 2022 - 2035 (USD Million & TJ)
- 7.1 Key trends
- 7.2 North America
- 7.2.1 U.S.
- 7.2.2 Canada
- 7.3 Europe
- 7.3.1 Germany
- 7.3.2 Poland
- 7.3.3 Sweden
- 7.3.4 Italy
- 7.3.5 France
- 7.3.6 Finland
- 7.3.7 Austria
- 7.3.8 Norway
- 7.4 Asia Pacific
- 7.4.1 China
- 7.4.2 Japan
- 7.4.3 South Korea
- 7.4.4 Singapore
- 7.4.5 Malaysia
- 7.5 Middle East
- 7.5.1 Saudi Arabia
- 7.5.2 UAE
- 7.5.3 Qatar
- 7.5.4 Oman
- 7.5.5 Kuwait
- 7.5.6 Bahrain
- 7.6 Rest of World
Chapter 8 Company Profiles
- 8.1 ADC Energy Systems
- 8.2 AtkinsRealis
- 8.3 Cetetherm
- 8.4 Danfoss
- 8.5 DC Pro Engineering
- 8.6 Emicool
- 8.7 Emirates Central Cooling Systems Corporation PJSC
- 8.8 ENGIE
- 8.9 Fortum
- 8.10 Goteborg Energi
- 8.11 Helen
- 8.12 Keppel
- 8.13 LOGSTOR Denmark Holding
- 8.14 Marafeq Qatar
- 8.15 Pal Group
- 8.16 Qatar District Cooling Company
- 8.17 Ramboll Group
- 8.18 Shinryo Corporation
- 8.19 Siemens
- 8.20 SP Group
- 8.21 Stellar Energy
- 8.22 Tabreed
- 8.23 Vattenfall
- 8.24 Veolia
- 8.25 Wien Energie
 区域供冷市场:按类型、冷却介质、技术、应用和安装方式划分-全球市场预测(2026-2032 年)
 2026年全球区域供冷市场报告2026年全球数位双胞胎区域供冷市场报告
 全球区域供冷市场规模、份额、趋势和成长分析报告(2026-2034年)
 区域供冷市场-全球产业规模、份额、趋势、机会、预测:按类型、最终用途产业、地区和竞争格局划分,2021-2031年区域供冷市场规模、占有率、成长、全球产业分析:依类型和应用划分、区域洞察和预测(2026-2034年)
 2025-2029年全球区域冷冻市场
 区域冷冻市场规模、份额及成长分析(按生产技术、技术、所有权、冷却介质、应用和地区)-2025-2032 年产业预测
 全球区域製冷市场:市场规模、市场占有率、趋势、行业分析(依应用、技术、服务类型、动力源和地区)、未来预测(2025-2034年)
 全球区域供冷市场:按生产技术、原料、应用、地区划分 - 到 2029 年的预测