


 |
市场调查报告书
商品编码
1936643
排碳权市场机会、成长要素、产业趋势分析及2026年至2035年预测Carbon Credit Market Opportunity, Growth Drivers, Industry Trend Analysis, and Forecast 2026 - 2035 |
||||||
全球碳信用市场预计到 2025 年价值将达到 1,143 亿美元,并以 15.9% 的复合年增长率成长,到 2035 年达到 4,820 亿美元。
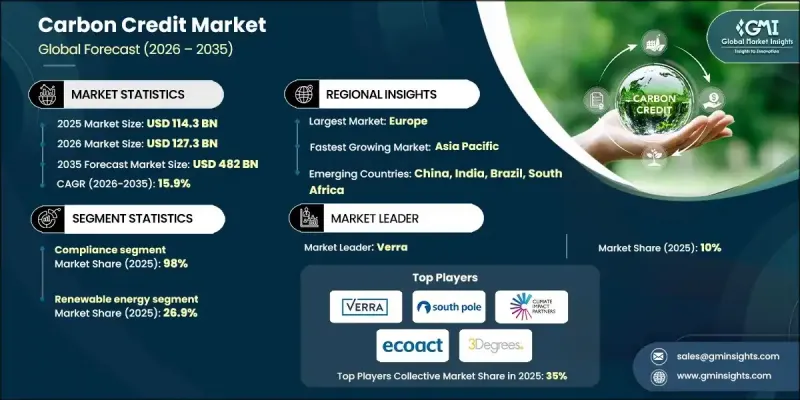
市场成长的驱动力来自全球气候法规的日益完善、企业净零排放目标的不断提高,以及基于市场的温室排放减排机制的日益普及。排碳权已成为政府和企业抵销排放的重要金融工具,同时支持可再生能源、植树造林和甲烷捕集等气候变迁减缓计划。碳市场与国家气候政策和排放交易体系的日益融合,正在提升市场的透明度和流动性。此外,投资者和消费者对环境课责的日益重视,也促使各组织积极参与排碳权交易,将其纳入长期永续性策略。
| 市场覆盖范围 | |
|---|---|
| 开始年份 | 2025 |
| 预测年份 | 2026-2035 |
| 起始值 | 1143亿美元 |
| 预测金额 | 4820亿美元 |
| 复合年增长率 | 15.9% |
按类型划分,合规碳信用额预计到2025年将占98%的市场份额,这主要得益于受监管排放交易体系中强制性排放框架的推动。合规市场的主要驱动力是针对发电、製造业和重工业等行业实施的严格监管要求,这些要求旨在限制碳排放。合规碳信用为受监管营业单位提供了柔软性,使其能够在实现排放目标的同时,维持业务永续营运。凭藉标准化的检验机制、政府监管和可预测的需求等优势,合规碳信用已成为全球脱碳努力的基础。
到2025年,可再生能源领域将占全球能源供应的26.9%,主要得益于对风能、太阳能、水力发电和生质能源计划的大规模投资,旨在减少对石化燃料的依赖。可再生能源计划在合规市场和自愿市场都极具吸引力,因为它们可以透过替代高碳排放的发电方式来产生排碳权。公共产业、独立发电企业和计划开发商正越来越多地将这些碳信用额货币化,以提高计划的可行性并确保额外的收入来源。该行业正受益于强有力的政策支持、长期购电协议以及企业对清洁能源碳抵消日益增长的需求。
在成熟的欧盟排放交易体系(EU ETS)的支持下,欧洲排碳权市场预计将在2026年至2035年间以15.9%的复合年增长率成长。该地区受益于严格的气候法规、先进的监测框架以及对碳中和的坚定政治承诺。欧洲各行业积极参与碳排放交易,以在遵守排放上限的同时优化营运成本。随着排放交易机制的扩展以及更多产业持续融入欧盟排放交易体系,欧洲在全球碳信用生态系统的主导地位将进一步巩固。
目录
第一章调查方法和范围
第二章执行摘要
第三章业界考察
- 生态系分析
- 监管环境
- 产业影响因素
- 司机
- 产业潜在风险与挑战
- 成长潜力分析
- 波特五力分析
- PESTEL 分析
- 新的机会与趋势
- 数位化和物联网集成
- 拓展新兴市场
第四章 竞争情势
- 介绍
- 公司市占率分析
- 北美洲
- 欧洲
- 亚太地区
- 中东和非洲
- 拉丁美洲
- 策略倡议
- 竞争标竿分析
- 战略仪錶板
- 创新与科技趋势
第五章 依类型分類的市场规模及预测(2022-2035年)
- 自愿
- 遵守
6. 依来源分類的市场规模及预测,2022-2035年
- 农业
- 捕碳封存
- 化学过程
- 能源效率
- 产业
- 林业/土地利用
- 可再生能源
- 运输
- 废弃物管理
- 其他的
第七章 2022-2035年各地区市场规模及预测
- 北美洲
- 欧洲
- 亚太地区
- 中东和非洲
- 拉丁美洲
第八章 公司简介
- 3Degrees
- Allcot
- Atmosfair
- Carbon Clear
- Carbon Collective Company
- Carbon Credit Capital
- Carbonmark
- Carbonplace
- Climate Impact Partners
- Climeco
- EcoAct
- Ecosecurities
- Green Mountain Energy
- Shell
- South Pole
- Sterling Planet
- Terrapass
- The Carbon Trust
- Verra
- WGL Holdings
The Global Carbon Credit Market was valued at USD 114.3 billion in 2025 and is estimated to grow at a CAGR of 15.9% to reach USD 482 billion by 2035.
Market growth is driven by tightening global climate regulations, rising corporate net-zero commitments, and increasing adoption of market-based mechanisms to reduce greenhouse gas emissions. Carbon credits have emerged as a critical financial instrument enabling governments and corporations to offset emissions while supporting climate mitigation projects such as renewable energy, reforestation, and methane capture. The growing integration of carbon markets into national climate policies and emissions trading systems is enhancing market transparency and liquidity. Additionally, increasing pressure from investors and consumers for environmental accountability is compelling organizations to actively participate in carbon credit trading as part of long-term sustainability strategies.
| Market Scope | |
|---|---|
| Start Year | 2025 |
| Forecast Year | 2026-2035 |
| Start Value | $114.3 Billion |
| Forecast Value | $482 Billion |
| CAGR | 15.9% |
Based on type, the compliance carbon credits segment held 98% share in 2025, owing to mandatory emission reduction frameworks under regulated emissions trading schemes. Compliance markets are primarily driven by strict regulatory mandates imposed on power generation, manufacturing, and heavy industrial sectors to limit carbon emissions. These credits provide regulated entities with flexibility to meet emission targets while maintaining operational continuity. The segment benefits from standardized verification mechanisms, government oversight, and predictable demand, making compliance carbon credits a cornerstone of global decarbonization efforts.
The renewable energy segment held 26.9% share in 2025, driven by large-scale investments in wind, solar, hydro, and bioenergy projects aimed at reducing dependence on fossil fuels. Renewable energy projects generate carbon credits by displacing carbon-intensive power generation, making them highly attractive for both compliance and voluntary markets. Utilities, independent power producers, and project developers increasingly monetize these credits to improve project viability and secure additional revenue streams. The segment benefits from strong policy support, long-term power purchase agreements, and growing corporate demand for clean energy-backed offsets.
Europe Carbon Credit Market will grow at a CAGR of 15.9% through 2026-2035, supported by the well-established EU Emissions Trading System (EU ETS). The region benefits from stringent climate regulations, advanced monitoring frameworks, and strong political commitment toward carbon neutrality. European industries actively participate in carbon trading to comply with emission caps while optimizing operational costs. The expansion of cross-border trading mechanisms and integration of additional sectors into the EU ETS continue to strengthen Europe's leadership in the global carbon credit ecosystem.
Key players operating in the Global Carbon Credit Market include Verra, Gold Standard Foundation, Climate Impact X, South Pole, Carbon Trust, EcoAct, Shell plc, BP plc, TotalEnergies, and ENGIE, among others. These companies focus on project development, credit certification, digital trading platforms, and corporate decarbonization advisory services to expand their market footprint. Companies in the Carbon Credit Market are strengthening their market position through strategic investments in high-integrity carbon projects, digital trading platforms, and verification technologies. Leading players focus on expanding renewable energy, forestry, and nature-based projects to ensure long-term credit availability and quality. Partnerships with governments, corporates, and financial institutions help scale trading volumes and improve market transparency. Firms are also leveraging blockchain and AI-driven monitoring tools to enhance traceability, prevent double-counting, and build buyer confidence.
Table of Contents
Chapter 1 Methodology & Scope
- 1.1 Research approach
- 1.2 Quality commitment
- 1.2.1 GMI AI policy & data integrity commitment
- 1.2.1.1 Source consistency protocol
- 1.2.1 GMI AI policy & data integrity commitment
- 1.3 Research Trail & Confidence Scoring
- 1.3.1 Research Trail Components
- 1.3.2 Scoring Components
- 1.4 Data Collection
- 1.4.1 Partial list of primary sources
- 1.5 Data mining sources
- 1.5.1 Paid sources
- 1.5.1.1 Sources, by region
- 1.5.1 Paid sources
- 1.6 Base estimates and calculations
- 1.6.1 Base year calculation for any one approach
- 1.7 Forecast model
- 1.8 Research transparency addendum
- 1.8.1 Source attribution framework
- 1.8.2 Quality assurance metrics
- 1.8.3 Our commitment to trust
- 1.9 Market definitions
Chapter 2 Executive Summary
- 2.1 Industry synopsis, 2022 - 2035
- 2.1.1 Business trends
- 2.1.2 Type trends
- 2.1.3 Source trends
- 2.1.4 Regional trends
Chapter 3 Industry Insights
- 3.1 Industry ecosystem analysis
- 3.2 Regulatory landscape
- 3.3 Industry impact forces
- 3.3.1 Growth drivers
- 3.3.2 Industry pitfalls & challenges
- 3.4 Growth potential analysis
- 3.5 Porter's analysis
- 3.5.1 Bargaining power of suppliers
- 3.5.2 Bargaining power of buyers
- 3.5.3 Threat of new entrants
- 3.5.4 Threat of substitutes
- 3.6 PESTEL analysis
- 3.6.1 Political factors
- 3.6.2 Economic factors
- 3.6.3 Social factors
- 3.6.4 Technology factors
- 3.6.5 environmental factors
- 3.6.6 Legal factors
- 3.7 Emerging opportunities & trends
- 3.7.1 Digitalization and IoT integration
- 3.7.2 Emerging market penetration
Chapter 4 Competitive landscape, 2025
- 4.1 Introduction
- 4.2 Company market share analysis, 2025
- 4.2.1 North America
- 4.2.2 Europe
- 4.2.3 Asia Pacific
- 4.2.4 Middle East & Africa
- 4.2.5 Latin America
- 4.3 Strategic initiatives
- 4.4 Competitive benchmarking
- 4.5 Strategic dashboard
- 4.6 Innovation & technology landscape
Chapter 5 Market Size and Forecast, By Type, 2022 - 2035 (USD Million)
- 5.1 Key trends
- 5.2 Voluntary
- 5.3 Compliance
Chapter 6 Market Size and Forecast, By Source, 2022 - 2035 (USD Million)
- 6.1 Key trends
- 6.2 Agriculture
- 6.3 Carbon capture & storage
- 6.4 Chemical process
- 6.5 Energy efficiency
- 6.6 Industrial
- 6.7 Forestry & land use
- 6.8 Renewable energy
- 6.9 Transportation
- 6.10 Waste management
- 6.11 Others
Chapter 7 Market Size and Forecast, By Region, 2022 - 2035 (USD Million)
- 7.1 Key trends
- 7.2 North America
- 7.3 Europe
- 7.4 Asia Pacific
- 7.5 Middle East & Africa
- 7.6 Latin America
Chapter 8 Company Profiles
- 8.1 3Degrees
- 8.2 Allcot
- 8.3 Atmosfair
- 8.4 Carbon Clear
- 8.5 Carbon Collective Company
- 8.6 Carbon Credit Capital
- 8.7 Carbonmark
- 8.8 Carbonplace
- 8.9 Climate Impact Partners
- 8.10 Climeco
- 8.11 EcoAct
- 8.12 Ecosecurities
- 8.13 Green Mountain Energy
- 8.14 Shell
- 8.15 South Pole
- 8.16 Sterling Planet
- 8.17 Terrapass
- 8.18 The Carbon Trust
- 8.19 Verra
- 8.20 WGL Holdings
 碳抵销/排碳权市场:按市场类型、信用类型、计划区域、交付机制和最终用户划分-2026-2032年全球市场预测
 2026年全球农业、林业和土地利用排碳权市场报告排碳权验证、检验和认证市场:2026-2032年全球市场预测(按服务类型、计划类型、标准、最终用户和应用划分)
 碳农业信贷市场预测至2034年-全球分析(按信贷类型、信贷机制、市场类型、检验方法、买方类型、农场规模、收入模式、平台类型、应用和地区划分)
 排碳权检验与认证市场规模、份额、成长及全球产业分析:按类型、应用和地区划分,并预测至2026-2034年
 2026-2030年全球排碳权市场
 智慧碳交易平台市场分析及预测(至2035年):按类型、产品类型、服务、技术、组件、应用、部署类型、最终用户、解决方案和模式划分
 全球排碳权检验、验证和认证市场(按类型、应用和地区划分)-预测至2030年
 日本排碳权市场规模、份额、趋势及预测(按类型、计划类型、最终用途行业和地区划分,2026-2034年)
 农业碳封存市场-全球产业规模、份额、趋势、机会、预测:按原料、应用、地区和竞争对手划分,2021-2031年