


 |
市场调查报告书
商品编码
1936673
水下连接器市场机会、成长要素、产业趋势分析及预测(2026年至2035年)Underwater Connectors Market Opportunity, Growth Drivers, Industry Trend Analysis, and Forecast 2026 - 2035 |
||||||
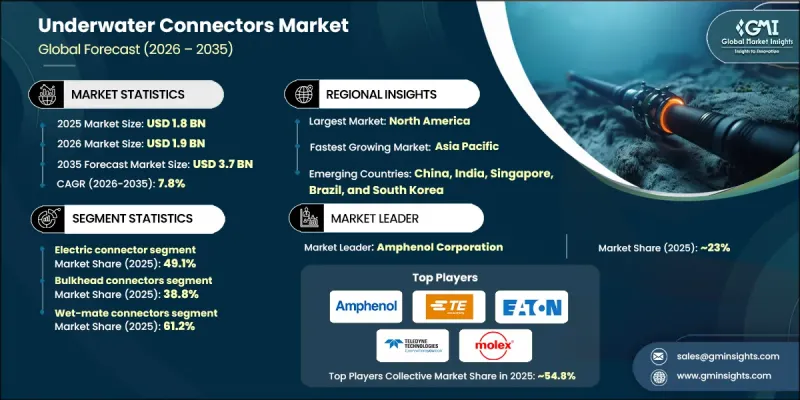
全球水下连接器市场预计到 2025 年将达到 18 亿美元,到 2035 年将达到 37 亿美元,年复合成长率为 7.8%。
市场扩张的驱动力来自海上石油探勘的增加、海底电力和通讯网路的部署,以及远程操作车辆(ROV) 和自主水下航行器 (AUV) 的日益普及。不断成长的基本客群,包括能源供应商、国防专案、通讯联盟、海洋研究机构和新兴的水下资料中心营运商,推动了对满足其独特电压、深度和可靠性标准的连接器的需求。海上能源计划、海底光纤线路和高压风电互连对干插拔连接器的需求日益增长。支援人工智慧驱动流量、高密度光纤网路和模组化服务型海底系统的光纤基础设施投资增加,进一步推动了需求,使水下连接器成为不断发展的海底生态系统中的关键组件。
| 市场覆盖范围 | |
|---|---|
| 开始年份 | 2025 |
| 预测年份 | 2026-2035 |
| 起始值 | 18亿美元 |
| 预测金额 | 37亿美元 |
| 复合年增长率 | 7.8% |
预计到2025年,电气连接器市占率将达到49.1%。海底枢纽、深水油气系统、侦测机器人和离岸风力发电电场都依赖坚固耐用且耐环境腐蚀的电气连接器。美国蓬勃发展的海上作业正在推动对海底电力基础设施的投资,使电气连接器稳固地成为关键细分市场;同时,高压干插拔组件在浮动式风力发电和併网系统中也越来越受欢迎。
预计到2025年,舱壁连接器市占率将达到38.8%。舱壁连接器对于在海底外壳和控制模组之间可靠地分配电力和数据至关重要。为了满足不断变化的海底应用需求,製造商正致力于研发耐腐蚀、高性能的舱壁连接器设计,以提供更佳的密封性、更高的功率密度和更高的资料传输速率。
预计到 2025 年,北美水下连接器市场将占 38.6% 的份额。该地区的成长得益于海底电缆安装量的增加、离岸风力发电计划的推进以及国防和能源项目投资的增加,同时监管部门的支持和海底系统的技术创新也推动了这一增长。
目录
第一章调查方法和范围
第二章执行摘要
第三章业界考察
- 生态系分析
- 供应商情况
- 利润率
- 成本结构
- 每个阶段的附加价值
- 影响价值链的因素
- 中断
- 生态系分析
- 产业影响因素
- 司机
- 深水海上油气业务不断成长
- 扩大海底通讯基础设施
- 海上可再生能源併网和电网成长
- 连接器材料和密封技术的进步
- 挑战与困难
- 高昂的研发和製造成本
- 密封件和高压湿式连接器的复杂性
- 市场机会
- 连接器材料和密封技术的进步
- 扩大远程操作车辆(ROV)的应用
- 司机
- 成长潜力分析
- 监管环境
- 北美洲
- 欧洲
- 亚太地区
- 拉丁美洲
- 中东和非洲
- 波特五力分析
- PESTEL 分析
- 科技与创新趋势
- 当前技术趋势
- 新兴技术
- 新兴经营模式
- 合规要求
- 永续性措施
- 消费者心理分析
- 专利和智慧财产权分析
- 地缘政治和贸易趋势
第四章 竞争情势
- 介绍
- 公司市占率分析
- 按地区
- 北美洲
- 欧洲
- 亚太地区
- 拉丁美洲
- 中东和非洲
- 市场集中度分析
- 按地区
- 主要企业的竞争标竿分析
- 财务绩效比较
- 收入
- 利润率
- 研究与开发
- 产品系列比较
- 产品线的广度
- 科技
- 创新
- 地理分布比较
- 全球扩张分析
- 服务网路覆盖
- 按地区分類的市场渗透率
- 竞争定位矩阵
- 领导企业
- 受让人
- 追踪者
- 小众玩家
- 战略展望矩阵
- 财务绩效比较
- 2021-2024 年主要发展动态
- 併购
- 伙伴关係与合作
- 技术进步
- 扩张与投资策略
- 永续发展倡议
- 数位转型计划
- 新兴/Start-Ups竞赛的趋势
第五章 依产品类型分類的市场估算与预测,2022-2035年
- 电气连接器
- 光纤连接器
- 混合连接器
第六章 依机械结构分類的市场估计与预测,2022-2035年
- 隔板连接器(面板安装型)
- 在线连续连接器(电缆对电缆连接)
- 穿透连接器(耐压壳体穿透)
- 其他的
7. 依配种方式分類的市场估计与预测,2022-2035年
- 湿式连接器
- Drymate 连接器
第八章 按材质的市场估算与预测,2022-2035年
- 金属
- 不銹钢
- 钛
- 复合材料
- 塑胶和聚合物
- 橡皮
第九章 依连接器类型分類的市场估算与预测,2022-2035年
- 圆形连接器
- 矩形连接器
- 其他的
- 椭圆形
- D型
- 风俗
第十章 依深度分類的市场估计与预测,2022-2035年
- 浅水区(水深小于200公尺)
- 中等深度(200-1000公尺)
- 深海域(1000-3000公尺)
- 超深海(超过3000公尺/超过10000公尺)
第十一章 依电压等级分類的市场估算与预测,2022-2035年
- 低电压(低于1000V)
- 中压(1000V 至 10kV)
- 高压(超过10千伏特)
第十二章 按应用领域分類的市场估算与预测,2022-2035年
- 海上油气
- 潜水艇通信
- 国防和海军
- 海洋调查
- 可再生能源
- 其他的
- 海底采矿
- 水产养殖
- ROV
第十三章 2022-2035年各地区市场估算与预测
- 北美洲
- 我们
- 加拿大
- 欧洲
- 德国
- 英国
- 法国
- 西班牙
- 义大利
- 荷兰
- 亚太地区
- 中国
- 印度
- 日本
- 澳洲
- 韩国
- 拉丁美洲
- 巴西
- 墨西哥
- 阿根廷
- 中东和非洲
- 南非
- 沙乌地阿拉伯
- 阿拉伯聯合大公国
第十四章:公司简介
- Amphenol Corp.
- Baker Hughes(GE Company LLC)
- Eaton Corporation
- Fischer Connectors
- Glenair Inc.
- Hydro Group
- MacArtney
- Molex
- Smiths Group Plc
- TE Connectivity
- Teledyne
The Global Underwater Connectors Market was valued at USD 1.8 billion in 2025 and is estimated to grow at a CAGR of 7.8% to reach USD 3.7 billion by 2035.
Market expansion is driven by rising offshore oil and gas exploration, the deployment of subsea power and communication networks, and increased utilization of remotely operated vehicles (ROVs) and autonomous underwater vehicles (AUVs). A widening customer base, including energy operators, defense programs, telecom consortia, ocean research institutions, and emerging underwater data-center operators, is driving demand for connectors that meet unique voltage, depth, and reliability standards. Both wet-mate and dry-mate connectors are increasingly sought after for offshore energy projects, undersea fiber routes, and high-voltage wind interconnections. Rising fiber-optic infrastructure investments to support AI-driven traffic, denser optical networks, and modular serviceable subsea systems further amplify demand, positioning underwater connectors as critical components in the evolving subsea ecosystem.
| Market Scope | |
|---|---|
| Start Year | 2025 |
| Forecast Year | 2026-2035 |
| Start Value | $1.8 Billion |
| Forecast Value | $3.7 Billion |
| CAGR | 7.8% |
The electric connector segment captured 49.1% share in 2025. Subsea hubs, deepwater oil and gas systems, inspection-class robotics, and offshore wind installations rely on robust, ruggedized electrical connectors. Strong offshore activity in the U.S. is boosting investment in subsea power infrastructure, solidifying electric connectors as a leading segment while high-voltage dry-mate assemblies gain traction in floating wind and grid-tie systems.
The bulkhead connectors segment held a 38.8% share in 2025. Bulkhead connectors are essential for providing reliable power and data feedthroughs across subsea housing and control module boundaries. Manufacturers are focusing on corrosion-resistant, high-performance bulkhead designs with improved sealing, high power densities, and high data rates to meet evolving subsea requirements.
North America Underwater Connectors Market held a 38.6% share in 2025. Growth in the region is fueled by increasing submarine cable deployment, offshore wind projects, and investments in defense and energy programs, along with regulatory support and technological innovation in subsea systems.
Key players in the Global Underwater Connectors Market include TE Connectivity, Amphenol Corp., MacArtney, Fischer Connectors, Smiths Group Plc, Molex, Glenair Inc., Baker Hughes (GE Company LLC), Eaton Corporation, Hydro Group, and Teledyne. Companies in the underwater connectors market strengthen their positions through several strategic initiatives. They invest in R&D to enhance corrosion resistance, high-pressure tolerance, and multi-signal compatibility. Collaboration with energy, defense, and telecom clients ensures custom solutions for subsea projects. Firms expand manufacturing and service facilities near offshore hubs to improve delivery efficiency. Adoption of modular, serviceable designs and standardization across subsea platforms increases compatibility and reduces maintenance downtime. Strategic acquisitions and partnerships help broaden geographic reach, enhance product portfolios, and maintain competitive advantages in an increasingly complex and technologically demanding market.
Table of Contents
Chapter 1 Methodology and Scope
- 1.1 Market scope and definition
- 1.2 Research design
- 1.2.1 Research approach
- 1.2.2 Data collection methods
- 1.3 Data mining sources
- 1.3.1 Global
- 1.3.2 Regional/Country
- 1.4 Base estimates and calculations
- 1.4.1 Base year calculation
- 1.4.2 Key trends for market estimation
- 1.5 Primary research and validation
- 1.5.1 Primary sources
- 1.6 Forecast model
- 1.7 Research assumptions and limitations
Chapter 2 Executive summary
- 2.1 Industry 3600 synopsis
- 2.2 Key market trends
- 2.2.1 Product type trends
- 2.2.2 Mechanical structure trends
- 2.2.3 Mating methods trends
- 2.2.4 Material type trends
- 2.2.5 Connector shape trends
- 2.2.6 Depth rating trends
- 2.2.7 Voltage rating trends
- 2.2.8 Application trends
- 2.2.9 Regional trends
- 2.3 TAM Analysis, 2026-2035 (USD Million)
- 2.4 CXO perspectives: Strategic imperatives
- 2.4.1 Executive decision points
- 2.4.2 critical success factors
- 2.5 Future outlook and strategic recommendations
Chapter 3 Industry insights
- 3.1 Industry ecosystem analysis
- 3.1.1 Supplier landscape
- 3.1.2 Profit margin
- 3.1.3 Cost structure
- 3.1.4 Value addition at each stage
- 3.1.5 Factor affecting the value chain
- 3.1.6 Disruptions
- 3.2 Industry ecosystem analysis
- 3.3 Industry impact forces
- 3.3.1 Growth drivers
- 3.3.1.1 Rising offshore oil & gas deepwater operations
- 3.3.1.2 Expansion in subsea telecommunications infrastructure
- 3.3.1.3 Growth in offshore renewable energy integration & grid
- 3.3.1.4 Advancements in connector materials and sealing technologies
- 3.3.2 Pitfalls and challenges
- 3.3.2.1 High development and manufacturing costs
- 3.3.2.2 Complexities in sealing and high-voltage wet-mate connectors
- 3.3.3 Market opportunities
- 3.3.3.1 Advancements in connector materials and sealing technologies
- 3.3.3.2 Increasing adoption of remotely operated vehicles (ROVs)
- 3.3.1 Growth drivers
- 3.4 Growth potential analysis
- 3.5 Regulatory landscape
- 3.5.1 North America
- 3.5.2 Europe
- 3.5.3 Asia Pacific
- 3.5.4 Latin America
- 3.5.5 Middle East & Africa
- 3.6 Porter's analysis
- 3.7 PESTEL analysis
- 3.8 Technology and Innovation landscape
- 3.8.1 Current technological trends
- 3.8.2 Emerging technologies
- 3.9 Emerging Business Models
- 3.10 Compliance Requirements
- 3.11 Sustainability Measures
- 3.12 Consumer Sentiment Analysis
- 3.13 Patent and IP analysis
- 3.14 Geopolitical and trade dynamics
Chapter 4 Competitive landscape, 2025
- 4.1 Introduction
- 4.2 Company market share analysis
- 4.2.1 By region
- 4.2.1.1 North America
- 4.2.1.2 Europe
- 4.2.1.3 Asia Pacific
- 4.2.1.4 Latin America
- 4.2.1.5 Middle East & Africa
- 4.2.2 Market concentration analysis
- 4.2.1 By region
- 4.3 Competitive benchmarking of key players
- 4.3.1 Financial performance comparison
- 4.3.1.1 Revenue
- 4.3.1.2 Profit margin
- 4.3.1.3 R&D
- 4.3.2 Product portfolio comparison
- 4.3.2.1 Product range breadth
- 4.3.2.2 Technology
- 4.3.2.3 Innovation
- 4.3.3 Geographic presence comparison
- 4.3.3.1 Global footprint analysis
- 4.3.3.2 Service network coverage
- 4.3.3.3 Market penetration by region
- 4.3.4 Competitive positioning matrix
- 4.3.4.1 Leaders
- 4.3.4.2 Challengers
- 4.3.4.3 Followers
- 4.3.4.4 Niche players
- 4.3.5 Strategic outlook matrix
- 4.3.1 Financial performance comparison
- 4.4 Key developments, 2021-2024
- 4.4.1 Mergers and acquisitions
- 4.4.2 Partnerships and collaborations
- 4.4.3 Technological advancements
- 4.4.4 Expansion and investment strategies
- 4.4.5 Sustainability initiatives
- 4.4.6 Digital transformation initiatives
- 4.5 Emerging/ startup competitors landscape
Chapter 5 Market Estimates and Forecast, By Product Type, 2022 - 2035 (USD Million)
- 5.1 Key trends
- 5.2 Electrical Connectors
- 5.3 Optical Connectors
- 5.4 Hybrid Connectors
Chapter 6 Market Estimates and Forecast, By Mechanical Structure, 2022 - 2035 (USD Million)
- 6.1 Key trends
- 6.2 Bulkhead Connectors (Panel-Mount)
- 6.3 Inline Connectors (Cable-to-Cable)
- 6.4 Penetrator Connectors (Pressure Hull Feedthrough)
- 6.5 Others
Chapter 7 Market Estimates and Forecast, By Mating Method, 2022 - 2035 (USD Million)
- 7.1 Key trends
- 7.2 Wet-Mate Connectors
- 7.3 Dry-Mate Connectors
Chapter 8 Market Estimates and Forecast, By Material Type, 2022 - 2035 (USD Million)
- 8.1 Key trends
- 8.2 Metals
- 8.2.1 Stainless steel
- 8.2.2 Titanium
- 8.3 Composites
- 8.4 Plastics & Polymers
- 8.5 Rubber
Chapter 9 Market Estimates and Forecast, By Connector Shape, 2022 - 2035 (USD Million)
- 9.1 Key trends
- 9.2 Circular Connectors
- 9.3 Rectangular Connectors
- 9.4 Others
- 9.4.1 Oval
- 9.4.2 D-type
- 9.4.3 Custom
Chapter 10 Market Estimates and Forecast, By Depth Rating, 2022 - 2035 (USD Million)
- 10.1 Key trends
- 10.2 Shallow Water (<200m)
- 10.3 Medium Depth (200-1,000m)
- 10.4 Deep Water (1,000-3,000m)
- 10.5 Ultra-Deep Water (>3,000m / >10,000m)
Chapter 11 Market Estimates and Forecast, By Voltage Rating, 2022 - 2035 (USD Million)
- 11.1 Key trends
- 11.2 Low Voltage (<1,000V)
- 11.3 Medium Voltage (1,000V - 10kV)
- 11.4 High Voltage (>10kV)
Chapter 12 Market Estimates and Forecast, By Application, 2022 - 2035 (USD Million)
- 12.1 Key trends
- 12.2 Offshore Oil & Gas
- 12.3 Subsea Telecommunications
- 12.4 Defense & Naval
- 12.5 Oceanographic Research
- 12.6 Renewable Energy
- 12.7 Others
- 12.7.1 Subsea Mining
- 12.7.2 Aquaculture
- 12.7.3 ROVs
Chapter 13 Market Estimates and Forecast, By Region, 2022 - 2035 (USD Million)
- 13.1 Key trends
- 13.2 North America
- 13.2.1 U.S.
- 13.2.2 Canada
- 13.3 Europe
- 13.3.1 Germany
- 13.3.2 UK
- 13.3.3 France
- 13.3.4 Spain
- 13.3.5 Italy
- 13.3.6 Netherlands
- 13.4 Asia Pacific
- 13.4.1 China
- 13.4.2 India
- 13.4.3 Japan
- 13.4.4 Australia
- 13.4.5 South Korea
- 13.5 Latin America
- 13.5.1 Brazil
- 13.5.2 Mexico
- 13.5.3 Argentina
- 13.6 Middle East and Africa
- 13.6.1 South Africa
- 13.6.2 Saudi Arabia
- 13.6.3 UAE
Chapter 14 Company Profiles
- 14.1 Amphenol Corp.
- 14.2 Baker Hughes (GE Company LLC)
- 14.3 Eaton Corporation
- 14.4 Fischer Connectors
- 14.5 Glenair Inc.
- 14.6 Hydro Group
- 14.7 MacArtney
- 14.8 Molex
- 14.9 Smiths Group Plc
- 14.10 TE Connectivity
- 14.11 Teledyne


