


 |
市场调查报告书
商品编码
1936677
石蜡抑制剂市场机会、成长要素、产业趋势分析及2026年至2035年预测Paraffin Inhibitors Market Opportunity, Growth Drivers, Industry Trend Analysis, and Forecast 2026 - 2035 |
||||||
2025 年全球石蜡抑制剂市场价值为 7.555 亿美元,预计到 2035 年将达到 12 亿美元,年复合成长率为 4.4%。
市场扩张与全球上游油气探勘和生产活动的稳定成长密切相关。石蜡抑制剂透过抑制管道和生产设施内蜡的形成,在维持不间断流动方面发挥关键作用,有助于防止阻塞和降低运作效率。随着原油产量的持续成长,对高效能流动保障解决方案的需求也日益增长。这些化学物质透过抑制蜡结晶、减少其在管道表面的黏附以及维持稳定的输送条件来发挥作用。它们的使用可减少维护需求和停机时间,提高运作可靠性并延长设备使用寿命。石蜡抑制剂的设计使其与多种原油成分相容,并可在各种温度和压力条件下发挥作用。在日益严格的环境法规以及行业对更高性能和更低化学品消耗的需求的推动下,环保配方的开发正在推动市场成长。
| 市场覆盖范围 | |
|---|---|
| 开始年份 | 2025 |
| 预测年份 | 2026-2035 |
| 起始值 | 7.555亿美元 |
| 预测金额 | 12亿美元 |
| 复合年增长率 | 4.4% |
预计到2025年,聚甲基丙烯酸烷基酯类抑制剂将占据30.8%的市场份额,并在2035年之前以4.3%的复合年增长率成长。这类抑制剂因其优异的蜡溶解性和热稳定性而被广泛应用,使其适用于严苛的操作环境。市场创新日益专注于在保持性能效率的同时,提高其生物降解性和降低环境影响。
2025年,溶剂型配方产品市占率达到41.5%,预计2026年至2035年将以4%的复合年增长率成长。这些配方产品因其快速起效和在蜡质控制方面卓有成效而备受欢迎。然而,製造商正在对其进行改进,以满足更严格的环境和安全要求,例如减少排放和永续性,同时保持其在高温、重载应用中的适用性。
预计北美石蜡抑制剂市场将持续保持强劲成长势头,2025年将占据25.8%的市场。该地区的需求得益于积极的探勘项目、成熟的生产设施以及对先进蜡管理解决方案的需求,这些因素共同推动了该地区在各种挑战性作业条件下的发展。此外,环境政策框架也在促进可生物降解抑制剂技术的研发和应用,从而为市场的持续成长动能做出了贡献。
目录
第一章调查方法和范围
第二章执行摘要
第三章业界考察
- 生态系分析
- 供应商情况
- 利润率
- 每个阶段的附加价值
- 影响价值链的因素
- 中断
- 产业影响因素
- 司机
- 产业潜在风险与挑战
- 市场机会
- 成长潜力分析
- 监管环境
- 北美洲
- 欧洲
- 亚太地区
- 拉丁美洲
- 中东和非洲
- 波特五力分析
- PESTEL 分析
- 价格趋势
- 按地区
- 按类型
- 未来市场趋势
- 科技与创新趋势
- 当前技术趋势
- 新兴技术
- 专利状态
- 贸易统计(HS编码)(註:仅提供主要国家的贸易统计)
- 主要进口国
- 主要出口国
- 永续性和环境方面
- 永续努力
- 减少废弃物策略
- 生产中的能源效率
- 环保倡议
- 考虑到碳足迹
第四章 竞争情势
- 介绍
- 公司市占率分析
- 按地区
- 北美洲
- 欧洲
- 亚太地区
- 拉丁美洲
- 中东和非洲
- 按地区
- 企业矩阵分析
- 主要市场公司的竞争分析
- 竞争定位矩阵
- 重大进展
- 併购
- 伙伴关係与合作
- 新产品发布
- 业务拓展计划
第五章 依化学品类型分類的市场估算与预测,2022-2035年
- 聚甲基丙烯酸烷基酯(PAMA)
- 乙烯-醋酸乙烯酯共聚物(EVA)
- 聚丙烯酸酯和烷基丙烯酸酯共聚物
- 改质聚羧酸盐
- 超支化聚酯
- 其他的
6. 依製剂类型分類的市场估算与预测,2022-2035 年
- 溶剂型配方
- 油溶性
- 水性製剂/水分散性製剂
- 固态剂型/缓释剂型
第七章 依功能分類的市场估计与预测,2022-2035年
- 晶体调节器
- 石蜡分散剂
- 流动改善剂
- 流动点降低剂
- 黏度降低剂
第八章 2022-2035年各细分市场的估计与预测
- 上游部门
- 中游产业
- 下游产业
第九章 按应用领域分類的市场估算与预测,2022-2035年
- 陆上
- 离岸
第十章 2022-2035年各地区市场估计与预测
- 北美洲
- 我们
- 加拿大
- 欧洲
- 德国
- 英国
- 法国
- 西班牙
- 义大利
- 其他欧洲地区
- 亚太地区
- 中国
- 印度
- 日本
- 澳洲
- 韩国
- 亚太其他地区
- 拉丁美洲
- 巴西
- 墨西哥
- 阿根廷
- 其他拉丁美洲地区
- 中东和非洲
- 沙乌地阿拉伯
- 南非
- 阿拉伯聯合大公国
- 其他中东和非洲地区
第十一章 公司简介
- Arkema
- Baker Hughes
- BASF SE
- BYK
- ChampionX
- Clariant
- Evonik Industries
- Nouryon
- SI Group, Inc.
- SLB
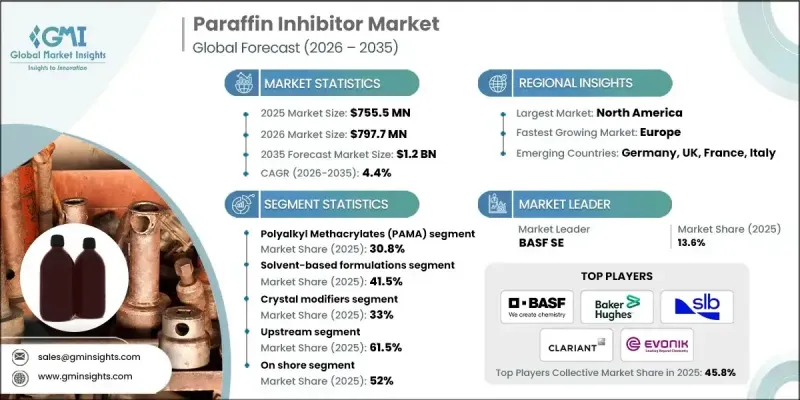
The Global Paraffin Inhibitors Market was valued at USD 755.5 million in 2025 and is estimated to grow at a CAGR of 4.4% to reach USD 1.2 billion by 2035.
Market expansion is tied to the steady increase in upstream oil and gas exploration and production activities worldwide. Paraffin inhibitors play a critical role in maintaining uninterrupted flow by limiting wax formation within pipelines and production equipment, which helps prevent blockages and operational inefficiencies. As crude oil output continues to rise, demand for effective flow assurance solutions is increasing. These chemicals work by disrupting wax crystallization, reducing adhesion to pipeline surfaces, and supporting stable transport conditions. Their use results in lower maintenance requirements, reduced downtime, improved operational reliability, and extended asset life. Paraffin inhibitors are suitable for a wide range of crude compositions and are designed to perform under varying temperature and pressure conditions. Ongoing market development is increasingly focused on environmentally responsible formulations, driven by tightening environmental regulations and industry demand for reduced chemical consumption with enhanced performance.
| Market Scope | |
|---|---|
| Start Year | 2025 |
| Forecast Year | 2026-2035 |
| Start Value | $755.5 Million |
| Forecast Value | $1.2 Billion |
| CAGR | 4.4% |
The polyalkyl methacrylates segment accounted for 30.8% share in 2025 and is expected to grow at a CAGR of 4.3% through 2035. These inhibitors are widely adopted due to their strong wax solubility and thermal stability, making them suitable for demanding operating environments. Market innovation is increasingly centered on improving biodegradability and reducing environmental impact while maintaining performance efficiency.
The solvent-based formulations segment held 41.5% share in 2025 and is forecast to grow at a CAGR of 4% from 2026 to 2035. These formulations remain popular due to their rapid action and proven effectiveness in wax control. However, manufacturers are adapting formulations to align with stricter environmental and safety requirements by lowering emissions and improving sustainability while retaining suitability for high-temperature and heavy-duty applications.
North America Paraffin Inhibitors Market accounted for 25.8% share in 2025 and continues to experience strong growth. Regional demand is supported by active exploration programs, mature production assets, and challenging operating conditions that require advanced wax management solutions. Environmental policy frameworks are also encouraging the development and adoption of biodegradable inhibitor technologies, contributing to sustained market momentum.
Key companies operating in the Global Paraffin Inhibitors Market include BASF SE, Baker Hughes, Arkema, Clariant, ChampionX, Evonik Industries, Nouryon, BYK, SI Group, Inc., and SLB. Companies in the paraffin inhibitors market are strengthening their market position by investing in advanced chemical formulations that enhance performance while meeting environmental standards. Manufacturers are prioritizing biodegradable and low-toxicity solutions to align with regulatory expectations and sustainability goals. Strategic collaborations with oilfield service providers and energy producers are expanding market reach and improving product integration. Firms are also focusing on optimizing dosage efficiency to reduce operating costs for end users. Capacity expansions, regional production optimization, and long-term supply agreements are being used to ensure consistent availability. Continued investment in research and field testing is helping companies improve reliability, adapt products to diverse operating conditions, and maintain a competitive edge.
Table of Contents
Chapter 1 Methodology & Scope
- 1.1 Market scope and definition
- 1.2 Research design
- 1.2.1 Research approach
- 1.2.2 Data collection methods
- 1.3 Data mining sources
- 1.3.1 Global
- 1.3.2 Regional/Country
- 1.4 Base estimates and calculations
- 1.4.1 Base year calculation
- 1.4.2 Key trends for market estimation
- 1.5 Primary research and validation
- 1.5.1 Primary sources
- 1.6 Forecast model
- 1.7 Research assumptions and limitations
Chapter 2 Executive Summary
- 2.1 Industry 3600 synopsis
- 2.2 Key market trends
- 2.2.1 Regional
- 2.2.2 Chemistry type
- 2.2.3 Formulation type
- 2.2.4 Function
- 2.2.5 Operation
- 2.2.6 Application
- 2.3 TAM Analysis, 2026-2035
- 2.4 CXO perspectives: Strategic imperatives
- 2.4.1 Executive decision points
- 2.4.2 Critical success factors
- 2.5 Future Outlook and Strategic Recommendations
Chapter 3 Industry Insights
- 3.1 Industry ecosystem analysis
- 3.1.1 Supplier landscape
- 3.1.2 Profit margin
- 3.1.3 Value addition at each stage
- 3.1.4 Factor affecting the value chain
- 3.1.5 Disruptions
- 3.2 Industry impact forces
- 3.2.1 Growth drivers
- 3.2.2 Industry pitfalls and challenges
- 3.2.3 Market opportunities
- 3.3 Growth potential analysis
- 3.4 Regulatory landscape
- 3.4.1 North America
- 3.4.2 Europe
- 3.4.3 Asia Pacific
- 3.4.4 Latin America
- 3.4.5 Middle East & Africa
- 3.5 Porter's analysis
- 3.6 PESTEL analysis
- 3.7 Price trends
- 3.7.1 By region
- 3.7.2 By type
- 3.8 Future market trends
- 3.9 Technology and Innovation landscape
- 3.9.1 Current technological trends
- 3.9.2 Emerging technologies
- 3.10 Patent Landscape
- 3.11 Trade statistics (HS code) ( Note: the trade statistics will be provided for key countries only)
- 3.11.1 Major importing countries
- 3.11.2 Major exporting countries
- 3.12 Sustainability and environmental aspects
- 3.12.1 Sustainable practices
- 3.12.2 Waste reduction strategies
- 3.12.3 Energy efficiency in production
- 3.12.4 Eco-friendly initiatives
- 3.13 Carbon footprint consideration
Chapter 4 Competitive Landscape, 2025
- 4.1 Introduction
- 4.2 Company market share analysis
- 4.2.1 By region
- 4.2.1.1 North America
- 4.2.1.2 Europe
- 4.2.1.3 Asia Pacific
- 4.2.1.4 LATAM
- 4.2.1.5 MEA
- 4.2.1 By region
- 4.3 Company matrix analysis
- 4.4 Competitive analysis of major market players
- 4.5 Competitive positioning matrix
- 4.6 Key developments
- 4.6.1 Mergers & acquisitions
- 4.6.2 Partnerships & collaborations
- 4.6.3 New Product Launches
- 4.6.4 Expansion Plans
Chapter 5 Market Estimates and Forecast, By Chemistry Type, 2022-2035 (USD Million) (Kilo Tons)
- 5.1 Key trends
- 5.2 Polyalkyl methacrylates (PAMA)
- 5.3 Ethylene-vinyl acetate (EVA) copolymers
- 5.4 Polyacrylates & alkyl acrylate copolymers
- 5.5 Modified polycarboxylates
- 5.6 Hyperbranched polyester
- 5.7 Others
Chapter 6 Market Estimates and Forecast, By Formulation Type, 2022-2035 (USD Million) (Kilo Tons)
- 6.1 Key trends
- 6.2 Solvent-based formulations
- 6.3 Oil-soluble
- 6.4 Aqueous-based/water-dispersible
- 6.5 Solid/controlled-release formulations
Chapter 7 Market Estimates and Forecast, By Function, 2022-2035 (USD Million) (Kilo Tons)
- 7.1 Key trends
- 7.2 Crystal modifiers
- 7.3 Paraffin dispersants
- 7.4 Flow improvers
- 7.5 Pour point depressants
- 7.6 Viscosity reducers
Chapter 8 Market Estimates and Forecast, By Operation, 2022-2035 (USD Million) (Kilo Tons)
- 8.1 Key trends
- 8.2 Upstream
- 8.3 Midstream
- 8.4 Downstream
Chapter 9 Market Estimates and Forecast, By Application, 2022-2035 (USD Million) (Kilo Tons)
- 9.1 Key trends
- 9.2 Onshore
- 9.3 Offshore
Chapter 10 Market Estimates and Forecast, By Region, 2022-2035 (USD Million) (Kilo Tons)
- 10.1 Key trends
- 10.2 North America
- 10.2.1 U.S.
- 10.2.2 Canada
- 10.3 Europe
- 10.3.1 Germany
- 10.3.2 UK
- 10.3.3 France
- 10.3.4 Spain
- 10.3.5 Italy
- 10.3.6 Rest of Europe
- 10.4 Asia Pacific
- 10.4.1 China
- 10.4.2 India
- 10.4.3 Japan
- 10.4.4 Australia
- 10.4.5 South Korea
- 10.4.6 Rest of Asia Pacific
- 10.5 Latin America
- 10.5.1 Brazil
- 10.5.2 Mexico
- 10.5.3 Argentina
- 10.5.4 Rest of Latin America
- 10.6 Middle East and Africa
- 10.6.1 Saudi Arabia
- 10.6.2 South Africa
- 10.6.3 UAE
- 10.6.4 Rest of Middle East and Africa
Chapter 11 Company Profiles
- 11.1 Arkema
- 11.2 Baker Hughes
- 11.3 BASF SE
- 11.4 BYK
- 11.5 ChampionX
- 11.6 Clariant
- 11.7 Evonik Industries
- 11.8 Nouryon
- 11.9 SI Group, Inc.
- 11.10 SLB
