


 |
市场调查报告书
商品编码
1959272
ADAS模拟市场机会、成长要素、产业趋势分析及2026年至2035年预测ADAS Simulation Market Opportunity, Growth Drivers, Industry Trend Analysis, and Forecast 2026 - 2035 |
||||||
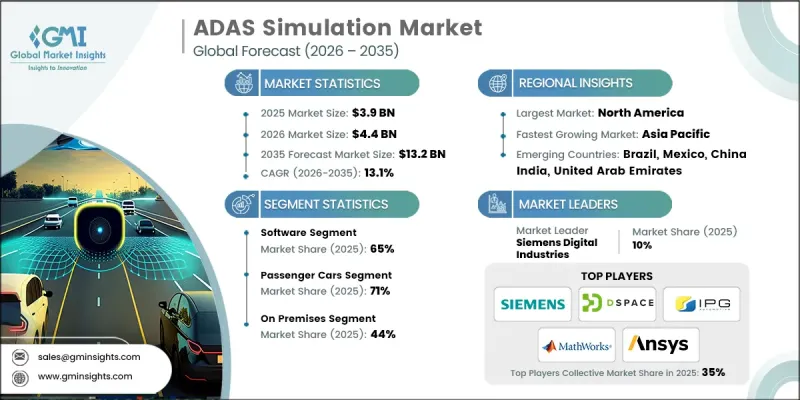
2025 年全球 ADAS 模拟市场价值 39 亿美元,预计到 2035 年将达到 132 亿美元,年复合成长率为 13.1%。
高阶驾驶辅助系统 (ADAS) 模拟已成为现代汽车开发的重要支柱,它提供高度复杂的虚拟环境,能够精确地再现真实世界的驾驶条件。该市场涵盖整合软体平台、硬体在环 (HIL) 系统以及为汽车製造商和旅游技术公司提供的专业工程服务,用于检验ADAS 的性能和安全性。模拟技术已从有限的功能测试发展到先进的数位双胞胎生态系统,能够精确且有效率地再现数百万英里的虚拟驾驶。这一转变显着降低了对物理原型的依赖,同时缩短了开发週期。随着车辆自动化变得日益复杂,模拟平台在检验感知演算法、感测器融合逻辑和即时决策系统方面发挥核心作用。因此,ADAS 模拟市场被定位为一项关键的基础技术,能够推动安全且扩充性的自动驾驶技术的全球部署。
| 市场范围 | |
|---|---|
| 开始年份 | 2025 |
| 预测年份 | 2026-2035 |
| 起始值 | 39亿美元 |
| 预测金额 | 132亿美元 |
| 复合年增长率 | 13.1% |
法规需求、成本最佳化需求以及技术的快速发展正在加速ADAS模拟技术的应用。随着基于订阅的SaaSStart-Ups模式取代传统的资本密集型基础设施投资,市场正经历结构性转变。此前,250万美元至1500万美元的前期成本是新兴供应商和创新主导型出行新创公司进入市场的一大障碍。如今,云端原生模拟生态系统支援付费使用制的定价模式,企业只需每月支付1.5万美元至20万美元(具体费用取决于运算能力和功能整合),即可利用先进的测试框架。这种转变降低了财务门槛,同时扩大了企业级检验能力的取得途径。不断完善的车辆安全法规和日益严格的监控进一步提升了对持续且可扩展的调查方法的需求,从而增强了ADAS模拟市场的长期发展前景。
预计到2025年,软体领域将占据65%的市场份额,并在2026年至2035年间以13.7%的复合年增长率成长。这一主导地位得益于持续的平台增强、广泛的功能整合以及能够产生可持续收入的可扩展许可模式。目前,全面的软体工具链包括模拟引擎、场景建模系统、高阶感测器模拟、车辆动力学模组和身临其境型可视化框架,所有这些组件均已集成,可实现ADAS的全週期检验。授权模式多种多样,从入门级的基于模型的测试环境(年订阅费用约为每用户5万美元起)到提供即时硬体整合、云端可扩展性和AI赋能的场景自动化(年订阅费用超过每用户50万美元)的企业级平台,应有尽有。
预计到2025年,软体在环(SIL)领域将占据40%的市场份额,并在2035年之前以13.5%的复合年增长率成长。 调查方法能够在硬体部署之前,在虚拟环境中检验ADAS演算法,从而显着降低开发成本并缩短迭代周期。这些平台利用合成感测器输入和动态车辆模型,在高效能运算系统上运行复杂的ADAS堆迭。透过无需使用实体车辆即可进行大规模场景测试,SIL模拟有助于提高ADAS(进阶驾驶辅助系统)的开发效率、降低安全风险并缩短产品上市时间。
美国高级驾驶辅助系统(ADAS)模拟市场预计到2025年将达到11亿美元,并在2026年至2035年间以12.4%的复合年增长率成长。美国凭藉严格的车辆安全法规、不断扩展的联网汽车计画以及积极的法律规范,保持主导地位。美国拥有广泛的高速公路网络和多样化的出行环境,这促使製造商加强对先进自动化功能的检验。因此,需要对复杂的交通场景进行广泛的仿真,以满足合规标准并确保效能可靠性。众多汽车原始设备製造商(OEM)、半导体创新公司和自动Start-Ups新创企业的强大实力,进一步巩固了美国在ADAS模拟领域的领先地位。
目录
第一章:调查方法
第二章执行摘要
第三章业界考察
- 生态系分析
- 供应商情况
- 利润率分析
- 成本结构
- 每个阶段增加的价值
- 影响价值链的因素
- 中断
- 影响产业的因素
- 促进因素
- 政府正逐步收紧安全法规。
- 降低物理测试成本的必要性
- 加快ADAS的开发进度
- 自动驾驶汽车研发进展
- 人工智慧和感测器融合领域的技术进步
- 产业潜在风险与挑战
- 仿真平台所需的初始投资很高。
- 平台之间缺乏标准化
- 物理上精确的感测器建模的复杂性
- 技术纯熟劳工短缺
- 市场机会
- 模拟即服务 (SaaS)经营模式
- 进入新兴的自动驾驶汽车市场
- 亚太地区市场成长
- 与生成式人工智慧整合以创建场景
- V2X(车联网)仿真
- 促进因素
- 成长潜力分析
- 监理情势
- 北美洲
- 美国联邦安全法规与ADAS实施指南
- 加拿大 - 连网和自动驾驶汽车安全框架 (CASF)
- 欧洲
- 德国与欧盟的智慧交通系统与国家倡议
- 英国—脱欧后ADAS系统的柔软性
- 法国——国家ADAS测试和智慧交通系统战略
- 义大利——智慧交通系统试点计画和智慧基础设施
- 亚太地区
- 中国工信部C-V2X指令与标准
- 印度—新兴的ADAS和汽车互联法规
- 日本——智慧交通系统连结性与频率政策
- 澳洲—技术中立的智慧交通系统政策
- LATAM
- 墨西哥 - NOM 汽车安全标准
- 阿根廷 - 国家交通法 24.449
- 中东和非洲
- 南非共和国 - 道路交通法(1996 年)
- 沙乌地阿拉伯—交通运输法律与2030愿景交通运输倡议
- 北美洲
- 波特的分析
- PESTEL 分析
- 科技与创新趋势
- 当前技术趋势
- 基于物理的感测器模拟技术的进展
- 人工智慧和机器学习的融合
- 用于场景创建的生成式人工智慧
- 新兴技术
- 即时仿真功能
- 数位双胞胎技术
- 云端原生模拟平台
- 当前技术趋势
- 专利分析
- 主要专利趋势
- 技术创新的关键领域
- 主要企业提交的专利申请
- 新兴智慧财产权策略
- 价格分析
- 软体许可模式
- 订阅式定价
- 工程服务定价结构
- 总拥有成本 (TCO) 分析
- 使用案例和成功案例
- OEM 应用案例
- 一级供应商的应用案例
- 技术开发人员的应用案例
- 永续性和环境方面
- 永续实践
- 减少废弃物策略
- 生产中的能源效率
- 具有环保意识的倡议
- 碳足迹考量
- OEM和第一级供应商采用成熟度指数
第四章 竞争情势
- 介绍
- 企业市占率分析
- 北美洲
- 欧洲
- 亚太地区
- 拉丁美洲
- 中东和非洲
- 主要市场公司的竞争分析
- 竞争定位矩阵
- 战略展望矩阵
- 主要进展
- 併购
- 伙伴关係与合作
- 新产品发布
- 业务拓展计划及资金筹措
第五章 市场估算与预测:依产品类型划分,2022-2035年
- 软体
- 模拟软体平台
- 应用软体
- 感测器模拟软体
- 场景生成工具
- D/基于物理的建模工具
- 服务
- 专业服务
- 託管服务
第六章 市场估价与预测:依车辆类型划分,2022-2035年
- 搭乘用车
- 掀背车车
- SUV
- 轿车
- 商用车辆
- 轻型商用车(LCV)
- 中型商用车(MCV)
- 重型商用车(HCV)
第七章 市场估价与预测:依ADAS功能划分,2022-2035年
- 主动式车距维持定速系统(ACC)
- 车道维持/偏离预警系统
- 自动停车辅助
- 防碰撞系统
- 交通壅塞辅助功能
- 高速公路自动驾驶/完全自动驾驶
- 盲点侦测系统
- 其他的
第八章 市场估计与预测:模拟法,2022-2035年
- 模型在环(MIL)
- 软体在环(SIL)
- 处理器在环(PIL)
- 硬体在环(HIL)
- 驱动在环(DIL)
第九章 市场估算与预测:依部署类型划分,2022-2035年
- 现场
- 基于云端的
- 杂交种
第十章 市场估价与预测:依最终用途划分,2022-2035年
- 汽车製造商
- 一级和二级供应商
- 技术提供者和软体开发商
- 半导体和硬体供应商
- 其他的
第十一章 市场估价与预测:按地区划分,2022-2035年
- 北美洲
- 我们
- 加拿大
- 欧洲
- 德国
- 英国
- 法国
- 义大利
- 西班牙
- 俄罗斯
- 荷兰
- 瑞典
- 丹麦
- 波兰
- 亚太地区
- 中国
- 印度
- 日本
- 澳洲
- 韩国
- 新加坡
- 泰国
- 印尼
- 越南
- 拉丁美洲
- 巴西
- 墨西哥
- 阿根廷
- 哥伦比亚
- 中东和非洲
- 南非
- 沙乌地阿拉伯
- 阿拉伯聯合大公国
- 以色列
第十二章:公司简介
- 世界玩家
- Ansys
- Applied Intuition
- AVL List
- dSPACE
- Foretellix
- IPG Automotive
- MathWorks
- MSC Software
- Siemens Digital Industries
- Vector Informatik
- 本地球员
- AIMotive
- Baidu
- CARLA
- Cognata
- ETAS
- Hexagon
- NVIDIA
- rFpro
- TASS International
- VI-grade
- 新兴企业和技术基础设施公司
- Luminar Technologies
- Metamoto
- Oxbotica
- Parallel Domain
- Wayve
The Global ADAS Simulation Market was valued at USD 3.9 billion in 2025 and is estimated to grow at a CAGR of 13.1% to reach USD 13.2 billion by 2035.
Advanced Driver Assistance Systems simulation has become a foundational pillar of modern automotive development, delivering highly sophisticated virtual environments that accurately mirror real-world driving conditions. The market encompasses integrated software platforms, hardware-in-the-loop systems, and specialized engineering services that support automakers and mobility technology firms in validating ADAS performance and safety. Over time, simulation capabilities have evolved from limited functional testing toward advanced digital twin ecosystems capable of recreating millions of virtual driving miles with high precision and efficiency. This transformation significantly reduces reliance on physical prototypes while accelerating development timelines. As vehicle automation grows increasingly complex, simulation platforms are playing a central role in verifying perception algorithms, sensor fusion logic, and real-time decision systems. The ADAS simulation market is therefore positioned as a critical enabler of safe and scalable autonomous mobility deployment worldwide.
| Market Scope | |
|---|---|
| Start Year | 2025 |
| Forecast Year | 2026-2035 |
| Start Value | $3.9 Billion |
| Forecast Value | $13.2 Billion |
| CAGR | 13.1% |
Adoption of ADAS simulation technologies is accelerated by regulatory mandates, cost optimization requirements, and rapid technological progress. The market is experiencing structural change as subscription-based SaaS deployment models replace traditional capital-intensive infrastructure investments. Historically, upfront expenditures ranging from USD 2.5 million to USD 15 million have limited accessibility for emerging suppliers and innovation-driven mobility startups. Cloud-native simulation ecosystems now support pay-per-use pricing structures, allowing organizations to leverage advanced testing frameworks through monthly subscription fees typically ranging from USD 15,000 to USD 200,000, depending on computational capacity and feature integration. This transition reduces financial barriers while expanding access to enterprise-grade validation capabilities. Evolving vehicle safety regulations and increased oversight are further reinforcing the need for continuous, scalable testing methodologies, strengthening the long-term outlook of the ADAS simulation market.
In 2025, the software segment accounted for 65% share and is forecast to grow at a CAGR of 13.7% between 2026 and 2035. This segment leads due to continuous platform enhancement, broader feature integration, and scalable licensing models that generate recurring revenue streams. Comprehensive software toolchains now include simulation engines, scenario modeling systems, advanced sensor emulation, vehicle dynamics modules, and immersive visualization frameworks that collectively enable full-cycle ADAS validation. Licensing structures vary widely, with annual subscriptions starting around USD 50,000 per seat for entry-level model-based testing environments and exceeding USD 500,000 per seat for enterprise-grade platforms offering real-time hardware integration, cloud scalability, and AI-enabled scenario automation.
The software-in-the-loop segment held a 40% share in 2025 and is expected to grow at a CAGR of 13.5% through 2035. Software-in-the-loop methodologies enable validation of ADAS algorithms within virtual environments prior to hardware deployment, significantly reducing development expenses and shortening iteration cycles. These platforms execute complex ADAS stacks on high-performance computing systems using synthetic sensor inputs and dynamic vehicle models. By enabling large-scale scenario testing without the need for physical vehicles, SIL simulation enhances development efficiency, mitigates safety risks, and accelerates time-to-market for advanced driver assistance technologies.
United States ADAS Simulation Market generated USD 1.1 billion in 2025 and is projected to grow at a CAGR of 12.4% from 2026 to 2035. The country maintains a leading global position due to stringent vehicle safety frameworks, expanding connected vehicle initiatives, and active regulatory supervision. Driving conditions are characterized by high-speed road networks and diverse mobility environments prompting manufacturers to intensify validation of advanced automation features. As a result, extensive simulation of complex traffic scenarios is required to meet compliance standards and ensure performance reliability. The strong presence of automotive OEMs, semiconductor innovators, and autonomous mobility startups further strengthens the United States' dominance in the ADAS simulation landscape.
Major companies operating in the Global ADAS Simulation Market include NVIDIA, Ansys, Siemens Digital Industries Software, dSPACE, IPG Automotive, MathWorks, Vector Informatik, Applied Intuition, Foretellix, and rFpro. Companies in the ADAS Simulation Market are reinforcing their competitive position through continuous innovation in scenario generation, AI-driven validation tools, and high-fidelity digital twin environments. Strategic partnerships with automotive OEMs and semiconductor manufacturers enable co-development of customized simulation frameworks tailored to next-generation vehicle architectures. Many vendors are expanding cloud infrastructure capabilities to support scalable, subscription-based service delivery models. Investment in real-time hardware integration and automated regression testing tools further enhances platform value. Additionally, companies prioritize interoperability with existing development toolchains, ensuring seamless integration across design, testing, and validation workflows while strengthening long-term enterprise relationships.
Table of Contents
Chapter 1 Methodology
- 1.1 Research approach
- 1.2 Quality commitments
- 1.3 Research trail and confidence scoring
- 1.3.1 Research trail components
- 1.3.2 Scoring components
- 1.4 Data collection
- 1.4.1 Partial list of primary sources
- 1.5 Data mining sources
- 1.5.1 Paid sources
- 1.6 Best estimates and calculations
- 1.6.1 Base year calculation for any one approach
- 1.7 Forecast model
- 1.8 Research transparency addendum
Chapter 2 Executive Summary
- 2.1 Industry 360° synopsis, 2022 - 2035
- 2.2 Key market trends
- 2.2.1 Regional
- 2.2.2 Offering
- 2.2.3 Vehicles
- 2.2.4 ADAS Features
- 2.2.5 Simulation
- 2.2.6 Deployment Mode
- 2.2.7 End Use
- 2.3 TAM Analysis, 2026-2035
Chapter 3 Industry Insights
- 3.1 Industry ecosystem analysis
- 3.1.1 Supplier landscape
- 3.1.2 Profit margin analysis
- 3.1.3 Cost structure
- 3.1.4 Value addition at each stage
- 3.1.5 Factor affecting the value chain
- 3.1.6 Disruptions
- 3.2 Industry impact forces
- 3.2.1 Growth drivers
- 3.2.1.1 Rising stringency in government safety regulations
- 3.2.1.2 Need to reduce physical testing costs
- 3.2.1.3 Accelerated development timelines for ADAS
- 3.2.1.4 Growth in autonomous vehicle development
- 3.2.1.5 Technological advancements in AI & sensor fusion
- 3.2.2 Industry pitfalls and challenges
- 3.2.2.1 High initial investment for simulation platforms
- 3.2.2.2 Lack of standardization across platforms
- 3.2.2.3 Physics-accurate sensor modeling complexity
- 3.2.2.4 Skilled workforce shortage
- 3.2.3 Market opportunities
- 3.2.3.1 Simulation-as-a-service (SaaS) business models
- 3.2.3.2 Expansion into emerging autonomous vehicle markets
- 3.2.3.3 Regional market growth in Asia Pacific
- 3.2.3.4 Integration with generative AI for scenario creation
- 3.2.3.5 V2X (vehicle-to-everything) simulation
- 3.2.1 Growth drivers
- 3.3 Growth potential analysis
- 3.4 Regulatory landscape
- 3.4.1 North America
- 3.4.1.1 US- Federal safety rules & ADAS deployment guidance
- 3.4.1.2 Canada - Safety framework for connected & automated vehicles (CASF)
- 3.4.2 Europe
- 3.4.2.1 Germany- EU ITS & national initiatives
- 3.4.2.2 UK- Post-Brexit ADAS flexibility
- 3.4.2.3 France- National ADAS testing & ITS strategy
- 3.4.2.4 Italy- ITS pilots & smart infrastructure
- 3.4.3 Asia Pacific
- 3.4.3.1 China- MIIT C-V2X mandates & standards
- 3.4.3.2 India- Emerging ADAS & automotive connectivity regulations
- 3.4.3.3 Japan- ITS connect & spectrum policy
- 3.4.3.4 Australia- Technology neutral ITS policies
- 3.4.4 LATAM
- 3.4.4.1 Mexico- NOM vehicle safety standards
- 3.4.4.2 Argentina- National traffic law 24.449
- 3.4.5 MEA
- 3.4.5.1 South Africa- National road traffic act (1996)
- 3.4.5.2 Saudi Arabia- Traffic law & vision 2030 transport initiatives
- 3.4.1 North America
- 3.5 Porter’s analysis
- 3.6 PESTEL analysis
- 3.7 Technology and innovation landscape
- 3.7.1 Current technological trends
- 3.7.1.1 Physics-based sensor simulation advances
- 3.7.1.2 AI & machine learning integration
- 3.7.1.3 Generative AI for scenario creation
- 3.7.2 Emerging technologies
- 3.7.2.1 Real-time simulation capabilities
- 3.7.2.2 Digital twin technologies
- 3.7.2.3 Cloud-native simulation platforms
- 3.7.1 Current technological trends
- 3.8 Patent analysis
- 3.8.1 Key patent trends
- 3.8.2 Technology innovation hotspots
- 3.8.3 Patent filing by key players
- 3.8.4 Emerging IP strategies
- 3.9 Pricing analysis
- 3.9.1 Software licensing models
- 3.9.2 Subscription-based pricing
- 3.9.3 Engineering services pricing structures
- 3.9.4 Total cost of ownership (TCO) analysis
- 3.10 Use cases & success stories
- 3.10.1 OEM use cases
- 3.10.2 Tier-1 supplier use cases
- 3.10.3 Technology developer use cases
- 3.11 Sustainability and environmental aspects
- 3.11.1 Sustainable practices
- 3.11.2 Waste reduction strategies
- 3.11.3 Energy efficiency in production
- 3.11.4 Eco-friendly Initiatives
- 3.11.5 Carbon footprint considerations
- 3.12 OEM & Tier-1 Adoption Maturity Index
Chapter 4 Competitive Landscape, 2025
- 4.1 Introduction
- 4.2 Company market share analysis
- 4.2.1 North America
- 4.2.2 Europe
- 4.2.3 Asia Pacific
- 4.2.4 LATAM
- 4.2.5 MEA
- 4.3 Competitive analysis of major market players
- 4.4 Competitive positioning matrix
- 4.5 Strategic outlook matrix
- 4.6 Key developments
- 4.6.1 Mergers & acquisitions
- 4.6.2 Partnerships & collaborations
- 4.6.3 New product launches
- 4.6.4 Expansion plans and funding
Chapter 5 Market Estimates & Forecast, By Offering, 2022 - 2035 ($Bn)
- 5.1 Key trends
- 5.2 Software
- 5.2.1 Simulation software platforms
- 5.2.2 Application software
- 5.2.3 Sensor simulation software
- 5.2.4 Scenario generation tools
- 5.2.5 D/physics-based modeling tools
- 5.3 Services
- 5.3.1 Professional services
- 5.3.2 Managed services
Chapter 6 Market Estimates & Forecast, By Vehicles, 2022 - 2035 ($Bn)
- 6.1 Key trends
- 6.2 Passenger cars
- 6.2.1 Hatchbacks
- 6.2.2 SUV
- 6.2.3 Sedan
- 6.3 Commercial vehicles
- 6.3.1 Light commercial vehicles (LCVs)
- 6.3.2 Medium commercial vehicles (MCVs)
- 6.3.3 Heavy commercial vehicles (HCVs)
Chapter 7 Market Estimates & Forecast, By ADAS Features, 2022 - 2035 ($Bn)
- 7.1 Key trends
- 7.2 Adaptive cruise control (ACC)
- 7.3 Lane keeping/departure systems
- 7.4 Automated parking assist
- 7.5 Collision avoidance systems
- 7.6 Traffic jam assistance
- 7.7 Highway pilot/full self-driving
- 7.8 Blind spot detection
- 7.9 Others
Chapter 8 Market Estimates & Forecast, By Simulation, 2022 - 2035 ($Bn)
- 8.1 Key trends
- 8.2 Model-in-the-loop (MIL)
- 8.3 Software-in-the-loop (SIL)
- 8.4 Processor-in-the-loop (PIL)
- 8.5 Hardware-in-the-loop (HIL)
- 8.6 Driver-in-the-loop (DIL)
Chapter 9 Market Estimates & Forecast, By Deployment Mode, 2022 - 2035 ($Bn)
- 9.1 Key trends
- 9.2 On premises
- 9.3 Cloud-based
- 9.4 Hybrid
Chapter 10 Market Estimates & Forecast, By End Use, 2022 - 2035 ($Bn)
- 10.1 Key trends
- 10.2 Automotive OEMs
- 10.3 Tier 1 & Tier 2 suppliers
- 10.4 Technology providers & software developers
- 10.5 Semiconductor & hardware vendors
- 10.6 Others
Chapter 11 Market Estimates & Forecast, By Region, 2022 - 2035 ($Bn)
- 11.1 Key trends
- 11.2 North America
- 11.2.1 US
- 11.2.2 Canada
- 11.3 Europe
- 11.3.1 Germany
- 11.3.2 UK
- 11.3.3 France
- 11.3.4 Italy
- 11.3.5 Spain
- 11.3.6 Russia
- 11.3.7 Netherlands
- 11.3.8 Sweden
- 11.3.9 Denmark
- 11.3.10 Poland
- 11.4 Asia Pacific
- 11.4.1 China
- 11.4.2 India
- 11.4.3 Japan
- 11.4.4 Australia
- 11.4.5 South Korea
- 11.4.6 Singapore
- 11.4.7 Thailand
- 11.4.8 Indonesia
- 11.4.9 Vietnam
- 11.5 Latin America
- 11.5.1 Brazil
- 11.5.2 Mexico
- 11.5.3 Argentina
- 11.5.4 Colombia
- 11.6 MEA
- 11.6.1 South Africa
- 11.6.2 Saudi Arabia
- 11.6.3 UAE
- 11.6.4 Israel
Chapter 12 Company Profiles
- 12.1 Global Players
- 12.1.1 Ansys
- 12.1.2 Applied Intuition
- 12.1.3 AVL List
- 12.1.4 dSPACE
- 12.1.5 Foretellix
- 12.1.6 IPG Automotive
- 12.1.7 MathWorks
- 12.1.8 MSC Software
- 12.1.9 Siemens Digital Industries
- 12.1.10 Vector Informatik
- 12.2 Regional Players
- 12.2.1 AIMotive
- 12.2.2 Baidu
- 12.2.3 CARLA
- 12.2.4 Cognata
- 12.2.5 ETAS
- 12.2.6 Hexagon
- 12.2.7 NVIDIA
- 12.2.8 rFpro
- 12.2.9 TASS International
- 12.2.10 VI-grade
- 12.3 Emerging Players & Technology Enablers
- 12.3.1 Luminar Technologies
- 12.3.2 Metamoto
- 12.3.3 Oxbotica
- 12.3.4 Parallel Domain
- 12.3.5 Wayve
 汽车ADAS感测器市场:按车辆类型、自动驾驶等级、感测器类型和应用划分-2026-2032年全球市场预测
 即时碰撞预测系统市场预测至 2034 年:全球分析(按组件、车辆类型、部署模式、最终用户和地区划分)驾驶员在环模拟器市场:按模拟器类型、车辆类型、部署模式、应用和最终用户划分 - 全球预测,2026-2032 年汽车ADAS标定工具市场(按车辆类型、部署模式、标定类型、系统类型、标定方法、最终用户和销售管道),全球预测,2026-2032年汽车ADAS校准设备市场(按设备类型、校准方法、车辆类型和分销管道划分),全球预测(2026-2032年)
 驾驶辅助收发器市场规模、份额和成长分析:按技术类型、车辆类型、应用、分销管道、地区和行业预测,2026-2033年
 驾驶辅助摄影机市场规模、份额和成长分析:按摄影机类型、技术、应用、最终用户、感测器整合和地区划分-2026-2033年产业预测
 自主半导体维护无人机市场分析及预测(至2035年):按类型、产品类型、服务、技术、组件、应用、最终用户、功能、安装类型、解决方案划分
 ADAS订阅市场机会、成长要素、产业趋势分析及2026年至2035年预测
 ADAS摄影机全球市场规模、份额、趋势和成长分析报告(2026-2034年)