


 |
市场调查报告书
商品编码
1959325
微出行换乘站市场机会、成长要素、产业趋势分析及预测(2026-2035年)Micromobility Swap Station Market Opportunity, Growth Drivers, Industry Trend Analysis, and Forecast 2026 - 2035 |
||||||
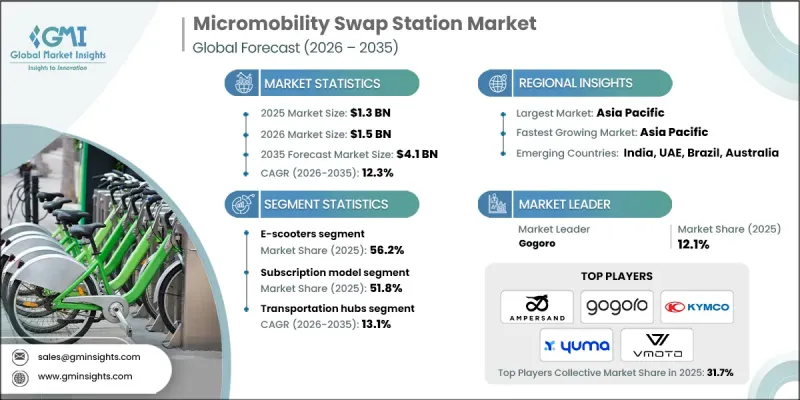
2025 年全球微出行换乘站市场价值 13 亿美元,预计到 2035 年将达到 41 亿美元,年复合成长率为 12.3%。
快速的都市化和智慧城市发展计画正在推动共用电动出行解决方案(例如电动Scooter、自行车和轻型机踏车)的普及。这些服务作为内燃机汽车的高效替代方案,正日益受到关注,帮助用户和车队营运商降低拥有成本、减少排放气体并改善最后一公里出行。电池更换基础设施解决了充电时间和车辆运作等营运难题,已成为实现这项转型的重要因素。虽然充电基础设施的匮乏最初限制了电动车的普及,但基础设施网路的扩展已显着提升了其可及性和便利性。市场参与企业正透过提供车辆、标准化电池和换电站网路的整合生态系统来巩固自身地位。与车队营运商和配送服务供应商的合作有助于实现无缝部署,提高资产利用率,并将电池更换定位为人口密集城市环境中扩充性且商业性吸引力的解决方案。
| 市场范围 | |
|---|---|
| 开始年份 | 2025 |
| 预测年份 | 2026-2035 |
| 起始金额 | 13亿美元 |
| 预测金额 | 41亿美元 |
| 复合年增长率 | 12.3% |
预计到2025年,电动Scooter市场将占据56.2%的市场份额,并创造7.377亿美元的收入。通勤、共享旅游和配送服务等领域的高日均使用率持续支撑着该细分市场的主导地位。由于其高运行频率和极低的停机时间,换电模式非常适合电动Scooter的使用模式。紧凑的电池设计、轻量化的结构和模组化架构进一步加速了换电网路的标准化和大规模部署,从而增强了商业和共用旅游营运商的需求。
订阅模式预计在2025年将占据51.8%的市场份额,并在2035年达到23亿美元。此模式透过提供可预测的成本和简化的支付结构,非常适合通勤者和专业骑乘者频繁使用电池的需求。单次换电通常只需花费约1美元,即可提供约50公里的续航里程。这使得订阅模式对于频繁使用电池的用户来说比按需付费模式更经济实惠。固定的月费或年费套餐降低了计量型复杂性,并为服务供应商提供了稳定的收入来源。
预计2025年,美国微型出行换电站市场规模将达2.097亿美元。在全美范围内,地方政府和相关人员都在积极支持换电站的建设,以提高共用电动出行网路的效率。电池更换可以减少充电延迟,提高车辆的运转率,这对于希望最大化日常利用率和收入的快递员和都市区骑乘者来说尤其重要。
目录
第一章:调查方法
第二章执行摘要
第三章业界考察
- 生态系分析
- 供应商情况
- 利润率
- 成本结构
- 每个阶段增加的价值
- 影响价值链的因素
- 中断
- 影响产业的因素
- 促进因素
- 智慧城市和城市交通倡议的发展
- 促进零排放交通的环境法规
- 共用微出行服务的扩展
- 快速便捷的电池充电需求日益增长。
- 产业潜在风险与挑战
- 设立外汇兑换站需要较高的初始资本投入。
- 电网连接和电力管理面临的挑战
- 市场机会
- 将换电站与再生能源来源结合
- 与微型出行车辆操作员和原始设备製造商建立合作关係
- 在交通枢纽和商业区安装交换站
- 促进因素
- 成长潜力分析
- 监理情势
- 北美洲
- 美国运输部(USDOT)
- 美国国家公路交通安全管理局(NHTSA)
- 加州空气资源委员会(CARB)
- 运输部
- 欧洲
- 欧盟委员会
- 联合国欧洲经济委员会汽车法规协调世界论坛(WP.29)
- 德国联邦汽车运输管理局(KBA)
- 英国运输部
- 法国生态系转型部
- 亚太地区
- 中华人民共和国工业与资讯化部(工信部)
- 印度公路运输与公路部(MoRTH)
- 新加坡陆路交通管理局(LTA)
- 澳洲国家运输委员会(NTC)
- 拉丁美洲
- 巴西国家陆路运输局(ANTT)
- 巴西汽车工业协会(ANFAVEA)
- 智利交通运输部
- 中东和非洲
- 杜拜道路与交通管理局(RTA)
- 阿布达比市政和交通运输部 (DMT)
- 沙乌地阿拉伯交通运输与物流部
- 南非共和国运输部
- 北美洲
- 波特的分析
- PESTEL 分析
- 科技与创新趋势
- 当前技术趋势
- 新兴技术
- 价格趋势
- 按地区
- 副产品
- 成本細項分析
- 永续性和环境影响
- 环境影响评估
- 社会影响和对当地社区的贡献
- 公司管治与企业社会责任
- 永续金融和投资趋势
- 基础建设发展状况与城市融合
- 城市基础设施评估框架
- 与智慧城市合作的机会
- 与公共交通的连接
- 数位基础设施需求
- 5G和物联网连接准备情况
- 布局和位置策略
- 位置标准与决策框架
- 地理资讯系统(GIS)分析
- 交通量与需求密度分布图
- 安全保障方面的考虑
- 加盟店与公司直营店模式的比较
- 输配电网路及电力基础设施分析
- 电网容量评估
- 并网要求
- 负载管理和尖峰用电调节
- 分散式能源资源的整合
- 电力品质和可靠性
- 案例研究
- 未来前景与机会
第四章 竞争情势
- 介绍
- 企业市占率分析
- 北美洲
- 欧洲
- 亚太地区
- 拉丁美洲
- 中东和非洲
- 主要市场公司的竞争分析
- 竞争定位矩阵
- 战略展望矩阵
- 主要进展
- 併购
- 伙伴关係与合作
- 新产品发布
- 业务拓展计划及资金筹措
第五章 市场估计与预测:依解法划分,2022-2035年
- 电池更换站
- 车辆交换站
第六章 市场估价与预测:依车辆类型划分,2022-2035年
- 电动Scooter
- 电动自行车
- 电动轻型轻型机踏车
- 其他的
第七章 市场估计与预测:依商业模式划分,2022-2035年
- 订阅模式
- 薪资互换
- 其他的
第八章 市场估算与预测:依发展阶段划分,2022-2035年
- 公共设施
- 商业设施
- 住宅区
- 交通枢纽
第九章 市场估计与预测:依应用领域划分,2022-2035年
- 共乘
- 配送/物流
- 个人通勤
- 旅游和休閒
- 其他的
第十章 市场估价与预测:依最终用途划分,2022-2035年
- 共用微出行服务提供者
- 个人消费者
- 车队营运商
- 政府/市政当局
第十一章 市场估价与预测:按地区划分,2022-2035年
- 北美洲
- 我们
- 加拿大
- 欧洲
- 德国
- 英国
- 法国
- 义大利
- 西班牙
- 捷克共和国
- 比利时
- 荷兰
- 亚太地区
- 中国
- 印度
- 日本
- 韩国
- 澳洲
- 新加坡
- 马来西亚
- 印尼
- 越南
- 泰国
- 拉丁美洲
- 巴西
- 墨西哥
- 阿根廷
- 哥伦比亚
- 中东和非洲
- 南非
- 沙乌地阿拉伯
- 阿拉伯聯合大公国
第十二章:公司简介
- 世界公司
- Ampersand
- Battery Smart
- Gogoro
- KYMCO
- Silence(ACCIONA)
- Spiro
- SUN Mobility
- Swobbee
- Tycorun
- Vmoto
- Yamaha ENYRING
- Yuma
- 当地公司
- BatteryPool
- ESmito
- Oyika
- Popwheels
- RACEnergy
- Selex Motors
- Swap Energi
- VoltUp
- 新兴企业
- ESWAP
- Okai
- Terra Tech
- Tiger New Energy
- Zembo
The Global Micromobility Swap Station Market was valued at USD 1.3 billion in 2025 and is estimated to grow at a CAGR of 12.3% to reach USD 4.1 billion by 2035.
Rapid urbanization and smart city development initiatives are driving the adoption of shared electric mobility solutions, including electric scooters, bicycles, and mopeds. These services are increasingly viewed as efficient alternatives to internal combustion engine vehicles, helping users and fleet operators lower ownership costs, reduce emissions, and improve last-mile connectivity. Battery swapping infrastructure has emerged as a critical enabler for this transition by addressing operational challenges linked to charging time and vehicle downtime. While limited charging availability initially constrained electric vehicle deployment, expanding infrastructure networks have significantly improved accessibility and usability. Market participants are strengthening their positions by offering integrated ecosystems that combine vehicles, standardized batteries, and swap station networks. Partnerships with fleet operators and delivery service providers support seamless adoption and improve asset utilization, positioning battery swapping as a scalable and commercially attractive solution within dense urban environments.
| Market Scope | |
|---|---|
| Start Year | 2025 |
| Forecast Year | 2026-2035 |
| Start Value | $1.3 Billion |
| Forecast Value | $4.1 Billion |
| CAGR | 12.3% |
The e-scooters segment accounted for 56.2% share and generated USD 737.7 million in 2025. Strong daily utilization rates across commuting, shared mobility, and delivery operations continue to support segment leadership. Battery swapping aligns well with e-scooter usage patterns due to minimal downtime requirements and high operational frequency. Compact battery design, lighter weight, and modular architecture further support standardization and large-scale deployment across swap networks, reinforcing demand from commercial and shared mobility operators.
The subscription-based pricing model held a 51.8% share in 2025 and is projected to reach USD 2.3 billion by 2035. This approach aligns with frequent battery usage patterns among commuters and professional riders by offering predictable costs and simplified payment structures. A single battery swap typically costs about USD 1 and provides an operating range of roughly 50 kilometers, making subscriptions more economical for high-frequency users compared to transactional pricing. Fixed monthly or annual plans reduce administrative complexity and support consistent revenue streams for service providers.
U.S. Micromobility Swap Station Market generated USD 209.7 million in 2025. Across the country, municipal authorities and private stakeholders are increasingly supporting swap station deployment to enhance the efficiency of shared electric mobility networks. Battery swapping reduces charging-related delays and improves vehicle availability, which is particularly important for delivery professionals and urban riders seeking to maximize daily usage and earnings.
Key companies active in the Global Micromobility Swap Station Market include Gogoro, SUN Mobility, Battery Smart, Swobbee, Yuma, Tycorun, Spiro, Ampersand, KYMCO, and Vmoto. Companies operating in the micromobility swap station market adopt focused strategies to strengthen market presence and competitive positioning. Many invest heavily in standardized battery platforms to ensure interoperability across multiple vehicle types and brands. Strategic collaborations with city authorities, fleet operators, and mobility service providers help accelerate network deployment and user adoption. Firms also expand station density in high-traffic urban areas to improve convenience and reduce range anxiety. Subscription-based pricing and bundled service offerings enhance customer retention and revenue stability.
Table of Contents
Chapter 1 Methodology
- 1.1 Research approach
- 1.2 Quality commitments
- 1.2.1 GMI AI policy & data integrity commitment
- 1.3 Research trail & confidence scoring
- 1.3.1 Research trail components
- 1.3.2 Scoring components
- 1.4 Data collection
- 1.4.1 Partial list of primary sources
- 1.5 Data mining sources
- 1.5.1 Paid sources
- 1.6 Base estimates and calculations
- 1.6.1 Base year calculation
- 1.7 Forecast model
- 1.8 Research transparency addendum
Chapter 2 Executive Summary
- 2.1 Industry 360° synopsis
- 2.2 Key market trends
- 2.2.1 Regional
- 2.2.2 Solution
- 2.2.3 Vehicle
- 2.2.4 Business Model
- 2.2.5 Deployment
- 2.2.6 Application
- 2.2.7 End Use
- 2.3 TAM analysis, 2026-2035
- 2.4 CXO perspectives: Strategic imperatives
- 2.4.1 Executive decision points
- 2.4.2 Critical success factors
- 2.5 Future outlook and recommendations
Chapter 3 Industry Insights
- 3.1 Industry ecosystem analysis
- 3.1.1 Supplier landscape
- 3.1.2 Profit margin
- 3.1.3 Cost structure
- 3.1.4 Value addition at each stage
- 3.1.5 Factor affecting the value chain
- 3.1.6 Disruptions
- 3.2 Industry impact forces
- 3.2.1 Growth drivers
- 3.2.1.1 Growth of smart city and urban mobility initiatives
- 3.2.1.2 Environmental regulations promoting zero-emission transport
- 3.2.1.3 Expansion of shared micromobility services
- 3.2.1.4 Rising demand for fast and convenient battery charging
- 3.2.2 Industry pitfalls and challenges
- 3.2.2.1 High initial capital investment for swap station deployment
- 3.2.2.2 Grid connectivity and power management challenges
- 3.2.3 Market opportunities
- 3.2.3.1 Integration of swap stations with renewable energy sources
- 3.2.3.2 Partnerships with micromobility fleet operators and oems
- 3.2.3.3 Deployment of swap stations at transit hubs and commercial zones
- 3.2.1 Growth drivers
- 3.3 Growth potential analysis
- 3.4 Regulatory landscape
- 3.4.1 North America
- 3.4.1.1 U.S. Department of Transportation (USDOT)
- 3.4.1.2 National Highway Traffic Safety Administration (NHTSA)
- 3.4.1.3 California Air Resources Board (CARB)
- 3.4.1.4 Transport Canada
- 3.4.2 Europe
- 3.4.2.1 European Commission
- 3.4.2.2 UNECE World Forum for Harmonization of Vehicle Regulations (WP.29)
- 3.4.2.3 German Federal Motor Transport Authority (KBA)
- 3.4.2.4 UK Department for Transport (DfT)
- 3.4.2.5 French Ministry of Ecological Transition
- 3.4.3 Asia Pacific
- 3.4.3.1 Ministry of Industry and Information Technology (MIIT), China
- 3.4.3.2 Ministry of Road Transport and Highways (MoRTH), India
- 3.4.3.3 Land Transport Authority (LTA), Singapore
- 3.4.3.4 National Transport Commission (NTC), Australia
- 3.4.4 Latin America
- 3.4.4.1 Brazilian National Land Transport Agency (ANTT)
- 3.4.4.2 Brazilian Association of Automotive Vehicle Manufacturers (ANFAVEA)
- 3.4.4.3 Chile Ministry of Transport and Telecommunications
- 3.4.5 Middle East & Africa
- 3.4.5.1 Dubai Roads and Transport Authority (RTA)
- 3.4.5.2 Abu Dhabi Department of Municipalities and Transport (DMT)
- 3.4.5.3 Saudi Ministry of Transport & Logistics
- 3.4.5.4 South African Department of Transport
- 3.4.1 North America
- 3.5 Porter’s analysis
- 3.6 PESTEL analysis
- 3.7 Technology and innovation landscape
- 3.7.1 Current technological trends
- 3.7.2 Emerging technologies
- 3.8 Price trends
- 3.8.1 By region
- 3.8.2 By product
- 3.9 Cost breakdown analysis
- 3.10 Sustainability and environmental impact
- 3.10.1 Environmental impact assessment
- 3.10.2 Social impact & community benefits
- 3.10.3 Governance & corporate responsibility
- 3.10.4 Sustainable finance & investment trends
- 3.11 Infrastructure readiness and urban integration
- 3.11.1 Urban infrastructure assessment framework
- 3.11.2 Smart city integration opportunities
- 3.11.3 Public transport connectivity
- 3.11.4 Digital infrastructure requirements
- 3.11.5 5G and IoT connectivity readiness
- 3.12 Placement and location strategy
- 3.12.1 Location selection criteria and decision framework
- 3.12.2 Geographic Information System analysis
- 3.12.3 Foot traffic and demand density mapping
- 3.12.4 Safety and security considerations
- 3.12.5 Franchise versus company-owned location models
- 3.13 Grid and power infrastructure analysis
- 3.13.1 Electrical grid capacity assessment
- 3.13.2 Grid connection requirements
- 3.13.3 Load management and peak shaving
- 3.13.4 Distributed energy resources integration
- 3.13.5 Power quality and reliability
- 3.14 Case studies
- 3.15 Future outlook & opportunities
Chapter 4 Competitive Landscape, 2025
- 4.1 Introduction
- 4.2 Company market share analysis
- 4.2.1 North America
- 4.2.2 Europe
- 4.2.3 Asia Pacific
- 4.2.4 LATAM
- 4.2.5 MEA
- 4.3 Competitive analysis of major market players
- 4.4 Competitive positioning matrix
- 4.5 Strategic outlook matrix
- 4.6 Key developments
- 4.6.1 Mergers & acquisitions
- 4.6.2 Partnerships & collaborations
- 4.6.3 New product launches
- 4.6.4 Expansion plans and funding
Chapter 5 Market Estimates & Forecast, By Solution, 2022 - 2035 ($Mn)
- 5.1 Key trends
- 5.2 Battery swap station
- 5.3 Vehicle swap station
Chapter 6 Market Estimates & Forecast, By Vehicle, 2022 - 2035 ($Mn)
- 6.1 Key trends
- 6.2 E-scooters
- 6.3 E-bikes
- 6.4 E-mopeds
- 6.5 Others
Chapter 7 Market Estimates & Forecast, By Business Model, 2022 - 2035 ($Mn)
- 7.1 Key trends
- 7.2 Subscription model
- 7.3 Pay-per-swap
- 7.4 Others
Chapter 8 Market Estimates & Forecast, By Deployment, 2022 - 2035 ($Mn)
- 8.1 Key trends
- 8.2 Public places
- 8.3 Commercial locations
- 8.4 Residential areas
- 8.5 Transportation hubs
Chapter 9 Market Estimates & Forecast, By Application, 2022 - 2035 ($Mn)
- 9.1 Key trends
- 9.2 Ride sharing
- 9.3 Delivery and logistics
- 9.4 Personal commuting
- 9.5 Tourism and recreation
- 9.6 Others
Chapter 10 Market Estimates & Forecast, By End Use, 2022 - 2035 ($Mn)
- 10.1 Key trends
- 10.2 Shared micromobility operators
- 10.3 Individual consumers
- 10.4 Fleet operators
- 10.5 Government and municipal
Chapter 11 Market Estimates & Forecast, By Region, 2022 - 2035 ($Mn)
- 11.1 Key trends
- 11.2 North America
- 11.2.1 US
- 11.2.2 Canada
- 11.3 Europe
- 11.3.1 Germany
- 11.3.2 UK
- 11.3.3 France
- 11.3.4 Italy
- 11.3.5 Spain
- 11.3.6 Czech Republic
- 11.3.7 Belgium
- 11.3.8 Netherlands
- 11.4 Asia Pacific
- 11.4.1 China
- 11.4.2 India
- 11.4.3 Japan
- 11.4.4 South Korea
- 11.4.5 Australia
- 11.4.6 Singapore
- 11.4.7 Malaysia
- 11.4.8 Indonesia
- 11.4.9 Vietnam
- 11.4.10 Thailand
- 11.5 Latin America
- 11.5.1 Brazil
- 11.5.2 Mexico
- 11.5.3 Argentina
- 11.5.4 Colombia
- 11.6 MEA
- 11.6.1 South Africa
- 11.6.2 Saudi Arabia
- 11.6.3 UAE
Chapter 12 Company Profiles
- 12.1 Global players
- 12.1.1 Ampersand
- 12.1.2 Battery Smart
- 12.1.3 Gogoro
- 12.1.4 KYMCO
- 12.1.5 Silence (ACCIONA)
- 12.1.6 Spiro
- 12.1.7 SUN Mobility
- 12.1.8 Swobbee
- 12.1.9 Tycorun
- 12.1.10 Vmoto
- 12.1.11 Yamaha ENYRING
- 12.1.12 Yuma
- 12.2 Regional players
- 12.2.1 BatteryPool
- 12.2.2 ESmito
- 12.2.3 Oyika
- 12.2.4 Popwheels
- 12.2.5 RACEnergy
- 12.2.6 Selex Motors
- 12.2.7 Swap Energi
- 12.2.8 VoltUp
- 12.3 Emerging players
- 12.3.1 ESWAP
- 12.3.2 Okai
- 12.3.3 Terra Tech
- 12.3.4 Tiger New Energy
- 12.3.5 Zembo
 2026年全球车用电池市场报告
 固态电池汽车电池市场:依驱动系统、容量范围、电池材料、车辆类型和销售管道划分-2026-2032年全球市场预测汽车电池盒市场:依设计类型、材质、车辆类型、最终用户和销售管道划分-2026-2032年全球预测
 汽车电池市场:按类型、驱动系统、车辆类型、国家和地区划分-全球产业分析、市场规模、市场份额及2026年至2033年预测圆柱形电池X射线影像检查市场:依电池类型、检测技术、终端用户产业、应用、通路划分,全球预测(2026-2032年)
 汽车电池:市场占有率分析、产业趋势与统计、成长预测(2026-2031)
 三轮车电池市场-全球产业规模、份额、趋势、机会及预测(依电池类型、驱动系统、需求类别、地区及竞争格局划分,2021-2031年)商用车电池市场-全球产业规模、份额、趋势、机会及预测(2021-2031)摩托车电池市场 - 全球产业规模、份额、趋势、机会及预测(按车辆类型、电池类型、驱动系统、地区和竞争格局划分,2021-2031年)
 2026-2030年全球汽车锂离子电池市场