


 |
市场调查报告书
商品编码
1959334
石油和天然气产业操作员培训模拟器市场机会、成长要素、产业趋势分析及预测(2026-2035年)Oil and Gas OTS Market Opportunity, Growth Drivers, Industry Trend Analysis, and Forecast 2026 - 2035 |
||||||
2025 年,全球石油和天然气产业操作员训练模拟器市场价值 31 亿美元,预计到 2035 年将达到 50 亿美元,年复合成长率为 5.1%。
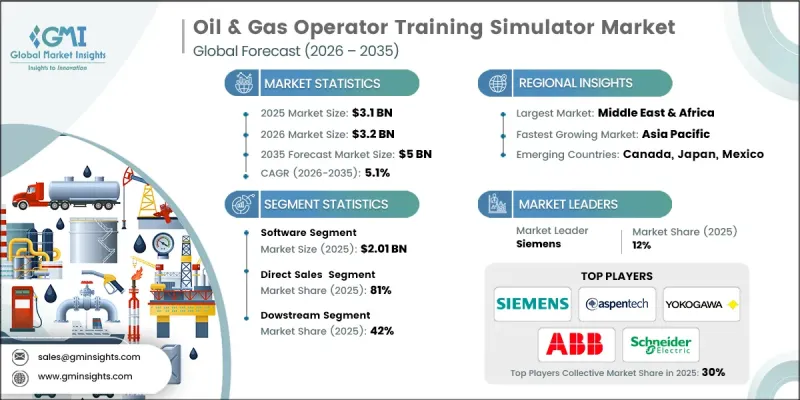
该市场的成长源自于石油和天然气作业固有的高风险性。高压、极端温度、危险化学品和复杂的製程流程,一旦出现人为失误,都可能导致灾难性事故。炼油、海上作业和天然气加工作业中发生的严重事故凸显了提高人员操作水准和采取积极主动的安全措施的必要性。操作员训练模拟器 (OTS) 透过提供逼真的虚拟环境,使操作员能够练习日常操作、异常情况和紧急情况,从而在降低操作风险方面发挥核心作用。这些模拟器使操作员能够安全地体验真实作业的压力和要求。除了安全之外,人们的关注点正转向积极主动的风险管理和损失预防。企业越来越多地使用 OTS 来模拟潜在故障、检验安全程序并评估操作员在高压情况下的反应。这使得在实际事故发生之前识别培训和操作程序中的不足成为可能,从而提高营运可靠性和员工能力。
| 市场范围 | |
|---|---|
| 开始年份 | 2025 |
| 预测年份 | 2026-2035 |
| 起始金额 | 31亿美元 |
| 预测金额 | 50亿美元 |
| 复合年增长率 | 5.1% |
预计到2025年,软体领域将创造20.1亿美元的收入。该软体是OTS系统的核心,涵盖製程模拟引擎、动态数学建模、模拟控制逻辑和场景管理工具。这款高精度软体基于从实际工厂运作中推导出的第一原理过程模式,确保对操作员的操作做出逼真的回应。透过模拟虚拟工厂环境,操作员可以在与实际运作几乎相同的条件下学习技能、做出明智的决策并提高安全回应能力。这使得该软体对于有效的操作员培训和持续的人才培养至关重要。
到2025年,销售管道将占据81%的市场份额。现成解决方案(OTS)技术复杂、可客製化性强且资本密集,因此更适合与供应商直接合作。供应商与燃气公司紧密合作,创建工厂专属模型,整合分散式控制系统(DCS),并开发反映实际操作流程的培训方案。这种方法使营运商能够掌控系统设计、品质和生命週期支援。直销还有助于加强製造商与客户之间的关係,从而改善安装后支援并创造长期价值。
预计到2025年,美国油气产业操作员训练模拟器市场将占据83%的份额,市场规模将达到7亿美元。凭藉其庞大的炼油能力、液化天然气出口基础设施以及先进的上游和中游业务,美国市场在全球占据主导地位。高度自动化的设施、严格的安全法规和环境监测正在推动对高保真DCS整合式操作员培训模拟器(OTS)解决方案的需求。美国本土的OTS供应商和自动化厂商正积极推广先进解决方案的应用,包括基于云端的模拟工具、数位双胞胎平台和基于绩效的操作员评估系统。油气活动活跃的州正在加速采用这些技术,并将安全、效率和合规性放在首位。
目录
第一章:调查方法和范围
第二章执行摘要
第三章业界考察
- 生态系分析
- 供应商情况
- 利润率
- 每个阶段增加的价值
- 影响价值链的因素
- 影响产业的因素
- 促进因素
- 人们越来越关注营运安全和风险降低
- 监管和合规要求
- 数位转型 工业4.0
- 产业潜在风险与挑战
- 前期成本高
- 技术复杂性和维护负担
- 机会
- 与数位双胞胎和人工智慧的集成
- 模组化和云端支援的OTS模型
- 促进因素
- 成长潜力分析
- 未来市场趋势
- 科技与创新趋势
- 当前技术趋势
- 新兴技术
- 价格趋势
- 按地区
- 按组件
- 监理情势
- 标准和合规要求
- 区域法规结构
- 认证标准
- 波特的分析
- PESTEL 分析
第四章 竞争情势
- 介绍
- 企业市占率分析
- 按地区
- 公司矩阵分析
- 主要市场公司的竞争分析
- 竞争定位矩阵
- 主要进展
- 併购
- 伙伴关係与合作
- 新产品发布
- 扩张计划
第五章 市场估计与预测:依组件划分,2022-2035年
- 硬体
- 软体
- 控制仿真
- 过程模拟
- 身临其境型模拟
- 服务
- 咨询
- 安装和环境模拟
- 维护和支援
第六章 市场估算与预测:依部署模式划分,2022-2035年
- 现场
- 基于云端的
- 杂交种
第七章 市场估计与预测:依业务部门划分,2022-2035年
- 上游业务
- 中游业务
- 下游业务
第八章 市场估计与预测:依营运区分,2022-2035年
- 主机操作员培训
- 现场操作员培训
第九章 市场估价与预测:依通路划分,2022-2035年
- 直销
- 间接销售
第十章 市场估价与预测:依地区划分,2022-2035年
- 北美洲
- 我们
- 加拿大
- 欧洲
- 德国
- 英国
- 法国
- 义大利
- 西班牙
- 亚太地区
- 中国
- 日本
- 印度
- 澳洲
- 韩国
- 拉丁美洲
- 巴西
- 墨西哥
- 阿根廷
- 中东和非洲
- 南非
- 沙乌地阿拉伯
- 阿拉伯聯合大公国
第十一章:公司简介
- ABB
- ANDRITZ
- Aspen Technology
- AVEVA Group Limited
- Designing Digitally
- DNV AS
- DuPont
- EON Reality
- ESI Group
- Hyperion Group
- Schneider Electric
- Siemens
- Tecnatom
- TRAX Energy Solutions
- Yokogawa Electric
The Global Oil & Gas Operator Training Simulator Market was valued at USD 3.1 billion in 2025 and is estimated to grow at a CAGR of 5.1% to reach USD 5 billion by 2035.
The market's growth is driven by the inherently high-risk nature of oil and gas operations, where high pressure, extreme temperatures, hazardous chemicals, and complex processes can lead to catastrophic events if errors occur. Historically, major accidents in refining, offshore, and gas processing operations have emphasized the need for enhanced human performance and preventive safety measures. Operator Training Simulators (OTS) have become central to reducing operational risks by providing realistic virtual environments where operators can practice routine, abnormal, and emergency scenarios. These simulators allow operators to experience the pressures and demands of real-world operations safely. In addition to safety, the focus has shifted to proactive risk management and loss prevention. Companies are increasingly using OTS to simulate potential failures, test safety procedures, and evaluate operator responses to high-stress situations. This enables identification of gaps in training and operational procedures before actual incidents occur, improving both operational reliability and workforce competence.
| Market Scope | |
|---|---|
| Start Year | 2025 |
| Forecast Year | 2026-2035 |
| Start Value | $3.1 Billion |
| Forecast Value | $5 Billion |
| CAGR | 5.1% |
In 2025, the software segment generated USD 2.01 billion. Software forms the core of OTS systems, encompassing process simulation engines, dynamic mathematical modeling, emulated control logic, and scenario management tools. High-fidelity software relies on first-principle process models derived from actual plant performance, ensuring realistic responses to operator actions. By recreating a virtual plant environment, the software allows operators to develop skills, make informed decisions, and improve safety readiness in conditions nearly identical to real operations. This makes software indispensable for effective operator training and continuous workforce development.
The direct sales channel segment held 81% share in 2025. The high level of technical complexity, customization, and capital intensity of OTS solutions drives the preference for direct engagement with suppliers. Vendors collaborate closely with oil and gas companies to create plant-specific models, integrate with Distributed Control Systems (DCS), and ensure training scenarios reflect actual operating procedures. This approach allows operators to maintain control over system design, quality, and lifecycle support. Direct sales also foster stronger relationships between manufacturers and clients, enhancing post-installation support and long-term value.
U.S. Oil & Gas Operator Training Simulator Market captured 83% share, generating USD 0.7 billion in 2025. The U.S. market leads globally due to its extensive refining capacity, LNG export infrastructure, and advanced upstream and midstream operations. Highly automated facilities, stringent safety regulations, and environmental oversight drive demand for DCS-integrated OTS solutions with high fidelity. U.S.-based OTS suppliers and automation vendors actively promote the adoption of advanced solutions, including cloud-based simulation tools, digital twin platforms, and performance-based operator assessment systems. States with significant oil and gas activity are accelerating the deployment of these technologies, emphasizing safety, efficiency, and regulatory compliance.
Key players operating in the Global Oil & Gas Operator Training Simulator Market include ABB, Aspen Technology, ANDRITZ, AVEVA Group Limited, Designing Digitally, DNV AS, DuPont, EON Reality, ESI Group, Hyperion Group, Schneider Electric, Siemens, Tecnatom, TRAX Energy Solutions, and Yokogawa Electric. Companies in the Oil & Gas Operator Training Simulator Market are strengthening their presence by investing in high-fidelity simulation software, cloud-enabled platforms, and scenario libraries covering routine, abnormal, and emergency operations. Strategic collaborations with oil and gas operators help ensure simulators are tailored to plant-specific processes and DCS configurations. Firms are expanding service offerings, including operator performance assessments, training analytics, and remote access to simulation environments. Adoption of digital twin technology, real-time monitoring, and AI-driven evaluation tools differentiates providers and enhances value delivery.
Table of Contents
Chapter 1 Methodology and Scope
- 1.1 Market scope and definition
- 1.2 Research design
- 1.2.1 Research approach
- 1.2.2 Data collection methods
- 1.3 Data mining sources
- 1.3.1 Global
- 1.3.2 Regional/Country
- 1.4 Base estimates and calculations
- 1.4.1 Base year calculation
- 1.4.2 Key trends for market estimation
- 1.5 Primary research and validation
- 1.5.1 Primary sources
- 1.6 Forecast model
- 1.7 Research assumptions and limitations
Chapter 2 Executive Summary
- 2.1 Industry 360° synopsis
- 2.2 Key market trends
- 2.2.1 Regional
- 2.2.2 Component
- 2.2.3 Deployment model
- 2.2.4 Operations
- 2.2.5 Environmental simulation
- 2.2.6 Distribution channel
- 2.3 CXO perspectives: Strategic imperatives
- 2.3.1 Key decision points for industry executives
- 2.3.2 Critical success factors for market players
- 2.4 Future outlook and strategic recommendations
Chapter 3 Industry Insights
- 3.1 Industry ecosystem analysis
- 3.1.1 Supplier landscape
- 3.1.2 Profit margin
- 3.1.3 Value addition at each stage
- 3.1.4 Factor affecting the value chain
- 3.2 Industry impact forces
- 3.2.1 Growth drivers
- 3.2.1.1 Increasing focus on operational safety & risk reduction
- 3.2.1.2 Regulatory & compliance requirements
- 3.2.1.3 Digital transformation & industry 4.0
- 3.2.2 Industry pitfalls & challenges
- 3.2.2.1 High upfront cost
- 3.2.2.2 Technical complexity & maintenance burden
- 3.2.3 Opportunities
- 3.2.3.1 Integration with digital twins & AI
- 3.2.3.2 Modular & cloud-enabled OTS models
- 3.2.1 Growth drivers
- 3.3 Growth potential analysis
- 3.4 Future market trends
- 3.5 Technology and innovation landscape
- 3.5.1 Current technological trends
- 3.5.2 Emerging technologies
- 3.6 Price trends
- 3.6.1 By region
- 3.6.2 By component
- 3.7 Regulatory landscape
- 3.7.1 Standards and compliance requirements
- 3.7.2 Regional regulatory frameworks
- 3.7.3 Certification standards
- 3.8 Porter’s analysis
- 3.9 PESTEL analysis
Chapter 4 Competitive Landscape, 2025
- 4.1 Introduction
- 4.2 Company market share analysis
- 4.2.1 By region
- 4.2.1.1 North America
- 4.2.1.2 Europe
- 4.2.1.3 Asia Pacific
- 4.2.1.4 Latin America
- 4.2.1.5 Middle East and Africa
- 4.2.1 By region
- 4.3 Company matrix analysis
- 4.4 Competitive analysis of major market players
- 4.5 Competitive positioning matrix
- 4.6 Key developments
- 4.6.1 Mergers & acquisitions
- 4.6.2 Partnerships & collaborations
- 4.6.3 New product launches
- 4.6.4 Expansion plans
Chapter 5 Market Estimates and Forecast, By Component, 2022 - 2035 (USD Billion) (Thousand Units)
- 5.1 Key trends
- 5.2 Hardware
- 5.3 Software
- 5.3.1 Control simulation
- 5.3.2 Process simulation
- 5.3.3 Immersive simulation
- 5.4 Services
- 5.4.1 Consulting
- 5.4.2 Installation & environmental simulation
- 5.4.3 Maintenance & support
Chapter 6 Market Estimates and Forecast, By Deployment Model, 2022 - 2035 (USD Billion) (Thousand Units)
- 6.1 Key trends
- 6.2 On-Premises
- 6.3 Cloud-based
- 6.4 Hybrid
Chapter 7 Market Estimates and Forecast, By Operations, 2022 - 2035 (USD Billion) (Thousand Units)
- 7.1 Key trends
- 7.2 Upstream operations
- 7.3 Midstream operations
- 7.4 Downstream operations
Chapter 8 Market Estimates and Forecast, By Operations, 2022 - 2035 (USD Billion) (Thousand Units)
- 8.1 Key trends
- 8.2 Console operator training
- 8.3 Field operator training
Chapter 9 Market Estimates and Forecast, By Distribution Channel, 2022 - 2035 (USD Billion) (Thousand Units)
- 9.1 Key trends
- 9.2 Direct sales
- 9.3 Indirect sales
Chapter 10 Market Estimates and Forecast, By Region, 2022 - 2035 (USD Billion) (Thousand Units)
- 10.1 Key trends
- 10.2 North America
- 10.2.1 U.S.
- 10.2.2 Canada
- 10.3 Europe
- 10.3.1 Germany
- 10.3.2 UK
- 10.3.3 France
- 10.3.4 Italy
- 10.3.5 Spain
- 10.4 Asia Pacific
- 10.4.1 China
- 10.4.2 Japan
- 10.4.3 India
- 10.4.4 Australia
- 10.4.5 South Korea
- 10.5 Latin America
- 10.5.1 Brazil
- 10.5.2 Mexico
- 10.5.3 Argentina
- 10.6 Middle East and Africa
- 10.6.1 South Africa
- 10.6.2 Saudi Arabia
- 10.6.3 UAE
Chapter 11 Company Profiles
- 11.1 ABB
- 11.2 ANDRITZ
- 11.3 Aspen Technology
- 11.4 AVEVA Group Limited
- 11.5 Designing Digitally
- 11.6 DNV AS
- 11.7 DuPont
- 11.8 EON Reality
- 11.9 ESI Group
- 11.10 Hyperion Group
- 11.11 Schneider Electric
- 11.12 Siemens
- 11.13 Tecnatom
- 11.14 TRAX Energy Solutions
- 11.15 Yokogawa Electric
 数位油田解决方案市场:全球市场按解决方案类型、组件、部署模式、应用和最终用户分類的预测——2026-2032年
 2026年全球数位化油田市场报告
 全球数位化油田市场:市场规模、份额和趋势分析(按解决方案、应用、製程和地区划分),细分市场预测(2026-2033 年)2026年全球互联油田市场报告2026年全球数位化油田解决方案市场报告
 数位油田市场-全球产业规模、份额、趋势、机会及预测(依製程、技术、地区及竞争格局划分,2021-2031年)数位油田技术市场-全球产业规模、份额、趋势、机会、预测:按製程、解决方案、应用、地区和竞争对手划分,2021-2031年数位油田解决方案市场-全球产业规模、份额、趋势、机会、预测:按製程、解决方案、应用、地区和竞争对手划分,2021-2031年数位油田系统市场(按组件、应用、部署模式和最终用途划分),全球预测(2026-2032)
 全球数位油田市场:市场规模、占有率、成长率、产业分析、依类型、应用和地区划分的考察、未来预测(2026-2034)