


 |
市场调查报告书
商品编码
1959562
远端汽车废气检测市场机会、成长要素、产业趋势分析及预测(2026-2035年)Remote Automotive Exhaust Sensing Market Opportunity, Growth Drivers, Industry Trend Analysis, and Forecast 2026 - 2035 |
||||||
2025 年全球远端汽车废气检测市场价值 8,770 万美元,预计到 2035 年将达到 2.186 亿美元,年复合成长率为 9.7%。
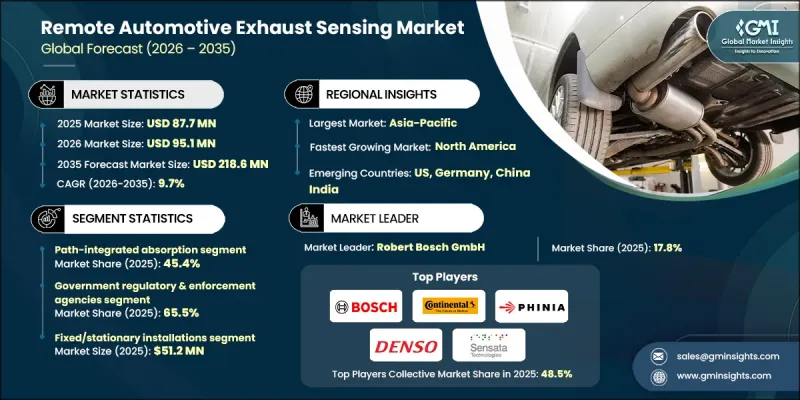
全球主要汽车市场日益严格的排放气体法规正在推动市场扩张,并加速车辆实际排放气体监测解决方案的普及。各国政府正大力投资建造用于空气品质管理的远端排放检测基础设施,尤其是在都市区和交通繁忙区域。与传统的实验室测试和随机检查不同,这些技术能够即时采集车辆排放气体数据,使相关部门能够更有效地实施污染防治。此外,政府对都市区空气品质改善倡议的公共资金投入以及将排放感测器整合到智慧城市交通网络中,也为市场发展提供了支持。侦测精确度、数据分析和自动报告功能的进步增强了环境和交通管理部门的信心,从而加速了这些解决方案的普及。人们对都市区空气污染日益增长的担忧以及应对不断变化的排放法规的需求,正在推动远端检测系统在全球范围内的稳步部署。
| 市场范围 | |
|---|---|
| 开始年份 | 2025 |
| 预测年份 | 2026-2035 |
| 起始金额 | 8770万美元 |
| 预测金额 | 2.186亿美元 |
| 复合年增长率 | 9.7% |
到2025年,路径整合吸收式感测器市场占有率将达到45.4%。这类感测器因其能够远距离、高精度、即时地测量氮氧化物(NOx)、一氧化碳(CO)和颗粒物而备受青睐。它们能够对繁忙道路进行连续监测,并可与自动化路边监测站集成,有助于遵守排放气体法规和车队管理计划。其高效可靠的数据提供能力使其成为城市和监管应用领域的基础技术。
预计2026年至2035年,汽车製造商产业将以9.6%的复合年增长率成长。汽车原始设备製造商(OEM)和商用车车队营运商正在扩大远端排放感测器的应用范围,用于实际道路排放气体性能评估、引擎标定优化以及符合国内外排放气体标准。日益严格的监管以及企业对永续性的承诺正推动製造商采用道路感测解决方案,尤其是在欧洲、北美和东亚等排放气体性能持续受到评估的地区。
预计到2025年,北美远端车辆排放检测市场占有率将达到18.9%。该地区市场成长的驱动因素包括美国环保署(EPA)日益严格的排放气体标准、不断扩大的都市区空气品质改善计划以及对即时排放气体监测需求的不断增长。在交通繁忙的城市,车载感测装置的部署正在扩大,使政府部门和私人车队能够持续监测氮氧化物(NOx)和颗粒物(PM)的排放。对物联网感测器和人工智慧驱动的数据分析的投资正在增强即时追踪排放气体的能力,从而实现快速响应和合规。
目录
第一章:调查方法和范围
第二章执行摘要
第三章业界考察
- 生态系分析
- 供应商情况
- 利润率
- 成本结构
- 每个阶段增加的价值
- 影响价值链的因素
- 中断
- 影响产业的因素
- 促进因素
- 世界各国政府加强汽车排放气体法规
- 政府对路边远端检测项目的投资
- 都市区对空气品质合规性监测的需求日益增长
- 需要尽快对道路上行驶的车辆进行排放气体检测。
- 红外线光谱学和数据分析技术的进步
- 产业潜在风险与挑战
- 天气和交通状况下的精度变化
- 高昂的安装和系统维护成本
- 市场机会
- 支持智慧城市空气品质监测计划
- 车队营运商用于追踪排放
- 促进因素
- 成长潜力分析
- 监理情势
- 北美洲
- 欧洲
- 亚太地区
- 拉丁美洲
- 中东和非洲
- 波特的分析
- PESTEL 分析
- 科技与创新趋势
- 当前技术趋势
- 新兴技术
- 价格趋势
- 按地区
- 副产品
- 定价策略
- 新兴经营模式
- 合规要求
- 专利和智慧财产权分析
- 地缘政治和贸易趋势
第四章 竞争情势
- 介绍
- 企业市占率分析
- 按地区
- 北美洲
- 欧洲
- 亚太地区
- 拉丁美洲
- 中东和非洲
- 市场集中度分析
- 按地区
- 主要企业的竞争标竿分析
- 财务绩效比较
- 收入
- 利润率
- 研究与开发
- 产品系列比较
- 产品线的广度
- 科技
- 创新
- 地理位置比较
- 全球扩张分析
- 服务网路覆盖
- 按地区分類的市场渗透率
- 竞争定位矩阵
- 领导企业
- 挑战者
- 追踪者
- 小众玩家
- 战略展望矩阵
- 财务绩效比较
- 主要进展
- 併购
- 伙伴关係与合作
- 技术进步
- 扩张和投资策略
- 数位转型计划
- 新兴/Start-Ups竞争对手的发展趋势
第五章 市场估计与预测:依检测方法划分,2022-2035年
- 路径积分吸收
- 雷射测距/主动雷射
- 粒子相位光学
- 成像光谱学
第六章 市场估计与预测:依目标污染物划分,2022-2035年
- 气相
- 氮氧化物(一氧化氮)
- CO
- CO2
- HC/VOC
- NH3
- SO2
- 其他受管制物质/目标气体(甲醛、甲烷)
第七章 市场估算与预测:依产品类型划分,2022-2035年
- 硬体
- 软体分析
- 服务
第八章 市场估算与预测:依部署类型划分,2022-2035年
- 固定式/独立式安装
- 行动执法平台
- 携带式/现场设备
- 网路连接感测器阵列
第九章 市场估价与预测:依车辆类型划分,2022-2035年
- 非机动车辆
- 大型车辆
- 摩托车
- 非道路引擎和非公路用设备车辆
第十章 市场估价与预测:依最终用户划分,2022-2035年
- 政府监管和执法机构
- 汽车製造商
- 第三方检验和认证机构
- 学术和研究机构
- 商用车车主
第十一章 市场估价与预测:按地区划分,2022-2035年
- 北美洲
- 我们
- 加拿大
- 欧洲
- 德国
- 英国
- 法国
- 西班牙
- 义大利
- 亚太地区
- 中国
- 印度
- 日本
- 澳洲
- 韩国
- 拉丁美洲
- 巴西
- 墨西哥
- 阿根廷
- 中东和非洲
- 南非
- 沙乌地阿拉伯
- 阿拉伯聯合大公国
第十二章:公司简介
- 主要企业
- Robert Bosch GmbH
- Continental AG
- Denso Corporation
- Sensata Technologies, Inc.
- Valeo SA
- HELLA GmbH &Co. KGaA
- 按地区分類的主要企业
- 北美洲
- Amphenol Advanced Sensors
- Opus Group AB
- 亚太地区
- Niterra India PVT. LTD.
- Korea Environment Corporation(K-eco)
- 欧洲
- AVL List GmbH
- PHINIA Inc.
- Hager Environmental &Atmospheric Technologies(HEAT)
- 北美洲
The Global Remote Automotive Exhaust Sensing Market was valued at USD 87.7 million in 2025 and is estimated to grow at a CAGR of 9.7% to reach USD 218.6 million by 2035.
The market is expanding due to stringent emission standards in major automotive regions worldwide, which are driving the adoption of real-world vehicle emissions monitoring solutions. Governments are heavily investing in remote exhaust sensing infrastructure, particularly in urban centers and high-traffic areas, to manage air quality. Unlike traditional laboratory testing or random inspections, these technologies capture real-time emissions data from vehicles, enabling authorities to address pollution more effectively. The market is further supported by public funding for urban air quality initiatives and integration of exhaust sensors into smart city transportation networks. Advances in sensing accuracy, data analytics, and automated reporting have increased trust among environmental and transport authorities, accelerating widespread deployment. Rising concerns over urban air pollution and compliance with evolving emission regulations are fueling the steady adoption of remote sensing systems globally.
| Market Scope | |
|---|---|
| Start Year | 2025 |
| Forecast Year | 2026-2035 |
| Start Value | $87.7 Million |
| Forecast Value | $218.6 Million |
| CAGR | 9.7% |
The path-integrated absorption segment held 45.4% share in 2025. These sensors are preferred for their ability to deliver highly accurate, real-time measurements of nitrogen oxides (NOx), carbon monoxide (CO), and particulate matter over extended distances. They enable continuous monitoring on busy roadways and can be integrated with automated roadside stations, supporting compliance with emission regulations and fleet management programs. Their efficiency in providing reliable data has made them a cornerstone technology for urban and regulatory applications.
The vehicle manufacturers segment is projected to grow at a CAGR of 9.6% during 2026 to 2035. Automotive OEMs and commercial fleet operators are increasingly deploying remote exhaust sensors to evaluate real-world emissions performance, optimize engine calibration, and comply with local and international emission standards. Heightened regulatory scrutiny and corporate sustainability initiatives are encouraging manufacturers to adopt on-road sensing solutions, especially across Europe, North America, and East Asia, where emissions performance is under continuous evaluation.
North America Remote Automotive Exhaust Sensing Market accounted for 18.9% share in 2025. Market growth in the region is driven by strict EPA emission standards, growing urban air quality programs, and rising demand for real-time emissions monitoring. Deployment of roadside sensing units is expanding in cities with high traffic density, enabling authorities and private fleets to monitor NOx and particulate matter emissions continuously. Investments in IoT-enabled sensors and AI-driven data analytics are enhancing the capability to track emissions in real time, allowing for prompt interventions and regulatory compliance.
Key players in the Global Remote Automotive Exhaust Sensing Market include Amphenol Advanced Sensors, AVL List GmbH, Continental AG, Denso Corporation, Hager Environmental & Atmospheric Technologies (HEAT), HELLA GmbH & Co. KGaA, Korea Environment Corporation (K-eco), Niterra India PVT. LTD., Opus Group AB, PHINIA Inc., Robert Bosch GmbH, Sensata Technologies, Inc., and Valeo SA. Companies in the Remote Automotive Exhaust Sensing Market are adopting multiple strategies to strengthen their market position. They are investing in advanced sensor technologies to improve accuracy, range, and data processing speed. Strategic collaborations with government agencies, transport authorities, and fleet operators are enabling early adoption and integration into smart city programs. Firms are expanding their global presence through partnerships, joint ventures, and localized manufacturing to meet regional regulatory requirements. Incorporation of AI, machine learning, and cloud-based analytics enhances predictive maintenance, emissions reporting, and fleet optimization services.
Table of Contents
Chapter 1 Methodology and Scope
- 1.1 Market scope and definition
- 1.2 Research design
- 1.2.1 Research approach
- 1.2.2 Data collection methods
- 1.3 Data mining sources
- 1.3.1 Global
- 1.3.2 Regional/Country
- 1.4 Base estimates and calculations
- 1.4.1 Base year calculation
- 1.4.2 Key trends for market estimation
- 1.5 Primary research and validation
- 1.5.1 Primary sources
- 1.6 Forecast model
- 1.7 Research assumptions and limitations
Chapter 2 Executive Summary
- 2.1 Industry 360° synopsis, 2022 - 2035
- 2.2 Key market trends
- 2.2.1 Sensing modality trends
- 2.2.2 Target pollutant trends
- 2.2.3 Offering trends
- 2.2.4 Deployment configuration trends
- 2.2.5 End user trends
- 2.2.6 Vehicle type trends
- 2.2.7 Regional trends
- 2.3 TAM Analysis, 2026-2035
- 2.4 CXO perspectives: Strategic imperatives
- 2.4.1 Executive decision points
- 2.4.2 critical success factors
- 2.5 Future outlook and strategic recommendations
Chapter 3 Industry Insights
- 3.1 Industry ecosystem analysis
- 3.1.1 Supplier Landscape
- 3.1.2 Profit Margin
- 3.1.3 Cost structure
- 3.1.4 Value addition at each stage
- 3.1.5 Factor affecting the value chain
- 3.1.6 Disruptions
- 3.2 Industry impact forces
- 3.2.1 Growth drivers
- 3.2.1.1 Stricter vehicle emission rules by governments globally
- 3.2.1.2 Government investment in roadside remote sensing programs
- 3.2.1.3 Rising urban air quality compliance monitoring needs
- 3.2.1.4 Need for fast on-road vehicle emission checks
- 3.2.1.5 Advances in infrared spectroscopy and data analytics
- 3.2.2 Industry pitfalls and challenges
- 3.2.2.1 Accuracy variability under weather and traffic conditions
- 3.2.2.2 High installation and system maintenance costs
- 3.2.3 Market opportunities
- 3.2.3.1 Support for smart city air monitoring programs
- 3.2.3.2 Use by fleet operators for emission tracking
- 3.2.1 Growth drivers
- 3.3 Growth potential analysis
- 3.4 Regulatory landscape
- 3.4.1 North America
- 3.4.2 Europe
- 3.4.3 Asia Pacific
- 3.4.4 Latin America
- 3.4.5 Middle East & Africa
- 3.5 Porter’s analysis
- 3.6 PESTEL analysis
- 3.7 Technology and Innovation landscape
- 3.7.1 Current technological trends
- 3.7.2 Emerging technologies
- 3.8 Price trends
- 3.8.1 By region
- 3.8.2 By product
- 3.9 Pricing Strategies
- 3.10 Emerging Business Models
- 3.11 Compliance Requirements
- 3.12 Patent and IP analysis
- 3.13 Geopolitical and trade dynamics
Chapter 4 Competitive Landscape, 2025
- 4.1 Introduction
- 4.2 Company market share analysis
- 4.2.1 By region
- 4.2.1.1 North America
- 4.2.1.2 Europe
- 4.2.1.3 Asia Pacific
- 4.2.1.4 Latin America
- 4.2.1.5 Middle East & Africa
- 4.2.2 Market concentration analysis
- 4.2.1 By region
- 4.3 Competitive benchmarking of key players
- 4.3.1 Financial performance comparison
- 4.3.1.1 Revenue
- 4.3.1.2 Profit margin
- 4.3.1.3 R&D
- 4.3.2 Product portfolio comparison
- 4.3.2.1 Product range breadth
- 4.3.2.2 Technology
- 4.3.2.3 Innovation
- 4.3.3 Geographic presence comparison
- 4.3.3.1 Global footprint analysis
- 4.3.3.2 Service network coverage
- 4.3.3.3 Market penetration by region
- 4.3.4 Competitive positioning matrix
- 4.3.4.1 Leaders
- 4.3.4.2 Challengers
- 4.3.4.3 Followers
- 4.3.4.4 Niche players
- 4.3.5 Strategic outlook matrix
- 4.3.1 Financial performance comparison
- 4.4 Key developments
- 4.4.1 Mergers and acquisitions
- 4.4.2 Partnerships and collaborations
- 4.4.3 Technological advancements
- 4.4.4 Expansion and investment strategies
- 4.4.5 Digital transformation initiatives
- 4.5 Emerging/ startup competitors landscape
Chapter 5 Market Estimates and Forecast, By Sensing Modality, 2022 - 2035 (USD Million & Units)
- 5.1 Key trends
- 5.2 Path-integrated absorption
- 5.3 Laser ranging / active laser
- 5.4 Particle-phase optical
- 5.5 Imaging spectroscopy
Chapter 6 Market Estimates and Forecast, By Target Pollutant, 2022 - 2035 (USD Million & Units)
- 6.1 Key trends
- 6.2 Gas-Phase
- 6.2.1 NOx (NO, NO2)
- 6.2.2 CO
- 6.2.3 CO2
- 6.2.4 HC/VOC
- 6.2.5 NH3
- 6.2.6 SO2
- 6.3 Other regulated/target gases (HCHO, CH4)
Chapter 7 Market Estimates and Forecast, By Offering, 2022 - 2035 (USD Million & Units)
- 7.1 Key trends
- 7.2 Hardware
- 7.3 Software & analytics
- 7.4 Services
Chapter 8 Market Estimates and Forecast, By Deployment Configuration, 2022 - 2035 (USD Million & Units)
- 8.1 Key trends
- 8.2 Fixed/stationary installations
- 8.3 Mobile enforcement platforms
- 8.4 Portable handheld/field devices
- 8.5 Networked sensor arrays
Chapter 9 Market Estimates and Forecast, By Vehicle Type, 2022 - 2035 (USD Million & Units)
- 9.1 Key trends
- 9.2 Light-duty vehicles
- 9.3 Heavy-duty vehicle
- 9.4 Two-wheelers
- 9.5 Non-road engines & off-highway equipment vehicle
Chapter 10 Market Estimates and Forecast, By End-User, 2022 - 2035 (USD Million & Units)
- 10.1 Key trends
- 10.2 Government regulatory & enforcement agencies
- 10.3 Vehicle manufacturers
- 10.4 Third-party inspection & certification bodies
- 10.5 Academic & research institutions
- 10.6 Commercial fleet owners
Chapter 11 Market Estimates and Forecast, By Region, 2022 - 2035 (USD Million & Units)
- 11.1 Key trends
- 11.2 North America
- 11.2.1 U.S.
- 11.2.2 Canada
- 11.3 Europe
- 11.3.1 Germany
- 11.3.2 UK
- 11.3.3 France
- 11.3.4 Spain
- 11.3.5 Italy
- 11.4 Asia Pacific
- 11.4.1 China
- 11.4.2 India
- 11.4.3 Japan
- 11.4.4 Australia
- 11.4.5 South Korea
- 11.5 Latin America
- 11.5.1 Brazil
- 11.5.2 Mexico
- 11.5.3 Argentina
- 11.6 Middle East and Africa
- 11.6.1 South Africa
- 11.6.2 Saudi Arabia
- 11.6.3 UAE
Chapter 12 Company Profiles
- 12.1 Global Key Players
- 12.1.1 Robert Bosch GmbH
- 12.1.2 Continental AG
- 12.1.3 Denso Corporation
- 12.1.4 Sensata Technologies, Inc.
- 12.1.5 Valeo SA
- 12.1.6 HELLA GmbH & Co. KGaA
- 12.2 Regional key players
- 12.2.1 North America
- 12.2.1.1 Amphenol Advanced Sensors
- 12.2.1.2 Opus Group AB
- 12.2.2 Asia Pacific
- 12.2.2.1 Niterra India PVT. LTD.
- 12.2.2.2 Korea Environment Corporation (K-eco)
- 12.2.3 Europe
- 12.2.3.1 AVL List GmbH
- 12.2.3.2 PHINIA Inc.
- 12.2.3.3 Hager Environmental & Atmospheric Technologies (HEAT)
- 12.2.1 North America


