


 |
市场调查报告书
商品编码
1959567
光达市场机会、成长要素、产业趋势分析及测绘预测(2026-2035年)LiDAR in Mapping Market Opportunity, Growth Drivers, Industry Trend Analysis, and Forecast 2026 - 2035 |
||||||
2025 年全球测绘用光达市场价值 53 亿美元,预计到 2035 年将达到 458 亿美元,年复合成长率为 25.6%。
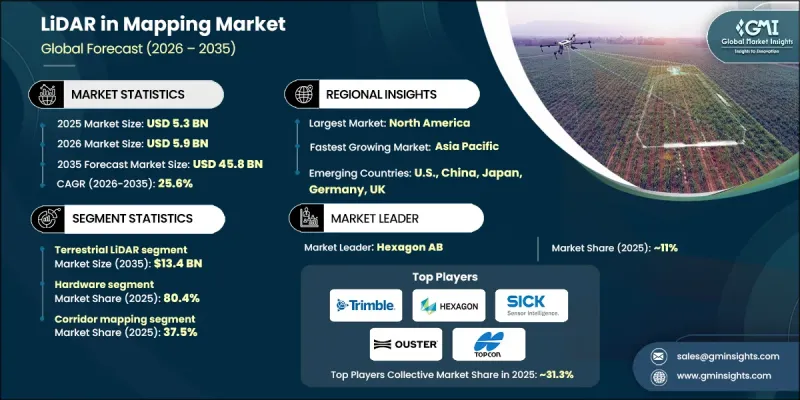
市场扩张的驱动力在于雷射雷达(LiDAR)与人工智慧(AI)、地理资讯系统(GIS)平台以及新兴数位双胞胎解决方案的日益融合。这些融合实现了即时空间分析和自动特征提取,从而革新了测绘工作流程。订阅模式和地图即服务(MaaS)交付模式的兴起,使得雷射雷达的应用更加普及,无需大量的硬体前期投资。云端基础架构进一步支援协作计划管理、即时资料共用以及从资料撷取到交货的端到端地理空间工作流程支援。北美和欧洲的中小型企业对光达的采用尤为显着,他们无需大量资本投入即可享受可扩展的处理能力。随着政府机构和私人企业对高效大规模测绘和即时地理空间洞察的需求不断增长,光达与无人机(UAV)、自动驾驶车辆和数数位双胞胎的融合正在加速市场形成。
| 市场范围 | |
|---|---|
| 开始年份 | 2025 |
| 预测年份 | 2026-2035 |
| 起始金额 | 53亿美元 |
| 预测金额 | 458亿美元 |
| 复合年增长率 | 25.6% |
预计到2035年,地面光达市场规模将达134亿美元。其成长主要得益于在基础设施建设、建筑施工和城市规划计划中的广泛应用。高精度测绘道路、公共设施和建筑物,能够帮助工程师最大限度地减少误差、优化材料使用并加快专案进度。北美、欧洲和亚太地区的各国政府正日益强制要求在城市发展和智慧城市计划中采用雷射雷达技术。移动式和手持式地面光达系统的进步也使得中型企业更容易获得这些解决方案。与人工智慧驱动的点云处理、BIM和GIS平台集成,能够提升公共产业、工业工厂和环境监测领域的预测性维护、即时决策和效率。
预计到2025年,硬体部分将占据80.4%的市场。这一主导地位源自于先进雷射雷达感测器和扫描设备在机载、地面和无人机(UAV)应用方面的可靠性、成本效益和监管核准。北美、欧洲和亚太地区对能够产生高密度、高精度点云资料的专用雷射雷达硬体的需求,正推动其在精密测绘、基础设施监测和环境分析等领域的应用。
预计到2025年,北美光达测绘市场份额将达到49.8%。该地区的成长主要得益于大规模基础设施计划、都市化以及交通网络的发展。政府在智慧城市建设、洪水测绘和资产管理等领域的倡议日益依赖雷射雷达进行精确的地形和地理空间资料收集,从而提升规划水准、营运效率和城市韧性。无人机和机载雷射雷达系统的高普及率,以及领先製造商的大力研发投入,进一步推动了该地区市场的扩张。
目录
第一章:调查方法和范围
第二章执行摘要
第三章业界考察
- 生态系分析
- 供应商情况
- 利润率分析
- 成本结构
- 每个阶段增加的价值
- 影响价值链的因素
- 中断
- 影响产业的因素
- 促进因素
- 高精度地理空间资料的需求日益增长
- 快速的基础设施建设和都市化
- 政府主导的国家调查和韧性计划增加
- 基于无人机(UAV)的光达测量技术的快速普及
- 环境监测和气候应用领域的成长
- 产业潜在风险与挑战
- 初始资本成本高
- 复杂的数据处理和技能要求
- 市场机会
- 订阅式地图服务模式的成长
- 在未开发的市场中寻求扩张机会
- 促进因素
- 监理情势
- 北美洲
- 欧洲
- 亚太地区
- 拉丁美洲
- 中东和非洲
- 波特的分析
- PESTEL 分析
- 科技与创新趋势
- 当前技术趋势
- 新兴技术
- 新兴经营模式
- 合规要求
- 专利和智慧财产权分析
- 地缘政治和贸易趋势
第四章 竞争情势
- 介绍
- 企业市占率分析
- 按地区
- 北美洲
- 欧洲
- 亚太地区
- 拉丁美洲
- 中东和非洲
- 按地区
- 主要企业的竞争标竿分析
- 财务绩效比较
- 收入
- 利润率
- 研究与开发
- 产品系列比较
- 产品线的广度
- 科技
- 创新
- 地理位置比较
- 全球扩张分析
- 服务网路覆盖
- 按地区分類的市场渗透率
- 竞争定位矩阵
- 领导企业
- 挑战者
- 追踪者
- 小众玩家
- 战略展望矩阵
- 财务绩效比较
- 2021-2024 年重大发展
- 併购
- 伙伴关係与合作
- 技术进步
- 扩张和投资策略
- 数位转型计划
- 新兴/Start-Ups竞争对手的发展趋势
第五章 市场估计与预测:依平台划分,2022-2035年
- 无人机
- 固定翼无人机
- 单旋翼无人机
- 多旋翼无人机
- 地面光达
- 固定类型
- 移动的
- 载人机载雷射雷达
- 专用于手持式/背包式雷射雷达的托盘
第六章 市场估算与预测:基于距离原则,2022-2035年
- Time-of-Flight (ToF) LiDAR
- 相移雷射雷达
- 频率调变连续波(FMCW)
第七章 市场估计与预测:依扫描法,2022-2035年
- 机械扫描
- 固态扫描
第八章 市场估算与预测:依组件划分,2022-2035年
- 硬体
- 软体
第九章 市场估计与预测:依应用领域划分,2022-2035年
- 线路测量製图
- 建筑/测量
- 农业/林业
- 采矿和采石
- 教育
- 环境
- 运输
- 紧急服务
- 其他的
第十章 市场估价与预测:依地区划分,2022-2035年
- 北美洲
- 我们
- 加拿大
- 欧洲
- 德国
- 英国
- 法国
- 西班牙
- 义大利
- 荷兰
- 亚太地区
- 中国
- 印度
- 日本
- 澳洲
- 韩国
- 拉丁美洲
- 巴西
- 墨西哥
- 阿根廷
- 中东和非洲
- 南非
- 沙乌地阿拉伯
- 阿拉伯聯合大公国
第十一章:公司简介
- Trimble Inc.
- Hexagon AB
- SICK AG
- Topcon
- Ouster Inc.
- RIEGL
- FARO
- Quanergy Solutions, Inc.
- Teledyne Technologies Inc.
- Valeo
- NV5 Global, Inc.
- Shanghai Slamtec Co., Ltd.
- Vaisala
- Hesai Group.
- Pix4D SA
The Global LiDAR in Mapping Market was valued at USD 5.3 billion in 2025 and is estimated to grow at a CAGR of 25.6% to reach USD 45.8 billion by 2035.
Market expansion is driven by the growing integration of LiDAR with artificial intelligence, GIS platforms, and emerging digital twin solutions, which are transforming mapping workflows by enabling real-time spatial analytics and automated feature extraction. The rise of subscription-based and Mapping as a Service (MaaS) offerings is making LiDAR more accessible by eliminating significant upfront hardware investments. Cloud-based infrastructure further allows for collaborative project management, real-time data sharing, and end-to-end geospatial workflow support from data capture to delivery. Adoption is particularly strong among small to mid-sized enterprises in North America and Europe, which benefit from scalable processing without heavy capital expenditure. The integration of LiDAR with UAVs, autonomous vehicles, and digital twins is increasingly shaping the market, as both government bodies and private enterprises seek efficient, large-scale mapping and real-time geospatial insights.
| Market Scope | |
|---|---|
| Start Year | 2025 |
| Forecast Year | 2026-2035 |
| Start Value | $5.3 Billion |
| Forecast Value | $45.8 Billion |
| CAGR | 25.6% |
The terrestrial LiDAR segment is projected to reach USD 13.4 billion by 2035. Growth is fueled by its use in infrastructure development, construction, and urban planning projects. High-precision mapping of roads, utilities, and buildings allows engineers to minimize errors, optimize material usage, and accelerate timelines. Governments across North America, Europe, and Asia-Pacific are increasingly mandating LiDAR adoption for urban development and smart city projects. Advancements in mobile and handheld terrestrial LiDAR systems are also making these solutions more accessible for mid-sized organizations. Integration with AI-powered point-cloud processing, BIM, and GIS platforms enhances predictive maintenance, real-time decision-making, and efficiency in utilities, industrial plants, and environmental monitoring.
The hardware segment accounted for 80.4% share in 2025. Its dominance is due to the reliability, cost-effectiveness, and regulatory approval of advanced LiDAR sensors and scanning equipment for airborne, terrestrial, and UAV applications. Precision mapping, infrastructure monitoring, and environmental analysis demand specialized LiDAR hardware capable of generating dense and accurate point-cloud data, driving widespread adoption in North America, Europe, and Asia-Pacific.
North America LiDAR in Mapping Market contributed 49.8% share in 2025. Growth in the region is driven by extensive infrastructure projects, urbanization, and transportation development. Government initiatives in smart cities, flood mapping, and asset management increasingly rely on LiDAR for precise topographic and geospatial data, enhancing planning, operational efficiency, and urban resilience. The region benefits from high adoption of UAV and airborne LiDAR systems and strong R&D investments by leading manufacturers, which further propels market expansion.
Key companies in the Global LiDAR in Mapping Market include Hexagon AB, Teledyne Technologies Inc., Trimble Inc., RIEGL, FARO, Topcon, Vaisala, NV5 Global, Inc., Pix4D SA, Hesai Group, Valeo, Quanergy Solutions, Inc., Ouster Inc., Shanghai Slamtec Co., Ltd., and SICK AG. Companies in the LiDAR in mapping market are adopting multiple strategies to strengthen their presence. They are investing heavily in R&D to enhance sensor accuracy, range, and integration with AI, GIS, and digital twin platforms. Strategic collaborations with UAV, autonomous vehicle, and mapping service providers expand deployment opportunities. Cloud-based solutions and subscription models reduce upfront costs, broadening accessibility for small and mid-sized firms. Geographic expansion, localized support, and training programs help capture regional demand. Firms also focus on software ecosystem development, including AI-powered point-cloud processing, predictive maintenance, and real-time analytics, ensuring long-term adoption and recurring revenue streams.
Table of Contents
Chapter 1 Methodology and Scope
- 1.1 Market scope and definition
- 1.2 Research design
- 1.2.1 Research approach
- 1.2.2 Data collection methods
- 1.3 Data mining sources
- 1.3.1 Global
- 1.3.2 Regional/Country
- 1.4 Base estimates and calculations
- 1.4.1 Base year calculation
- 1.4.2 Key trends for market estimation
- 1.5 Primary research and validation
- 1.5.1 Primary sources
- 1.6 Forecast model
- 1.7 Research assumptions and limitations
Chapter 2 Executive Summary
- 2.1 Industry 360° synopsis, 2022 - 2035
- 2.2 Key market trends
- 2.2.1 System type trends
- 2.2.2 Deployment model trends
- 2.2.3 End-user industry trends
- 2.2.4 Regional trends
- 2.3 TAM analysis, 2025-2034
- 2.4 CXO perspectives: Strategic imperatives
- 2.4.1 Executive decision points
- 2.4.2 Critical success factors
- 2.5 Future outlook and strategic recommendations
Chapter 3 Industry Insights
- 3.1 Industry ecosystem analysis
- 3.1.1 Supplier landscape
- 3.1.2 Profit margin analysis
- 3.1.3 Cost structure
- 3.1.4 Value addition at each stage
- 3.1.5 Factor affecting the value chain
- 3.1.6 Disruptions
- 3.2 Industry impact forces
- 3.2.1 Growth drivers
- 3.2.1.1 Rising demand for high-accuracy geospatial data
- 3.2.1.2 Rapid infrastructure development & urbanization
- 3.2.1.3 Increasing government-led national mapping & resilience programs
- 3.2.1.4 Rapid adoption of UAV-based lidar mapping
- 3.2.1.5 Growth in environmental monitoring & climate applications
- 3.2.2 Industry pitfalls and challenges
- 3.2.2.1 High initial capital cost
- 3.2.2.2 Complex data processing & skill requirements
- 3.2.3 Market opportunities
- 3.2.3.1 Growth of subscription-based & mapping-as-a-service models
- 3.2.3.2 Expansion opportunities in underpenetrated markets
- 3.2.1 Growth drivers
- 3.3 Regulatory landscape
- 3.3.1 North America
- 3.3.2 Europe
- 3.3.3 Asia Pacific
- 3.3.4 Latin America
- 3.3.5 Middle East & Africa
- 3.4 Porter’s analysis
- 3.5 PESTEL analysis
- 3.6 Technology and innovation landscape
- 3.6.1 Current technological trends
- 3.6.2 Emerging technologies
- 3.7 Emerging business models
- 3.8 Compliance requirements
- 3.9 Patent and IP analysis
- 3.10 Geopolitical and trade dynamics
Chapter 4 Competitive Landscape, 2024
- 4.1 Introduction
- 4.2 Company market share analysis
- 4.2.1 By region
- 4.2.1.1 North America
- 4.2.1.2 Europe
- 4.2.1.3 Asia Pacific
- 4.2.1.4 Latin America
- 4.2.1.5 Middle East & Africa
- 4.2.1 By region
- 4.3 Competitive benchmarking of key players
- 4.3.1 Financial performance comparison
- 4.3.1.1 Revenue
- 4.3.1.2 Profit margin
- 4.3.1.3 R&D
- 4.3.2 Product portfolio comparison
- 4.3.2.1 Product range breadth
- 4.3.2.2 Technology
- 4.3.2.3 Innovation
- 4.3.3 Geographic presence comparison
- 4.3.3.1 Global footprint analysis
- 4.3.3.2 Service network coverage
- 4.3.3.3 Market penetration by region
- 4.3.4 Competitive positioning matrix
- 4.3.4.1 Leaders
- 4.3.4.2 Challengers
- 4.3.4.3 Followers
- 4.3.4.4 Niche players
- 4.3.5 Strategic outlook matrix
- 4.3.1 Financial performance comparison
- 4.4 Key developments, 2021-2024
- 4.4.1 Mergers and acquisitions
- 4.4.2 Partnerships and collaborations
- 4.4.3 Technological advancements
- 4.4.4 Expansion and investment strategies
- 4.4.5 Digital transformation initiatives
- 4.5 Emerging/ startup competitors’ landscape
Chapter 5 Market Estimates and Forecast, By Platform, 2022 - 2035 (USD Mn)
- 5.1 Key trends
- 5.1.1 Drone
- 5.1.1.1 Fixed wing drones
- 5.1.1.2 Single rotor drones
- 5.1.1.3 Multi rotor drones
- 5.1.2 Terrestrial LiDAR
- 5.1.2.1 Stationary
- 5.1.2.2 Mobile
- 5.1.3 Manned Airborne LiDAR
- 5.1.4 Handheld / Backpack LiDAR Specialized pallets
- 5.1.1 Drone
Chapter 6 Market Estimates and Forecast, By Ranging Principle, 2022 - 2035 (USD Mn)
- 6.1 Key trends
- 6.2 Time-of-Flight (ToF) LiDAR
- 6.3 Phase Shift LiDAR
- 6.4 Frequency-Modulated Continuous Wave (FMCW)
Chapter 7 Market Estimates and Forecast, By Scanning Architecture, 2022 - 2035 (USD Mn)
- 7.1 Key trends
- 7.2 Mechanical Scanning
- 7.3 Solid-State Scanning
Chapter 8 Market Estimates and Forecast, By Component, 2022 - 2035 (USD Mn)
- 8.1 Key trends
- 8.2 Hardware
- 8.3 Software
Chapter 9 Market Estimates and Forecast, By Application, 2022 - 2035 (USD Mn)
- 9.1 Key trends
- 9.2 Corridor mapping
- 9.3 Construction & Surveying
- 9.4 Agriculture & Forestry
- 9.5 Mining & Quarrying
- 9.6 Education
- 9.7 Environmental
- 9.8 Transport
- 9.9 Emergency services
- 9.10 Others
Chapter 10 Market Estimates and Forecast, By Region, 2022 - 2035 (USD Mn)
- 10.1 Key trends
- 10.2 North America
- 10.2.1 U.S.
- 10.2.2 Canada
- 10.3 Europe
- 10.3.1 Germany
- 10.3.2 UK
- 10.3.3 France
- 10.3.4 Spain
- 10.3.5 Italy
- 10.3.6 Netherlands
- 10.4 Asia Pacific
- 10.4.1 China
- 10.4.2 India
- 10.4.3 Japan
- 10.4.4 Australia
- 10.4.5 South Korea
- 10.5 Latin America
- 10.5.1 Brazil
- 10.5.2 Mexico
- 10.5.3 Argentina
- 10.6 Middle East and Africa
- 10.6.1 South Africa
- 10.6.2 Saudi Arabia
- 10.6.3 UAE
Chapter 11 Company Profiles
- 11.1 Trimble Inc.
- 11.2 Hexagon AB
- 11.3 SICK AG
- 11.4 Topcon
- 11.5 Ouster Inc.
- 11.6 RIEGL
- 11.7 FARO
- 11.8 Quanergy Solutions, Inc.
- 11.9 Teledyne Technologies Inc.
- 11.10 Valeo
- 11.11 NV5 Global, Inc.
- 11.12 Shanghai Slamtec Co., Ltd.
- 11.13 Vaisala
- 11.14 Hesai Group.
- 11.15 Pix4D SA
 光达市场:按类型、组件、技术、测量距离、最终用户和应用划分-2026-2032年全球市场预测
 光达测绘市场分析及预测(至2035年):按类型、产品、服务、技术、组件、应用、部署、最终用户和功能划分
 2026年全球光达软体市场报告光达滤光片市场:按滤光片类型、波长、技术、应用和部署划分-2026-2032年全球预测
 光达技术市场:策略洞察与预测(2026-2031年)行动雷射扫描系统市场:按组件、扫描器类型、技术、应用和最终用户划分,全球预测,2026-2032年光达(LiDAR)市场规模、份额、成长率及全球产业分析:按类型、应用和地区划分,预测2026-2034年光达市场分析及预测(至2035年):依类型、产品类型、服务、技术、组件、应用、部署、最终用户及解决方案划分铁路雷达和光达技术市场分析及预测(至2035年):按类型、产品、服务、技术、组件、应用、部署、最终用户、安装类型和解决方案划分2026-2034年全球光达市场规模、份额、趋势和成长分析报告