


 |
市场调查报告书
商品编码
1959572
自动驾驶巴士软体市场机会、成长要素、产业趋势分析及2026年至2035年预测Autonomous Bus Software Market Opportunity, Growth Drivers, Industry Trend Analysis, and Forecast 2026 - 2035 |
||||||
2025 年全球自动驾驶巴士软体市场价值 10.4 亿美元,预计到 2035 年将达到 92.3 亿美元,年复合成长率为 24.7%。
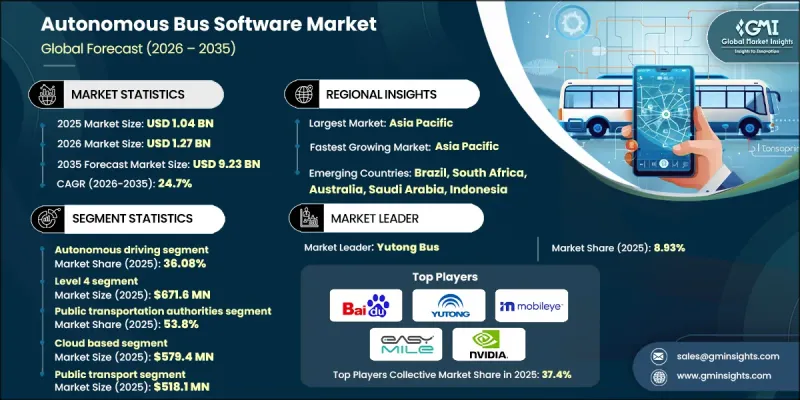
全球对永续、高效和智慧化的城市交通解决方案日益增长的需求,推动了这个市场的成长。世界各地的城市都在投资能够缓解交通拥堵、减少排放气体并提升乘客整体体验的技术。配备先进软体的自动驾驶公车正成为这些策略的关键组成部分。人工智慧、机器学习、先进感测器和云端分析的融合,实现了即时导航、路线优化,并提高了乘客和行人的安全性。各国政府、交通管理部门和技术供应商正携手合作,加速智慧交通系统的应用,尤其是在智慧城市建设中,使自动驾驶公车能够与基础设施、其他车辆和交通管理系统协同运作。这种合作不仅提高了营运效率,还有助于实现环境目标,使自动驾驶公车成为未来城市公共交通的核心。
| 市场范围 | |
|---|---|
| 开始年份 | 2025 |
| 预测年份 | 2026-2035 |
| 起始值 | 10.4亿美元 |
| 预测金额 | 92.3亿美元 |
| 复合年增长率 | 24.7% |
预计到2025年,自动驾驶领域的市占率将达到36.08%,并在2035年之前以26.1%的复合年增长率成长。这一成长主要得益于车队管理软体的日益普及,该软体能够提高营运效率并增强安全性。营运商可以远端即时监控公车,追踪技术问题,并对延误和故障做出快速反应。基于物联网的预测性维护能够预先发现潜在问题,从而减少停机时间和维修成本。该软体还包含路线优化和油耗追踪功能,有助于降低营运成本并提高车队管理效率。这些因素使得自动驾驶软体成为运输业者提高可靠性和盈利,同时确保乘客安全的必备工具。
预计到2025年,L4级自动驾驶公车市场规模将达6.716亿美元。这些公车旨在预设区域内自主运行,例如商业区、校园和智慧城市走廊。人工智慧驱动的预测分析、即时交通资讯和机器学习技术使其能够有效率地应对复杂的城市环境。 L4级自动驾驶公车透过持续适应交通模式和乘客需求,提供最佳化的性能。儘管法规结构和基础设施的限制阻碍了其在公共道路上的广泛部署,但各个城市正在进行的受控测试和试验计画正在加速这些系统的完善及其未来的主流化应用。
预计2026年至2035年,中国自动驾驶公车软体市场将以27.1%的复合年增长率成长。快速的都市化、大规模的公共交通升级以及智慧城市建设是推动市场需求的主要因素。政府对自动驾驶技术、人工智慧和智慧型运输系统(ITS)的支持,正在加速自动驾驶公车软体解决方案的投资。中国致力于减少交通拥堵和环境污染,加上其强大的技术生态系统,使其成为自动驾驶公车软体应用和创新领域的领先市场。随着都市区采用智慧运输解决方案,亚太其他地区国家也为全部区域成长做出了贡献。
目录
第一章:调查方法和范围
第二章执行摘要
第三章业界考察
- 生态系分析
- 供应商情况
- 成本结构
- 利润率
- 每个阶段增加的价值
- 垂直整合趋势
- 颠覆者
- 影响因素
- 促进因素
- 共用出行和按需交通的需求日益增长
- 改善安全和交通管理
- 社会认可和接受度不断提高
- 人们对自动驾驶汽车的兴趣日益浓厚
- 产业潜在风险与挑战
- 监管和法律挑战
- 高昂的开发和营运成本
- 市场机会
- 人工智慧驱动的自动化效能管理 (APM) 和预测分析
- 与城市和交通运营商开展合作与伙伴关係
- 促进因素
- 技术趋势与创新生态系统
- 目前技术
- 新兴技术
- 成长潜力分析
- 监理情势
- 北美洲
- 美国联邦和州网路安全法规
- 加拿大《个人资料保护法》(PIPEDA) 和省级隐私法规
- 欧洲
- 一般资料保护规则
- 数位营运弹性法案
- NIS2 和网路安全指令
- 亚太地区
- 中国网路安全法与个人资讯保护法
- 印度数位个人资料保护法
- 日本《个人资讯保护法》(APPI)和国土交通省(MLIT)资讯通讯技术(ICT)指南
- 东协资料保护与网路安全框架
- 拉丁美洲
- 巴西 LGPD(通用资料保护法)
- 阿根廷个人资料保护法
- 墨西哥联邦资料保护法和隐私权法规
- 中东和非洲
- 沙乌地阿拉伯国家网路安全局 (NCA) 的规章制度
- 南非的《个人资讯保护法》(POPIA)
- 阿拉伯联合大公国(阿联酋)资料保护及欧洲证券及市场管理局(ESMA)网路安全标准
- 北美洲
- 波特五力分析
- PESTEL 分析
- 价格趋势
- 按地区
- 副产品
- 成本細項分析
- 专利分析
- 永续性和环境方面
- 导航系统的碳足迹
- 循环经济战略
- 永续航行能力
- 企业永续发展倡议
- 气候变迁对航行的影响
- 案例研究
- 作战准备与区域部署的可行性
- 安全检验、认证和问责框架
- 基础建设依赖与智慧城市融合
第四章 竞争情势
- 介绍
- 企业市占率分析
- 北美洲
- 欧洲
- 亚太地区
- 拉丁美洲
- 中东和非洲
- 主要市场公司的竞争分析
- 竞争定位矩阵
- 战略展望矩阵
- 主要进展
- 併购
- 伙伴关係与合作
- 新产品发布
- 业务拓展计划及资金筹措
第五章 市场估计与预测:依功能划分,2022-2035年
- 车队管理软体
- 自动驾驶
- 交通管理
- 乘客管理
- 安全保障
- 公车线路设计
第六章 市场估算与预测:依自动化程度划分,2022-2035年
- 3级
- 4级
- 5级
第七章 市场估算与预测:依部署类型划分,2022-2035年
- 现场
- 基于云端的
- 杂交种
第八章 市场估计与预测:依应用领域划分,2022-2035年
- 公共运输
- 校园和公司接驳车
- 机场接送服务
- 其他的
第九章 市场估计与预测:依最终用途划分,2022-2035年
- 公共运输
- 私人运输业者
- 企业用车
第十章 市场估价与预测:依地区划分,2022-2035年
- 北美洲
- 我们
- 加拿大
- 欧洲
- 英国
- 德国
- 法国
- 义大利
- 西班牙
- 比利时
- 荷兰
- 瑞典
- 俄罗斯
- 亚太地区
- 中国
- 印度
- 日本
- 澳洲
- 新加坡
- 韩国
- 越南
- 印尼
- 拉丁美洲
- 巴西
- 墨西哥
- 阿根廷
- 中东和非洲
- 南非
- 沙乌地阿拉伯
- 阿拉伯聯合大公国
第十一章:公司简介
- 世界公司
- Baidu
- EasyMile
- Mobileye
- NVIDIA
- Yutong Bus
- Volvo
- Navya
- Mercedes-Benz
- BYD
- Transdev
- Region players
- Karsan Otomotiv Sanayi
- Scania
- Continental
- Aptiv
- ZF Friedrichshafen
- NFI
- Keolis
- New Flyer
- Aurrigo International
- Lilee Technology
- 新兴企业
- WeRide
- May Mobility
- Local Motors
- Sensible 4
- Mozee
The Global Autonomous Bus Software Market was valued at USD 1.04 billion in 2025 and is estimated to grow at a CAGR of 24.7% to reach USD 9.23 billion by 2035.
The market growth is driven by an increasing global emphasis on sustainable, efficient, and intelligent urban mobility solutions. Cities worldwide are investing in technologies that reduce congestion, lower emissions, and improve the overall passenger experience. Autonomous buses, powered by advanced software, are becoming a critical component of these strategies. The integration of AI, machine learning, sophisticated sensors, and cloud analytics allows buses to navigate in real time, optimize routes, and enhance safety for passengers and pedestrians. Governments, transit authorities, and technology providers are collaborating to accelerate adoption, particularly in smart city initiatives where intelligent transportation systems enable autonomous buses to communicate with infrastructure, other vehicles, and traffic management systems. These partnerships are not only advancing operational efficiency but also helping meet environmental targets, positioning autonomous buses as central to the future of urban public transportation.
| Market Scope | |
|---|---|
| Start Year | 2025 |
| Forecast Year | 2026-2035 |
| Start Value | $1.04 Billion |
| Forecast Value | $9.23 Billion |
| CAGR | 24.7% |
The autonomous driving segment accounted for 36.08% share in 2025 and is projected to grow at a CAGR of 26.1% through 2035. Growth is fueled by the rising adoption of fleet management software that improves operational efficiency and enhances safety. Operators can remotely monitor buses in real time, track technical issues, and respond immediately to delays or malfunctions. IoT-based predictive maintenance helps forecast potential problems before they escalate, reducing downtime and repair costs. The software also includes route optimization and fuel consumption tracking, which contribute to lower operating costs and more efficient fleet management. These factors make autonomous driving software a vital tool for transit operators seeking to enhance reliability and profitability while ensuring passenger safety.
The level 4 autonomous buses segment accounted for USD 671.6 million in 2025. These buses are designed to operate independently within predefined zones, including business districts, campuses, and smart city corridors. AI-powered predictive analytics, real-time traffic updates, and machine learning allow them to navigate complex urban environments efficiently. By continuously adapting to traffic patterns and passenger demand, Level 4 autonomous buses deliver optimized performance. Although regulatory frameworks and infrastructure limitations restrict their widespread deployment on public roads, controlled trials and pilot programs in various cities are helping to refine these systems and accelerate eventual mainstream adoption.
China Autonomous Bus Software Market is expected to register a CAGR of 27.1% from 2026 to 2035. Rapid urbanization, large-scale public transportation upgrades, and smart city initiatives are driving strong demand. Government support for autonomous driving technologies, AI, and intelligent transportation systems is accelerating investment in autonomous bus software solutions. China's emphasis on reducing traffic congestion and environmental pollution, combined with its robust technology ecosystem, makes it a leading market for adoption and innovation in autonomous bus software. Other Asia-Pacific nations are also contributing to regional growth as urban centers embrace smart mobility solutions.
Major companies operating in the Global Autonomous Bus Software Market include Baidu, Waymo, NVIDIA, Aurora Innovation, Mobileye, Easy Mile, Volvo, Yutong Bus, May Mobility, and WeRide. Companies in the autonomous bus software market are employing multiple strategies to strengthen their position and expand market share. They are heavily investing in research and development to enhance AI algorithms, machine learning models, and sensor technologies for safer, more efficient autonomous driving. Strategic partnerships with automotive manufacturers, transit authorities, and city governments are helping companies scale pilot programs and accelerate commercial deployment. Expanding software capabilities to include fleet management, predictive maintenance, and route optimization increases value for operators. Additionally, firms are focusing on global expansion, regulatory compliance, and smart city integration to secure contracts and long-term adoption.
Table of Contents
Chapter 1 Methodology & Scope
- 1.1 Research approach
- 1.2 Quality commitments
- 1.2.1 GMI AI policy & data integrity commitment
- 1.3 Research trail & confidence scoring
- 1.3.1 Research trail components
- 1.3.2 Scoring components
- 1.4 Data collection
- 1.4.1 Partial list of primary sources
- 1.5 Data mining sources
- 1.5.1 Paid sources
- 1.6 Base estimates and calculations
- 1.6.1 Base year calculation
- 1.7 Forecast model
- 1.8 Research transparency addendum
Chapter 2 Executive Summary
- 2.1 Industry 360° synopsis
- 2.2 Key market trends
- 2.2.1 Regional
- 2.2.2 Functionality
- 2.2.3 Level of automation
- 2.2.4 Deployment model
- 2.2.5 Application
- 2.2.6 End Use
- 2.3 TAM Analysis, 2026-2035
- 2.4 CXO perspectives: Strategic imperatives
- 2.4.1 Key decision points for industry executives
- 2.4.2 Critical success factors for market players
- 2.5 Future outlook and strategic recommendations
Chapter 3 Industry Insights
- 3.1 Industry ecosystem analysis
- 3.1.1 Supplier landscape
- 3.1.2 Cost structure
- 3.1.3 Profit margin
- 3.1.4 Value addition at each stage
- 3.1.5 Vertical integration trends
- 3.1.6 Disruptors
- 3.2 Impact on forces
- 3.2.1 Growth drivers
- 3.2.1.1 Rising Demand for Shared Mobility and On-Demand Transport
- 3.2.1.2 Improved Safety and Traffic Management
- 3.2.1.3 Growing Public Awareness and Acceptance
- 3.2.1.4 Rising Interest in Autonomous Vehicles
- 3.2.2 Industry pitfalls & challenges
- 3.2.2.1 Regulatory and Legal Challenges
- 3.2.2.2 High Development and Operational Costs
- 3.2.3 Market opportunities
- 3.2.3.1 AI-driven APM & predictive analytics
- 3.2.3.2 Collaborations and Partnerships with Cities and Transport Operators
- 3.2.1 Growth drivers
- 3.3 Technology trends & innovation ecosystem
- 3.3.1 Current technologies
- 3.3.2 Emerging technologies
- 3.4 Growth potential analysis
- 3.5 Regulatory landscape
- 3.5.1 North America
- 3.5.1.1 U.S. Federal & State Cybersecurity Regulations
- 3.5.1.2 Canada PIPEDA & Provincial Privacy Regulations
- 3.5.2 Europe
- 3.5.2.1 General Data Protection Regulation
- 3.5.2.2 Digital Operational Resilience Act
- 3.5.2.3 NIS2 & Cybersecurity Directives
- 3.5.3 Asia-Pacific
- 3.5.3.1 China Cybersecurity Law & PIPL
- 3.5.3.2 India Digital Personal Data Protection Act
- 3.5.3.3 Japan APPI & MLIT ICT Guidelines
- 3.5.3.4 ASEAN Data Protection & Cybersecurity Frameworks
- 3.5.4 Latin America
- 3.5.4.1 Brazil LGPD (General Data Protection Law)
- 3.5.4.2 Argentina Personal Data Protection Act
- 3.5.4.3 Mexico Federal Data Protection Law & Privacy Regulations
- 3.5.5 Middle East & Africa
- 3.5.5.1 Saudi Arabia National Cybersecurity Authority (NCA) Regulations
- 3.5.5.2 South Africa POPIA (Protection of Personal Information Act)
- 3.5.5.3 UAE Data Protection & ESMA Cybersecurity Standards
- 3.5.1 North America
- 3.6 Porter's analysis
- 3.7 PESTEL analysis
- 3.8 Price trends
- 3.8.1 By region
- 3.8.2 By product
- 3.9 Cost breakdown analysis
- 3.10 Patent analysis
- 3.11 Sustainability and environmental aspects
- 3.11.1 Carbon footprint of navigation systems
- 3.11.2 Circular economic strategies
- 3.11.3 Sustainable navigation features
- 3.11.4 Corporate sustainability initiatives
- 3.11.5 Climate change impact on navigation
- 3.12 Case studies
- 3.13 Operational Readiness & Regional Deployment Feasibility
- 3.14 Safety Validation, Certification & Liability Framework
- 3.15 Infrastructure Dependency & Smart City Integration
Chapter 4 Competitive Landscape, 2025
- 4.1 Introduction
- 4.2 Company market share analysis
- 4.2.1 North America
- 4.2.2 Europe
- 4.2.3 Asia Pacific
- 4.2.4 LATAM
- 4.2.5 MEA
- 4.3 Competitive analysis of major market players
- 4.4 Competitive positioning matrix
- 4.5 Strategic outlook matrix
- 4.6 Key developments
- 4.6.1 Mergers & acquisitions
- 4.6.2 Partnerships & collaborations
- 4.6.3 New product launches
- 4.6.4 Expansion plans and funding
Chapter 5 Market Estimates & Forecast, By Functionality, 2022 - 2035 ($Bn, Units)
- 5.1 Key trends
- 5.2 Fleet management software
- 5.3 Autonomous driving
- 5.4 Traffic management
- 5.5 Passenger management
- 5.6 Safety & security
- 5.7 Bus route design
Chapter 6 Market Estimates & Forecast, By Level of Automation, 2022 - 2035 ($Bn, Units)
- 6.1 Key trends
- 6.2 Level 3
- 6.3 Level 4
- 6.4 Level 5
Chapter 7 Market Estimates & Forecast, By Deployment model, 2022 - 2035 ($Bn, Units)
- 7.1 Key trends
- 7.2 On premises
- 7.3 Cloud-based
- 7.4 Hybrid
Chapter 8 Market Estimates & Forecast, By Application, 2022 - 2035 ($Bn, Units)
- 8.1 Key trends
- 8.2 Public transport
- 8.3 Campus and corporate shuttles
- 8.4 Airport shuttles
- 8.5 Others
Chapter 9 Market Estimates & Forecast, By End Use, 2022 - 2035 ($Bn, Units)
- 9.1 Key trends
- 9.2 Public transportation authorities
- 9.3 Private transport operators
- 9.4 Corporate fleets
Chapter 10 Market Estimates & Forecast, By Region, 2022 - 2035 ($Bn, Units)
- 10.1 North America
- 10.1.1 US
- 10.1.2 Canada
- 10.2 Europe
- 10.2.1 UK
- 10.2.2 Germany
- 10.2.3 France
- 10.2.4 Italy
- 10.2.5 Spain
- 10.2.6 Belgium
- 10.2.7 Netherlands
- 10.2.8 Sweden
- 10.2.9 Russia
- 10.3 Asia Pacific
- 10.3.1 China
- 10.3.2 India
- 10.3.3 Japan
- 10.3.4 Australia
- 10.3.5 Singapore
- 10.3.6 South Korea
- 10.3.7 Vietnam
- 10.3.8 Indonesia
- 10.4 Latin America
- 10.4.1 Brazil
- 10.4.2 Mexico
- 10.4.3 Argentina
- 10.5 MEA
- 10.5.1 South Africa
- 10.5.2 Saudi Arabia
- 10.5.3 UAE
Chapter 11 Company Profiles
- 11.1 Global players
- 11.1.1 Baidu
- 11.1.2 EasyMile
- 11.1.3 Mobileye
- 11.1.4 NVIDIA
- 11.1.5 Yutong Bus
- 11.1.6 Volvo
- 11.1.7 Navya
- 11.1.8 Mercedes-Benz
- 11.1.9 BYD
- 11.1.10 Transdev
- 11.2 Region players
- 11.2.1 Karsan Otomotiv Sanayi
- 11.2.2 Scania
- 11.2.3 Continental
- 11.2.4 Aptiv
- 11.2.5 ZF Friedrichshafen
- 11.2.6 NFI
- 11.2.7 Keolis
- 11.2.8 New Flyer
- 11.2.9 Aurrigo International
- 11.2.10 Lilee Technology
- 11.3 Emerging players
- 11.3.1 WeRide
- 11.3.2 May Mobility
- 11.3.3 Local Motors
- 11.3.4 Sensible 4
- 11.3.5 Mozee
 中国独立汽车製造商的ADAS和自动驾驶技术(2026年)
 低速自动驾驶市场:按类别、组件、最终用户产业和用例划分-2026-2032年全球市场预测
 2026年道路人工智慧(AI)模式标註服务全球市场报告共用自动驾驶汽车市场:按自动驾驶等级、服务模式、动力系统、车辆类型和应用程式划分-2026-2032年全球预测自动驾驶市场:按组件、自动化程度、动力传动系统、车辆类型和最终用户划分-2026年至2032年全球预测
 自动驾驶技术市场-策略洞察与预测(2026-2031年)自动驾驶光达系统市场:按光达类型、侦测范围、车辆类型、安装方式和最终用户划分-全球预测,2026-2032年汽车虚拟ECU市场:策略洞察与预测(2026-2031年)
 自动驾驶系统市场规模、份额和成长分析:按级别、技术、应用和地区划分-2026-2033年产业预测
 端对端神经网路自动驾驶系统市场:机会、成长要素、产业趋势分析及2026年至2035年预测