


 |
市场调查报告书
商品编码
1959595
氢气发生器市场机会、成长要素、产业趋势分析及2026年至2035年预测Hydrogen Generator Market Opportunity, Growth Drivers, Industry Trend Analysis, and Forecast 2026 - 2035 |
||||||
2025 年全球氢气发生器市场价值为 7.68 亿美元,预计到 2035 年将达到 15 亿美元,年复合成长率为 7.2%。
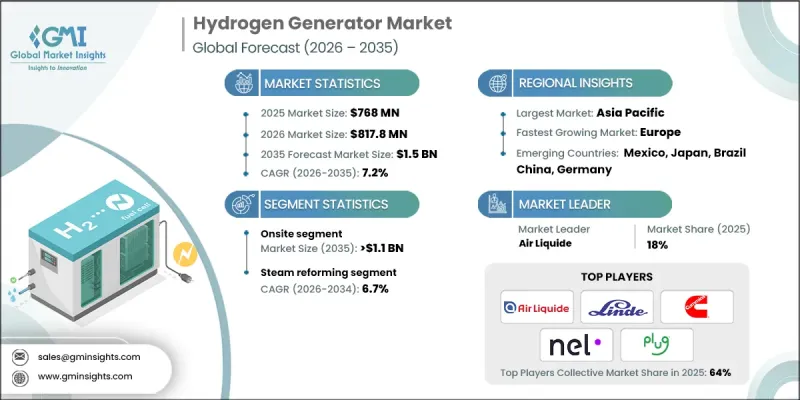
随着世界向清洁能源和低碳产业转型,市场正经历重大变革时期。推动这一成长的主要动力包括电解效率的提升、製造成本的降低以及政府为支持氢能应用而提供的强有力的奖励。针对住宅和商业用电需求的可再生能源项目也进一步促进了这一趋势。各产业对清洁电力的需求不断增长,尤其是在玻璃、金属、化学和食品加工等能源密集产业,这推动了排放的普及应用,而严格的减排目标也加速了投资。实验室、电子製造厂和其他工业设施正在扩大氢气产生器的部署规模,以确保可靠、永续且经济高效的能源解决方案。印度、巴西和中东等新兴经济体正大力投资氢气生产,以满足国内需求和出口目标。先进的监控系统、预测性维护和人工智慧驱动的即时优化正在提高营运效率,并实现与分散式和微电网系统中风能和太阳能等再生能源来源的无缝整合。
| 市场范围 | |
|---|---|
| 开始年份 | 2025 |
| 预测年份 | 2026-2035 |
| 起始值 | 7.68亿美元 |
| 预测金额 | 15亿美元 |
| 复合年增长率 | 7.2% |
预计到2025年,现场氢气生产机市场规模将达到5.58亿美元,2035年将达11亿美元。现场氢气产生系统因其无需运输、储存和管理氢气瓶而日益普及。这些氢气製造机直接安装在用氢点,可提供可靠的按需供氢,同时降低营运成本和易燃风险。维护需求低、易于操作等特点也推动了其进一步普及。加油站和电能转气系统对氢气供应需求的不断增长预计将进一步促进该领域的成长。现场氢气生产机性能稳定、运作安全,是优先考虑效率、成本降低和环境影响减少的产业的理想选择。
预计到2035年,电解领域将以8.3%的复合年增长率增长,这主要得益于人们对绿色氢能日益增长的关注、雄心勃勃的脱碳倡议以及技术的不断进步。电解是一种利用电力将水分解成氢气和氧气的技术,其排放取决于电源供应器的碳排放强度。主要金融机构加大投资,以及质子交换膜(PEM)、碱性电解和固体氧化物(SOE)电解技术的不断进步,正在提高效率、降低成本并加速其应用。在工业、商业和研究领域,基于电解的系统正被越来越多地部署,以确保可靠的氢气生产并实现永续性目标。利用再生能源生产绿色氢能的能力,使电解成为低碳能源转型的基础,进一步推动了市场的长期扩张。
预计到2025年,北美氢气发生器市场将占据19.7%的份额,这主要得益于监管要求和政府主导的旨在建构安全高效氢能基础设施的各项倡议。清洁交通领域氢燃料网路的扩张正在推动市场成长,氢能技术的日益普及也协助该地区向永续能源转型。各公司正不断提升其发生器技术,以满足不断变化的监管要求,力求减少石化燃料消耗并提高能源效率。对先进监控系统、人工智慧优化和系统自动化的投资进一步巩固了市场格局,为工业、商业和能源应用提供可靠的按需氢气供应。
目录
第一章:调查方法和范围
第二章执行摘要
第三章业界考察
- 产业生态系统
- 原物料供应及采购分析
- 製造能力评估
- 供应链韧性与风险因素
- 配电网路分析
- 监管环境
- 影响产业的因素
- 促进因素
- 产业潜在风险与挑战
- 成长潜力分析
- 价格趋势分析
- 按产能
- 按地区
- 成本结构分析
- 波特五力分析
- PESTEL 分析
- 新机会与趋势
- 数位化和物联网集成
- 进入新兴市场
- 投资分析及未来展望
第四章 竞争情势
- 介绍
- 企业市占率分析
- 北美洲
- 欧洲
- 亚太地区
- 中东和非洲
- 拉丁美洲
- 战略仪錶板
- 策略倡议
- 创新与科技趋势
第五章 市场规模及预测:依类型划分,2022-2035年
- 现场
- 可携式的
第六章 市场规模及预测:依製程划分,2022-2035年
- 蒸气重组
- 电解
- 其他的
第七章 市场规模及预测:依应用领域划分,2022-2035年
- 化学处理
- 采油
- 燃料电池
- 炼油厂
- 其他的
第八章 市场规模及预测:依产能划分,2022-2035年
- <100 Nm3/h
- 100~2,000Nm3/h
- 超过2000牛顿米/小时
第九章 市场规模及预测:依地区划分,2022-2035年
- 北美洲
- 我们
- 加拿大
- 欧洲
- 德国
- 英国
- 法国
- 瑞典
- 义大利
- 荷兰
- 亚太地区
- 日本
- 韩国
- 中国
- 印度
- 中东和非洲
- 拉丁美洲
- 巴西
第十章:公司简介
- Air Liquide
- Air Products &Chemicals
- Cummins
- Element 1 Corp
- EPOCH Energy Technology Corp
- F-DGSi
- Idroenergy
- ITM Power
- Linde plc
- LNI Swissgas AG
- McPhy Energy
- Nel ASA
- Plug Power
- Peak Scientific Instruments
- Praxair Technology
- Proton Onsite
- Siemens Energy
- Teledyne Energy Systems
- Toshiba Energy Systems &Solutions Corp.
- Xebec Adsorption Inc.
The Global Hydrogen Generator Market was valued at USD 768 million in 2025 and is estimated to grow at a CAGR of 7.2% to reach USD 1.5 billion by 2035.
The market is undergoing significant transformation as the world transitions toward clean energy and industrial decarbonization. Growth is driven by advancements in electrolyzer efficiency, reductions in production costs, and robust government incentives supporting hydrogen deployment. Renewable energy programs targeting residential and commercial electricity needs are providing additional momentum. Rising demand for clean power across industrial sectors, particularly in energy-intensive industries like glass, metals, chemicals, and food processing, is boosting adoption, while strict emissions-reduction targets accelerate investment. Laboratories, electronics manufacturing facilities, and other industrial operations are increasingly integrating hydrogen generators to ensure reliable, sustainable, and cost-effective energy solutions. Emerging economies, including India, Brazil, and nations in the Middle East, are investing heavily in hydrogen production to meet both domestic needs and export ambitions. Advanced monitoring systems, predictive maintenance, and AI-driven real-time optimization are improving operational efficiency, enabling seamless integration with renewable sources such as wind and solar in distributed and microgrid systems.
| Market Scope | |
|---|---|
| Start Year | 2025 |
| Forecast Year | 2026-2035 |
| Start Value | $768 Million |
| Forecast Value | $1.5 Billion |
| CAGR | 7.2% |
The on-site hydrogen generator segment generated USD 558 million in 2025 and is expected to reach USD 1.1 billion by 2035. On-site systems are increasingly favored because they eliminate the need for transporting, storing, and managing hydrogen cylinders. Installed directly at the point of use, these generators provide a reliable, on-demand supply while reducing operational costs and flammability risks. Minimal maintenance requirements and easy handling further enhance adoption. The growing demand for continuous hydrogen supply in applications such as fueling stations and power-to-gas systems is expected to strengthen the segment's growth. On-site generators offer consistent performance and operational safety, making them the preferred choice for industries prioritizing efficiency, cost savings, and reduced environmental impact.
The electrolysis segment is projected to grow at a CAGR of 8.3% by 2035, driven by the rising emphasis on green hydrogen, ambitious decarbonization initiatives, and ongoing technological improvements. Electrolysis splits water into hydrogen and oxygen using electricity, with emissions determined by the carbon intensity of the power source. Increasing investments from major financial institutions and continuous advancements in PEM, Alkaline, and SOE electrolyzer technologies are improving efficiency and reducing costs, accelerating adoption. Industrial, commercial, and laboratory applications are increasingly deploying electrolysis-based systems to meet sustainability targets while ensuring reliable hydrogen production. The ability to generate green hydrogen from renewable electricity positions electrolysis as a cornerstone of the low-carbon energy transition, further supporting long-term market expansion.
North America Hydrogen Generator Market accounted for 19.7% share in 2025, driven by regulatory mandates and government initiatives aimed at creating safe and efficient hydrogen infrastructure. Expansion of hydrogen fueling networks for clean transportation is boosting market growth, while increased adoption of hydrogen technologies supports the region's shift toward sustainable energy. Companies are enhancing generator technologies to meet evolving regulatory requirements, targeting reduced fossil fuel consumption and improved energy efficiency. Investments in advanced monitoring, AI-enabled optimization, and system automation further strengthen the market landscape, enabling reliable, on-demand hydrogen supply for industrial, commercial, and energy applications.
Key players in the Global Hydrogen Generator Market include Linde plc, ITM Power, McPhy Energy, Air Liquide, Cummins, Plug Power, Nel ASA, Proton Onsite, Siemens Energy, Teledyne Energy Systems, Toshiba Energy Systems & Solutions, Air Products & Chemicals, Peak Scientific Instruments, EPOCH Energy Technology, Element 1, F-DGSi, Idroenergy, LNI Swissgas, and Praxair Technology. Companies in the Hydrogen Generator Market are leveraging multiple strategies to reinforce their presence and expand market share. Product innovation is central, with firms developing high-capacity, energy-efficient, and AI-integrated hydrogen generators to meet industrial, commercial, and laboratory demands. Strategic partnerships with renewable energy providers, electrolyzer manufacturers, and infrastructure developers enable broader market penetration. Geographic expansion into emerging economies allows companies to capitalize on growing energy and export needs. Investment in research and development is focused on improving electrolyzer efficiency, reducing operating costs, and enhancing system reliability.
Table of Contents
Chapter 1 Methodology & Scope
- 1.1 Research design
- 1.1.1 Research approach
- 1.1.2 Data collection methods
- 1.2 Base estimates and calculations
- 1.2.1 Base year calculation
- 1.2.2 Key trends for market estimates
- 1.3 Forecast model
- 1.3.1 Key trends for market estimates
- 1.3.1.1 Quantified market impact analysis
- 1.3.1.2 Mathematical impact of growth parameters on forecast
- 1.3.2 Scenario analysis framework
- 1.3.1 Key trends for market estimates
- 1.4 Primary research and validation
- 1.4.1 Some of the primary sources (but not limited to)
- 1.5 Data mining sources
- 1.5.1 Paid Sources
- 1.5.2 Sources, by region
- 1.6 Research trail & scoring components
- 1.6.1 Research trail components
- 1.6.2 Scoring components
- 1.7 Research transparency addendum
- 1.7.1 Source attribution framework
- 1.7.2 Quality assurance metrics
- 1.7.3 Our commitment to trust
- 1.8 Market definitions
Chapter 2 Executive Summary
- 2.1 Industry 360-degree synopsis, 2022 - 2035
- 2.2 Business trends
- 2.3 Type trends
- 2.4 Process trends
- 2.5 Application trends
- 2.6 Capacity trends
- 2.7 Regional trends
Chapter 3 Industry Insights
- 3.1 Industry ecosystem
- 3.1.1 Raw material availability & sourcing analysis
- 3.1.2 Manufacturing capacity assessment
- 3.1.3 Supply chain resilience & risk factors
- 3.1.4 Distribution network analysis
- 3.2 Regulatory landscape
- 3.3 Industry impact forces
- 3.3.1 Growth drivers
- 3.3.2 Industry pitfalls & challenges
- 3.4 Growth potential analysis
- 3.5 Price trend analysis
- 3.5.1 By capacity
- 3.5.2 By region
- 3.6 Cost structure analysis
- 3.7 Porter's analysis
- 3.7.1 Bargaining power of suppliers
- 3.7.2 Bargaining power of buyers
- 3.7.3 Threat of new entrants
- 3.7.4 Threat of substitutes
- 3.8 PESTEL analysis
- 3.8.1 Political factors
- 3.8.2 Economic factors
- 3.8.3 Social factors
- 3.8.4 Technological factors
- 3.8.5 Legal factors
- 3.8.6 Environmental factors
- 3.9 Emerging opportunities & trends
- 3.9.1 Digitalization & IoT integration
- 3.9.2 Emerging market penetration
- 3.10 Investment analysis and future outlook
Chapter 4 Competitive landscape, 2026
- 4.1 Introduction
- 4.2 Company market share analysis, 2025
- 4.2.1 North America
- 4.2.2 Europe
- 4.2.3 Asia Pacific
- 4.2.4 Middle East & Africa
- 4.2.5 Latin America
- 4.3 Strategic dashboard
- 4.4 Strategic initiatives
- 4.5 Innovation & technology landscape
Chapter 5 Market Size and Forecast, By Type, 2022 - 2035 (USD Million)
- 5.1 Key trends
- 5.2 Onsite
- 5.3 Portable
Chapter 6 Market Size and Forecast, By Process, 2022 - 2035 (USD Million)
- 6.1 Key trends
- 6.2 Steam Reforming
- 6.3 Electrolysis
- 6.4 Others
Chapter 7 Market Size and Forecast, By Application, 2022 - 2035 (USD Million)
- 7.1 Key trends
- 7.2 Chemical Processing
- 7.3 Petroleum Recovery
- 7.4 Fuel Cells
- 7.5 Refinery
- 7.6 Others
Chapter 8 Market Size and Forecast, By Capacity, 2022 - 2035 (USD Million)
- 8.1 Key trends
- 8.2 <100 Nm3/h
- 8.3 100-2,000Nm3/h
- 8.4 >2,000Nm3/h
Chapter 9 Market Size and Forecast, By Region, 2022 - 2035 (USD Million)
- 9.1 Key trends
- 9.2 North America
- 9.2.1 U.S.
- 9.2.2 Canada
- 9.3 Europe
- 9.3.1 Germany
- 9.3.2 UK
- 9.3.3 France
- 9.3.4 Sweden
- 9.3.5 Italy
- 9.3.6 Netherlands
- 9.4 Asia Pacific
- 9.4.1 Japan
- 9.4.2 South Korea
- 9.4.3 China
- 9.4.4 India
- 9.5 Middle East & Africa
- 9.6 Latin America
- 9.6.1 Brazil
Chapter 10 Company Profiles
- 10.1 Air Liquide
- 10.2 Air Products & Chemicals
- 10.3 Cummins
- 10.4 Element 1 Corp
- 10.5 EPOCH Energy Technology Corp
- 10.6 F-DGSi
- 10.7 Idroenergy
- 10.8 ITM Power
- 10.9 Linde plc
- 10.10 LNI Swissgas AG
- 10.11 McPhy Energy
- 10.12 Nel ASA
- 10.13 Plug Power
- 10.14 Peak Scientific Instruments
- 10.15 Praxair Technology
- 10.16 Proton Onsite
- 10.17 Siemens Energy
- 10.18 Teledyne Energy Systems
- 10.19 Toshiba Energy Systems & Solutions Corp.
- 10.20 Xebec Adsorption Inc.
 2026年全球氢气发生器市场报告
 氢气发生器市场(按生产方法、技术、应用、压力和分布)—2025-2032 年全球预测
 2032 年氢气发生器市场预测:按产品类型、製程、供应模式、产能、来源、应用和地区进行的全球分析
 氢气发生器市场规模、份额、趋势分析报告:按产品、製程、应用、地区和细分市场预测,2025 年至 2030 年
 氢气发生器市场规模、份额及成长分析(按类型、来源、技术、供应模式、应用和地区)-2025-2032 年产业预测
 氢气发生器市场:成长、未来展望与竞争分析,2025-2033 年
 便携式氢气发生器市场、机会、成长动力、产业趋势分析与预测,2024-2032现场氢气发生器市场 - 按製程(蒸汽甲烷重整、电解)、按容量、按应用(化学加工、石油回收、燃料电池、炼油厂)、区域预测和展望,2024 - 2032 年