


 |
市场调查报告书
商品编码
1959597
汽车皮带张紧轮市场:机会、成长要素、产业趋势分析及2026年至2035年预测Automotive Belt Tensioner Pulleys Market Opportunity, Growth Drivers, Industry Trend Analysis, and Forecast 2026 - 2035 |
||||||
2025 年全球汽车皮带张紧轮市场价值为 34 亿美元,预计到 2035 年将达到 54 亿美元,年复合成长率为 4.6%。
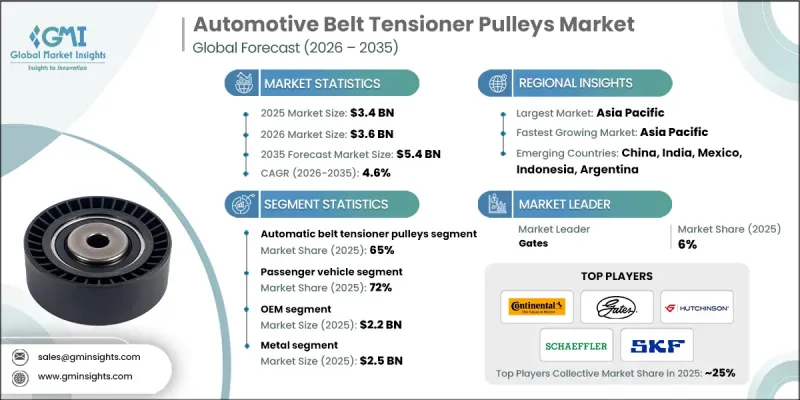
市场成长依赖内燃机和混合动力汽车的持续主导地位,在中期内,它们将占据全球车辆运作的大多数。这些汽车平臺依靠皮带传动系统来实现稳定的机械性能,而皮带张紧轮是确保可靠性和效率的关键部件。儘管电动车的市场份额持续成长,但混合动力平台仍保留了传统的皮带结构,这有助于整体需求的稳定性。较长的车辆生命週期、稳定的更换需求以及不断提升耐久性和性能的技术进步,都为市场带来了益处。现代动力传动系统的机械复杂性日益增加,对皮带系统提出了更高的运行负荷,因此需要更精确设计的张力解决方案。因此,即使不同地区的车辆产量有所波动,在整车製造商需求和稳健的更换週期支撑下,市场仍保持稳定成长。
| 市场范围 | |
|---|---|
| 开始年份 | 2025 |
| 预测年份 | 2026-2035 |
| 起始值 | 34亿美元 |
| 预测金额 | 54亿美元 |
| 复合年增长率 | 4.6% |
汽车皮带张紧轮由于持续的运转应力而逐渐发生机械劣化,因此在车辆的整个使用寿命期间都需要更换。全球汽车保有量的成长,尤其是在已开发国家和新兴国家老旧车辆的增多,为售后市场需求提供了持续的支撑。这种更换需求能够带来稳定的收入,并抵消新车产量短期波动的影响,从而增强长期成长前景。
自动皮带张紧轮细分市场预计在2025年将占据65%的市场份额,并在2035年之前以5.1%的复合年增长率成长。这些系统能够自动维持最佳皮带张力,正逐渐成为现代内燃机和混合动力汽车的标准配备。这有助于降低驾驶风险、延长零件寿命并提高系统整体可靠性。
预计到 2025 年,OEM 市场规模将达到 22 亿美元。 OEM 需求与全球内燃机和混合动力汽车的生产保持同步,这主要得益于长期供应商合同,这些合约强调工程合作、成本效益、品质合规性以及早期融入车辆开发计划。
预计2025年,美国汽车皮带张紧轮市场规模将达7.931亿美元。车辆在高机械负载下运作的需求推动了市场成长,进而带动了对先进张紧轮设计和高价值零件的需求。此外,完善的售后市场基础也进一步增强了替换需求,并提升了全国市场的稳定性。
目录
第一章:调查方法和范围
第二章执行摘要
第三章业界考察
- 生态系分析
- 供应商情况
- 製造商
- 零件供应商
- 服务供应商
- 销售代理
- 最终用户
- 成本结构
- 利润率
- 每个阶段增加的价值
- 影响供应链的因素
- 颠覆者
- 供应商情况
- 影响因素
- 促进因素
- 内燃机汽车和混合动力汽车。
- 全球庞大且老化的汽车保有量正在推动售后市场需求。
- 附件负载增加和引擎复杂性增加
- 原始设备製造商 (OEM) 专注于降低噪音、振动与声振粗糙度 (NVH) 并提高耐久性
- 产业潜在风险与挑战
- 加速汽车动力传动系统的电气化
- 液压动力方向盘系统的迅速衰落
- 市场机会
- 扩大混合动力汽车生产
- 售后维修套件和系统解决方案的成长
- 新兴市场汽车产量成长
- 轻量化低摩擦滑轮设计创新
- 促进因素
- 成长潜力分析
- 监管环境
- 北美洲
- FMVSS(联邦机动车辆安全标准)
- 美国环保署排放法规
- 加州空气资源委员会 (CARB)排放标准
- 欧洲
- 欧盟型式认可架构(欧盟法规 2018/858)
- 欧6和欧7排放气体法规
- 报废车辆(ELV)指令
- REACH法规
- OEM 特定 NVH 和耐久性合规标准
- 亚太地区
- 印度第六阶段排放气体标准(BS VI)
- 印度汽车产业标准 (AIS)
- 中国第六版排放气体法规
- 中国强制产品安全监督管理委员会认证(CCC)
- 日本汽车标准与法规(JASO/国土交通省)
- 拉丁美洲
- PROCONVE排放标准 - 巴西
- InMetro汽车认证 - 巴西
- 墨西哥国家车辆安全与排放气体标准
- 南方共同市场汽车产业法规结构
- 中东和非洲
- 海湾合作委员会标准化组织(GSO)车辆法规
- 沙乌地阿拉伯标准、计量和品质组织(SASO)
- 南非标准局(SABS)汽车法规
- 北美洲
- 波特的分析
- PESTEL 分析
- 科技与创新趋势
- 当前技术趋势
- 新兴技术
- 价格分析
- 副产品
- 按地区
- 成本細項分析
- 供应商成本结构
- 成本构成要素的引入
- 持续营运成本
- 间接客户成本
- 生产统计
- 生产基地
- 消费者群体
- 出口和进口
- 专利分析
- 电气化的影响
- 减少电池电动车中的皮带传动部件
- 对混合动力和轻度混合动力传动系统的持续需求
- 辅助系统的电气化导致滑轮的使用量减少。
- 电气化影响的区域差异
- 大型内燃机售后市场需求支持
- 永续性和环境方面
- 永续努力
- 减少废弃物策略
- 生产中的能源效率
- 具有环保意识的倡议
- 碳足迹考量
- 未来前景与机会
第四章 竞争情势
- 介绍
- 企业市占率分析
- 北美洲
- 欧洲
- 亚太地区
- 拉丁美洲
- 中东和非洲
- 主要市场公司的竞争分析
- 竞争定位矩阵
- 战略展望矩阵
- 主要进展
- 併购
- 伙伴关係与合作
- 新产品发布
- 业务拓展计划及资金筹措
第五章 市场估价与预测:依产品划分,2022-2035年
- 自动皮带张紧轮
- 手动皮带张紧轮
第六章 市场估价与预测:依车辆类型划分,2022-2035年
- 搭乘用车
- 掀背车
- 轿车
- SUV
- 商用车辆
- 轻型商用车(LCV)
- 中型商用车(MCV)
- 重型商用车(HCV)
第七章 市场估计与预测:依材料划分,2022-2035年
- 金属
- 塑胶
第八章 市场估计与预测:依应用领域划分,2022-2035年
- 引擎正时系统
- 交流发电机系统
- 动力方向盘系统
- 空调系统
- 水泵系统
- 其他的
第九章 市场估价与预测:依销售管道划分,2022-2035年
- OEM
- 售后市场
第十章 市场估价与预测:依地区划分,2022-2035年
- 北美洲
- 我们
- 加拿大
- 欧洲
- 德国
- 英国
- 法国
- 义大利
- 西班牙
- 俄罗斯
- 挪威
- 丹麦
- 比利时
- 荷兰
- 亚太地区
- 中国
- 印度
- 日本
- 澳洲
- 韩国
- 泰国
- 印尼
- 新加坡
- 拉丁美洲
- 巴西
- 墨西哥
- 阿根廷
- 智利
- 中东和非洲
- 南非
- 沙乌地阿拉伯
- 阿拉伯聯合大公国
第十一章:公司简介
- Global leaders
- Aisin Seiki
- Continental
- Dayco Products
- Gates
- Hutchinson
- NSK
- NTN
- Schaeffler
- SKF
- The Timken Company
- 本地製造商
- Tsubaki Automotive
- Bando Chemical Industries
- Federal-Mogul Motorparts
- Mevotech
- Delphi
- VDO
- NTN-SNR
- Marelli
- Mahle
- Febi Bilstein
- Cloyes Gear &Products
- Denso
- 新兴企业
- Litens Automotive
- Mubea
- GMB
- Roulunds Braking
- Cloyes Gear &Products
The Global Automotive Belt Tensioner Pulleys Market was valued at USD 3.4 billion in 2025 and is estimated to grow at a CAGR of 4.6% to reach USD 5.4 billion by 2035.
Market growth remains tied to the continued dominance of internal combustion engines and hybrid vehicles, which together represent many vehicles in operation worldwide over the medium term. These vehicle platforms depend on belt-driven systems for consistent mechanical performance, making belt tensioner pulleys a critical component for reliability and efficiency. While electric vehicles continue to expand their presence, hybrid platforms retain conventional belt architectures, helping stabilize overall demand. The market benefits from long vehicle life cycles, steady replacement requirements, and ongoing engineering refinements that improve durability and performance. Growing mechanical complexity within modern powertrains places higher operational stress on belt systems, increasing the need for accurately engineered tensioning solutions. As a result, the market continues to show steady expansion supported by both original equipment demand and a resilient replacement cycle, even as vehicle production volumes fluctuate across regions.
| Market Scope | |
|---|---|
| Start Year | 2025 |
| Forecast Year | 2026-2035 |
| Start Value | $3.4 Billion |
| Forecast Value | $5.4 Billion |
| CAGR | 4.6% |
Automotive belt tensioner pulleys experience gradual mechanical degradation due to constant operational stress, making replacement essential over a vehicle's lifetime. An expanding global vehicle population, particularly aging fleets in developed and emerging regions, continues to support consistent aftermarket demand. This replacement-driven consumption provides revenue stability and offsets short-term variations in new vehicle output, reinforcing the long-term growth outlook.
The automatic belt tensioner pulleys segment accounted for 65% share in 2025 and is projected to grow at a CAGR of 5.1% through 2035. These systems have become standard across modern internal combustion and hybrid vehicles due to their ability to maintain optimal belt force automatically, reducing operational risk and extending component lifespan while improving overall system reliability.
The OEM segment reached USD 2.2 billion in 2025. OEM demand remains aligned with global production of internal combustion and hybrid vehicles, supported by long-term supplier agreements that emphasize engineering collaboration, cost efficiency, quality compliance, and early-stage integration into vehicle development programs.
United States Automotive Belt Tensioner Pulleys Market generated USD 793.1 million in 2025. Demand is supported by vehicles operating under higher mechanical loads, which increases requirements for advanced tensioner designs and higher-value components. A well-developed aftermarket infrastructure further strengthens replacement demand and enhances market stability nationwide.
Key companies operating in the Global Automotive Belt Tensioner Pulleys Market include Schaeffler, Gates, Continental, SKF, NTN, Dayco Products, Hutchinson, Aisin Seiki, Litens Automotive, and NSK Automation. Companies in the automotive belt tensioner pulleys market are reinforcing their market position through product innovation, material advancements, and close collaboration with vehicle manufacturers. Many suppliers are investing in next-generation designs that enhance durability, reduce noise, and improve thermal performance. Expansion of manufacturing capacity in key automotive regions is helping companies optimize costs and ensure supply reliability. Firms are also strengthening aftermarket distribution networks to capture recurring replacement demand.
Table of Contents
Chapter 1 Methodology & Scope
- 1.1 Research approach
- 1.2 Quality Commitments
- 1.2.1 GMI AI policy & data integrity commitment
- 1.3 Research Trail & Confidence Scoring
- 1.3.1 Research trail components
- 1.3.2 Scoring components
- 1.4 Data Collection
- 1.4.1 Partial list of primary sources
- 1.5 Data mining sources
- 1.5.1 Paid sources
- 1.6 Base estimates and calculations
- 1.6.1 Base year calculation
- 1.7 Forecast model
- 1.8 Research transparency addendum
Chapter 2 Executive Summary
- 2.1 Industry 360° synopsis, 2022-2035
- 2.2 Key market trends
- 2.2.1 Regional
- 2.2.2 Product
- 2.2.3 Vehicle
- 2.2.4 Material
- 2.2.5 Application
- 2.2.6 Sales Channel
- 2.3 TAM Analysis, 2026-2035
- 2.4 CXO perspectives: Strategic imperatives
- 2.4.1 Key decision points for industry executives
- 2.4.2 Critical success factors for market players
- 2.5 Future outlook and strategic recommendations
Chapter 3 Industry Insights
- 3.1 Industry ecosystem analysis
- 3.1.1 Supplier landscape
- 3.1.1.1 Manufacturers
- 3.1.1.2 Component suppliers
- 3.1.1.3 Service providers
- 3.1.1.4 Distributors
- 3.1.1.5 End-users
- 3.1.2 Cost structure
- 3.1.3 Profit margin
- 3.1.4 Value addition at each stage
- 3.1.5 Factors impacting the supply chain
- 3.1.6 Disruptors
- 3.1.1 Supplier landscape
- 3.2 Impact on forces
- 3.2.1 Growth drivers
- 3.2.1.1 Continued dominance of ICE and hybrid vehicle parcels
- 3.2.1.2 Large and aging global vehicle fleet driving aftermarket demand
- 3.2.1.3 Increasing accessory load and engine complexity
- 3.2.1.4 OEM focus on NVH reduction and durability
- 3.2.2 Industry pitfalls & challenges
- 3.2.2.1 Accelerating electrification of vehicle powertrains
- 3.2.2.2 Rapid decline of hydraulic power steering systems
- 3.2.3 Market opportunities
- 3.2.3.1 Expansion of hybrid vehicle production
- 3.2.3.2 Growth in aftermarket repair kits and system solutions
- 3.2.3.3 Vehicle production growth in emerging markets
- 3.2.3.4 Innovation in lightweight and low-friction pulley designs
- 3.2.1 Growth drivers
- 3.3 Growth potential analysis
- 3.4 Regulatory landscape
- 3.4.1 North America
- 3.4.1.1 FMVSS (Federal Motor Vehicle Safety Standards - United States)
- 3.4.1.2 EPA Emission Regulations (United States)
- 3.4.1.3 CARB Emission Standards (California Air Resources Board)
- 3.4.2 Europe
- 3.4.2.1 EU Type Approval Framework (Regulation (EU) 2018/858)
- 3.4.2.2 Euro 6 and Euro 7 Emission Standards
- 3.4.2.3 End-of-Life Vehicles (ELV) Directive
- 3.4.2.4 REACH Regulation
- 3.4.2.5 OEM-Specific NVH and Durability Compliance Standards
- 3.4.3 Asia Pacific
- 3.4.3.1 Bharat Stage VI (BS VI) Emission Norms - India
- 3.4.3.2 Automotive Industry Standards (AIS) - India
- 3.4.3.3 China VI Emission Standards
- 3.4.3.4 China Compulsory Certification (CCC)
- 3.4.3.5 Japan Automotive Standards and Regulations (JASO / MLIT)
- 3.4.4 Latin America
- 3.4.4.1 PROCONVE Emission Standards - Brazil
- 3.4.4.2 Inmetro Automotive Certification - Brazil
- 3.4.4.3 NOM Vehicle Safety and Emission Standards - Mexico
- 3.4.4.4 Mercosur Automotive Regulatory Framework
- 3.4.5 Middle East & Africa
- 3.4.5.1 GCC Standardization Organization (GSO) Vehicle Regulations
- 3.4.5.2 Saudi Standards, Metrology and Quality Organization (SASO)
- 3.4.5.3 South African Bureau of Standards (SABS) Automotive Regulations
- 3.4.1 North America
- 3.5 Porter’s analysis
- 3.6 PESTEL analysis
- 3.7 Technology and innovation landscape
- 3.7.1 Current technological trends
- 3.7.2 Emerging technologies
- 3.8 Pricing analysis
- 3.8.1 By product
- 3.8.2 By region
- 3.9 Cost breakdown analysis
- 3.9.1 Vendor cost structure
- 3.9.2 Implementation of cost components
- 3.9.3 Ongoing operational costs
- 3.9.4 Indirect customer costs
- 3.10 Production statistics
- 3.10.1 Production hubs
- 3.10.2 Consumption hubs
- 3.10.3 Export and import
- 3.11 Patent analysis
- 3.12 Impact of Electrification
- 3.12.1 Reduction of belt-driven components in battery electric vehicles
- 3.12.2 Sustained demand from hybrid and mild-hybrid powertrains
- 3.12.3 Electrification of auxiliary systems reducing pulley applications
- 3.12.4 Regional variation in electrification impact
- 3.12.5 Aftermarket demand support from large ICE vehicle
- 3.13 Sustainability and environmental aspects
- 3.13.1 Sustainable practices
- 3.13.2 Waste reduction strategies
- 3.13.3 Energy efficiency in production
- 3.13.4 Eco-friendly initiatives
- 3.13.5 Carbon footprint considerations
- 3.14 Future outlook and opportunities
Chapter 4 Competitive Landscape, 2025
- 4.1 Introduction
- 4.2 Company market share analysis
- 4.2.1 North America
- 4.2.2 Europe
- 4.2.3 Asia Pacific
- 4.2.4 LATAM
- 4.2.5 MEA
- 4.3 Competitive analysis of major market players
- 4.4 Competitive positioning matrix
- 4.5 Strategic outlook matrix
- 4.6 Key developments
- 4.6.1 Mergers & acquisitions
- 4.6.2 Partnerships & collaborations
- 4.6.3 New product launches
- 4.6.4 Expansion plans and funding
Chapter 5 Market Estimates & Forecast, By Product, 2022 - 2035 ($Bn, Units)
- 5.1 Key trends
- 5.2 Automatic belt tensioner pulleys
- 5.3 Manual belt tensioner pulleys
Chapter 6 Market Estimates & Forecast, By Vehicle, 2022 - 2035 ($Bn, Units)
- 6.1 Key trends
- 6.2 Passenger vehicle
- 6.2.1 Hatchback
- 6.2.2 Sedan
- 6.2.3 SUVs
- 6.3 Commercial vehicle
- 6.3.1 Light commercial vehicles (LCVs)
- 6.3.2 Medium commercial vehicles (MCVs)
- 6.3.3 Heavy commercial vehicles (HCVs)
Chapter 7 Market Estimates & Forecast, By Material, 2022 - 2035 ($Bn, Units)
- 7.1 Key trends
- 7.2 Metal
- 7.3 Plastic
Chapter 8 Market Estimates & Forecast, By Application, 2022 - 2035 ($Bn, Units)
- 8.1 Key trends
- 8.2 Engine timing system
- 8.3 Alternator system
- 8.4 Power steering system
- 8.5 Air conditioning system
- 8.6 Water pump system
- 8.7 Others
Chapter 9 Market Estimates & Forecast, By Sales Channel, 2022 - 2035 ($Bn, Units)
- 9.1 Key trends
- 9.2 OEM
- 9.3 Aftermarket
Chapter 10 Market Estimates & Forecast, By Region, 2022 - 2035 ($Bn, Units)
- 10.1 Key trends
- 10.2 North America
- 10.2.1 US
- 10.2.2 Canada
- 10.3 Europe
- 10.3.1 Germany
- 10.3.2 UK
- 10.3.3 France
- 10.3.4 Italy
- 10.3.5 Spain
- 10.3.6 Russia
- 10.3.7 Norway
- 10.3.8 Denmark
- 10.3.9 Belgium
- 10.3.10 Netherlands
- 10.4 Asia Pacific
- 10.4.1 China
- 10.4.2 India
- 10.4.3 Japan
- 10.4.4 Australia
- 10.4.5 South Korea
- 10.4.6 Thailand
- 10.4.7 Indonesia
- 10.4.8 Singapore
- 10.5 Latin America
- 10.5.1 Brazil
- 10.5.2 Mexico
- 10.5.3 Argentina
- 10.5.4 Chile
- 10.6 MEA
- 10.6.1 South Africa
- 10.6.2 Saudi Arabia
- 10.6.3 UAE
Chapter 11 Company Profiles
- 11.1 Global leaders
- 11.1.1 Aisin Seiki
- 11.1.2 Continental
- 11.1.3 Dayco Products
- 11.1.4 Gates
- 11.1.5 Hutchinson
- 11.1.6 NSK
- 11.1.7 NTN
- 11.1.8 Schaeffler
- 11.1.9 SKF
- 11.1.10 The Timken Company
- 11.2 Regional players
- 11.2.1 Tsubaki Automotive
- 11.2.2 Bando Chemical Industries
- 11.2.3 Federal-Mogul Motorparts
- 11.2.4 Mevotech
- 11.2.5 Delphi
- 11.2.6 VDO
- 11.2.7 NTN-SNR
- 11.2.8 Marelli
- 11.2.9 Mahle
- 11.2.10 Febi Bilstein
- 11.2.11 Cloyes Gear & Products
- 11.2.12 Denso
- 11.3 Emerging players
- 11.3.1 Litens Automotive
- 11.3.2 Mubea
- 11.3.3 GMB
- 11.3.4 Roulunds Braking
- 11.3.5 Cloyes Gear & Products


