


 |
市场调查报告书
商品编码
1959620
颗粒物监测市场机会、成长要素、产业趋势分析及2026年至2035年预测Particulate Matter Monitoring Market Opportunity, Growth Drivers, Industry Trend Analysis, and Forecast 2026 - 2035 |
||||||
2025 年全球粒状物监测市场价值 18 亿美元,预计到 2035 年将达到 49 亿美元,年复合成长率为 10.5%。
该市场专注于检测空气中的固体颗粒和液滴(灰尘、烟尘、烟雾等),特别是PM2.5和PM10的浓度,以评估空气品质。包括高精度参考站、具备即时连接的携带式人工智慧感测器以及基于物联网的设备在内的先进监测解决方案,正越来越多地部署于室内外环境。这些系统对于公共卫生风险评估、法规遵循和污染控制措施至关重要。全球都市化和工业化,以及日益严格的空气品质法规,正在推动对精确PM监测的需求。各国政府和环保机构正在大力投资监测基础设施和分析平台,以提供可靠的数据用于政策制定、城市规划和公共卫生保护。技术进步和监管压力的协同作用正在加速PM监测系统的全球部署。
| 市场范围 | |
|---|---|
| 开始年份 | 2025 |
| 预测年份 | 2026-2035 |
| 起始值 | 18亿美元 |
| 预测金额 | 49亿美元 |
| 复合年增长率 | 10.5% |
预计到2035年,光学粒子计数器(OPC)/雷射散射技术市场将以11.2%的复合年增长率成长,目前占据市场主导地位。其主导地位源自于其高测量精度、即时监测能力以及检测多种粒径颗粒的能力。这些系统被广泛用于追踪空气品质和排放,并确保符合相关法规。雷射散射和OPC技术的不断进步正在创造新的机会,例如提高感测器灵敏度、增强校准稳定性以及使用更少的设备进行全面的数据分析。製造商正致力于这些改进,以满足工业、城市和室内应用领域对精准高效监控解决方案日益增长的需求。
预计到2025年,PM2.5(粒径小于或等于2.5微米)市场规模将达到8.396亿美元,占据颗粒物监测市场最大份额。 PM2.5暴露与呼吸系统疾病和心血管疾病等健康风险之间存在密切关联,这支撑了其市场主导地位。人们对PM2.5数据的认识不断提高,以及其在公共卫生政策、城市规划和污染减排计画中的应用,都推动了对监测系统的需求。製造商正优先开发紧凑、低维护的PM2.5设备,并将其整合到数位空气品质网路中,以支援法规遵从,并扩大其在工业、城市和室内环境中的应用。
美国粒状物监测市场预计2025年将达到7.193亿美元。该地区持续引领产业发展,主要得益于公众健康、都市区建设等措施的日益重视。联邦政府对空气品质基础设施的大力投资、严格的环境法规以及主要产业参与者的存在,共同巩固了北美市场的主导地位。美国製造商正利用技术创新、与政府机构的合作以及基于云端的分析技术,开发扩充性、精准且实用的颗粒物监测解决方案,从而提高监测效率和系统互通性。
目录
第一章:调查方法和范围
第二章执行摘要
第三章业界考察
- 生态系分析
- 供应商情况
- 利润率
- 成本结构
- 每个阶段增加的价值
- 影响价值链的因素
- 中断
- 影响产业的因素
- 促进因素
- 加强政府有关空气品质监测的法规和标准
- 监测大气环境变得越来越重要。
- 汽车和交通运输行业对颗粒物水平的要求不断提高。
- 人们对颗粒物相关健康风险的认识不断提高
- PM监测系统的持续进步
- 产业潜在风险与挑战
- PM监测设备的安装和维护可能具有挑战性。
- 发展中国家PM监测解决方案实施的延误
- 市场机会
- 智慧城市和数位环境基础设施的扩展
- 对室内空气品质监测的需求不断增长
- 促进因素
- 成长潜力分析
- 监管环境
- 北美洲
- 欧洲
- 亚太地区
- 拉丁美洲
- 中东和非洲
- 波特的分析
- PESTEL 分析
- 科技与创新趋势
- 当前技术趋势
- 新兴技术
- 价格趋势
- 历史价格分析(2022-2024)
- 影响价格趋势的因素
- 区域价格差异
- 价格预测(2026-2035)
- 定价策略
- 新兴经营模式
- 合规要求
第四章 竞争情势
- 介绍
- 企业市占率分析
- 按地区
- 北美洲
- 欧洲
- 亚太地区
- 拉丁美洲
- 中东和非洲
- 市场集中度分析
- 按地区
- 主要企业的竞争标竿分析
- 财务绩效比较
- 收入
- 利润率
- 研究与开发
- 产品系列比较
- 产品线的广度
- 科技
- 创新
- 地理位置比较
- 全球扩张分析
- 服务网路覆盖
- 按地区分類的市场渗透率
- 竞争定位矩阵
- 领导企业
- 受让人
- 追踪者
- 小众玩家
- 战略展望矩阵
- 财务绩效比较
- 2022-2025 年重大发展
- 併购
- 伙伴关係与合作
- 技术进步
- 扩张和投资策略
- 永续发展倡议
- 数位转型计划
- 新兴/Start-Ups竞争对手的发展趋势
第五章:颗粒物监测市场估计与预测:依监测技术划分,2022-2035年
- ,
- 硬体
- 重量检测法
- β衰减监测器(BAM)
- 锥形元件振动微天平(TEOM)
- 光学粒子计数器(OPC)/雷射散射法
- 专业/参考级 OPC
- 低成本光学感测器
- 浊度计
第六章 市场估计与预测:依粒状物粒径划分,2022-2035年
- PM2.5(2.5微米或更小)
- PM10(小于10微米)
- PM1(小于1微米)
第七章 市场估算与预测:依产品类型分類的市场规模,2022-2035年
- 室外环境监测系统
- 固定式环境监测站
- 携带式/移动式户外显示器
- 围篱线/边界线监测器
- 移动平台安装式感应器
- 室内环境监测系统
- 适用于一般建筑物的室内空气品质监测器
- 洁净室和受控环境用粒子计数器
- 工业室内显示器
- 暖通空调整合监控系统
- 个人暴露监测器
第八章 市场估计与预测:依应用领域划分,2022-2035年
- 监管合规性和空气品质监测
- 职业健康与职场安全
- 工业製程和排放监测
- 建筑物和设施的室内空气品质管理
- 个体接触评估和流行病学调查
- 其他的
第九章 市场估计与预测:依最终用户产业划分,2022-2035年
- 政府和监管机构
- 发电
- 化学/石油化学製造
- 金属和采矿
- 医学与生命科学
- 半导体和电子设备製造
- 农业/食品加工
- 其他的
第十章:颗粒物监测市场估计与预测:按地区划分,2022-2035年
- 按地区
- 北美洲
- 我们
- 加拿大
- 欧洲
- 英国
- 德国
- 法国
- 义大利
- 西班牙
- 荷兰
- 其他欧洲地区
- 亚太地区
- 中国
- 印度
- 日本
- 韩国
- 澳洲
- 亚太其他地区
- 拉丁美洲
- 巴西
- 墨西哥
- 阿根廷
- 其他拉丁美洲地区
- 中东和非洲
- 沙乌地阿拉伯
- 南非
- 阿拉伯聯合大公国
- 其他中东和非洲地区
第十一章:公司简介
- 3M Company
- ACOEM Group
- Aeroqual Group Limited
- AMETEK, Inc.
- Beckman Coulter, Inc.
- Ecotech Pty Ltd
- Enviro Technology Services plc
- GrayWolf Sensing Solutions
- Honeywell International Inc.
- Horiba Ltd.
- Kanomax USA, Inc.
- Met One Instruments, Inc.
- Opsis AB
- Palas GmbH
- PCE Instruments
- Rupprecht &Patashnick Co., Inc.(R&P)
- Siemens AG
- terra
- Thermo Fisher Scientific, Inc.
- TSI Incorporated
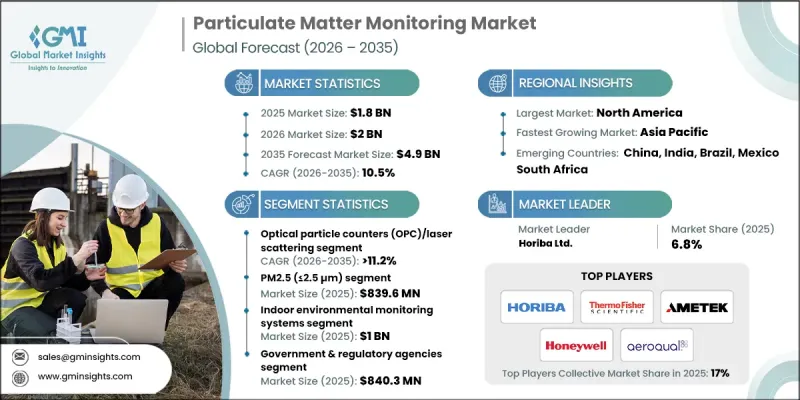
The Global Particulate Matter Monitoring Market was valued at USD 1.8 billion in 2025 and is estimated to grow at a CAGR of 10.5% to reach USD 4.9 billion by 2035.
The market focuses on detecting suspended solid particles and liquid droplets in the air, including dust, soot, and smoke, with particular attention to PM2.5 and PM10 levels to assess air quality. Advanced monitoring solutions, including high-precision reference stations, portable AI-enabled sensors with real-time connectivity, and IoT-based devices, are increasingly deployed in indoor and outdoor environments. These systems are critical for public health risk evaluation, regulatory compliance, and pollution management initiatives. Rising global urbanization, industrialization, and stricter air quality regulations are fueling demand for accurate PM monitoring. Governments and environmental agencies are investing heavily in monitoring infrastructure and analytics platforms to provide reliable data for policymaking, urban planning, and public health protection. The combination of technological advancements and regulatory pressure is driving faster adoption of PM monitoring systems worldwide.
| Market Scope | |
|---|---|
| Start Year | 2025 |
| Forecast Year | 2026-2035 |
| Start Value | $1.8 Billion |
| Forecast Value | $4.9 Billion |
| CAGR | 10.5% |
The optical particle counter (OPC)/laser scattering segment is projected to grow at 11.2% CAGR through 2035 and currently dominates the market. Its prominence stems from its high measurement accuracy, real-time monitoring capability, and ability to detect a wide range of particle sizes. These systems are extensively used to track ambient air quality, emissions, and ensure regulatory compliance. The ongoing advancement of laser scattering and OPC technology is creating new opportunities by enhancing sensor sensitivity, improving calibration stability, and enabling more comprehensive data analysis from fewer devices. Manufacturers are focusing on these improvements to meet the rising demand for precise and efficient monitoring solutions in industrial, urban, and indoor applications.
The PM2.5 (<=2.5 µm) segment accounted for USD 839.6 million in 2025 and holds the largest share of the particulate matter monitoring market. This dominance is driven by the strong link between PM2.5 exposure and health risks such as respiratory and cardiovascular diseases. Increasing awareness, public health initiatives, and the use of PM2.5 data in urban planning and pollution reduction programs are fueling demand for monitoring systems. Manufacturers are prioritizing the development of compact, low-maintenance PM2.5 devices, with integration into digital air quality networks to support regulatory compliance and broaden adoption across industrial, urban, and indoor environments.
U.S. Particulate Matter Monitoring Market reached USD 719.3 million in 2025. The region continues to lead the industry due to heightened focus on public health, urban air pollution mitigation, and smart city programs. Strong federal investments in air quality infrastructure, stringent environmental regulations, and the presence of major industry players contribute to North America's dominant market position. Manufacturers in the U.S. are emphasizing scalable, accurate, and actionable PM monitoring solutions, leveraging technological innovations, partnerships with governmental organizations, and cloud-based analytics to improve monitoring efficiency and system interoperability.
Key players operating in the Global Particulate Matter Monitoring Market include Enviro Technology Services plc, ACOEM Group, Met One Instruments, Inc., 3M Company, GrayWolf Sensing Solutions, Thermo Fisher Scientific, Inc., Aeroqual Group Limited, Siemens AG, Beckman Coulter, Inc., Rupprecht & Patashnick Co., Inc. (R&P), Palas GmbH, TSI Incorporated, Opsis AB, Kanomax USA, Inc., PCE Instruments, Horiba Ltd., AMETEK, Inc., Honeywell International Inc., Ecotech Pty Ltd, and Terra. Companies in the particulate matter monitoring market are pursuing several strategies to strengthen their market presence. They are investing heavily in R&D to enhance sensor sensitivity, reduce maintenance requirements, and integrate AI and IoT capabilities. Strategic partnerships with governments, municipalities, and environmental agencies help secure long-term contracts and support infrastructure expansion. Firms are also focusing on product diversification, offering solutions for urban, industrial, and indoor monitoring.
Table of Contents
Chapter 1 Methodology and Scope
- 1.1 Market scope and definition
- 1.2 Research design
- 1.2.1 Research approach
- 1.2.2 Data collection methods
- 1.3 Data mining sources
- 1.3.1 Global
- 1.3.2 Regional/Country
- 1.4 Base estimates and calculations
- 1.4.1 Base year calculation
- 1.4.2 Key trends for market estimation
- 1.5 Primary research and validation
- 1.5.1 Primary sources
- 1.6 Forecast model
- 1.7 Research assumptions and limitations
Chapter 2 Executive Summary
- 2.1 Industry snapshot
- 2.2 Key market trends
- 2.2.1 Monitoring Technology trends
- 2.2.2 Particulate Matter Size trends
- 2.2.3 Product Type trends
- 2.2.4 Application trends
- 2.2.5 End-User Industry trends
- 2.2.6 Regional trends
- 2.3 TAM Analysis, 2026-2035 (USD Billion)
- 2.4 CXO perspectives: Strategic imperatives
- 2.4.1 Executive decision points
- 2.4.2 critical success factors
- 2.5 Future outlook and strategic recommendations
Chapter 3 Industry Insights
- 3.1 Industry ecosystem analysis
- 3.1.1 Supplier Landscape
- 3.1.2 Profit Margin
- 3.1.3 Cost structure
- 3.1.4 Value addition at each stage
- 3.1.5 Factor affecting the value chain
- 3.1.6 Disruptions
- 3.2 Industry impact forces
- 3.2.1 Growth drivers
- 3.2.1.1 Increasing government laws and standards for monitoring air quality
- 3.2.1.2 Monitoring of ambient air quality is becoming more important
- 3.2.1.3 Rising demand of particulate matter levels in automotive and transportation sectors
- 3.2.1.4 Increasing awareness about the health risks associated of particulate matter
- 3.2.1.5 Ongoing advancements in PM monitoring systems
- 3.2.2 Industry pitfalls and challenges
- 3.2.2.1 Installing and maintaining PM monitoring devices can be difficult
- 3.2.2.2 Delays in underdeveloped nations in implementing PM monitoring solutions
- 3.2.3 Market opportunities
- 3.2.3.1 Expansion of smart cities and digital environmental infrastructure
- 3.2.3.2 Growing demand for indoor air quality monitoring
- 3.2.1 Growth drivers
- 3.3 Growth potential analysis
- 3.4 Regulatory landscape
- 3.4.1 North America
- 3.4.2 Europe
- 3.4.3 Asia Pacific
- 3.4.4 Latin America
- 3.4.5 Middle East & Africa
- 3.5 Porter’s analysis
- 3.6 PESTEL analysis
- 3.7 Technology and innovation landscape
- 3.7.1 Current technological trends
- 3.7.2 Emerging technologies
- 3.8 Price trends
- 3.8.1 Historical price analysis (2022-2024)
- 3.8.2 Price trend drivers
- 3.8.3 Regional price variations
- 3.8.4 Price forecast (2026-2035)
- 3.9 Pricing strategies
- 3.10 Emerging business models
- 3.11 Compliance requirements
Chapter 4 Competitive Landscape, 2025
- 4.1 Introduction
- 4.2 Company market share analysis
- 4.2.1 By Region
- 4.2.1.1 North America
- 4.2.1.2 Europe
- 4.2.1.3 Asia Pacific
- 4.2.1.4 Latin America
- 4.2.1.5 Middle East & Africa
- 4.2.2 Market Concentration Analysis
- 4.2.1 By Region
- 4.3 Competitive benchmarking of key players
- 4.3.1 Financial performance comparison
- 4.3.1.1 Revenue
- 4.3.1.2 Profit margin
- 4.3.1.3 R&D
- 4.3.2 Product portfolio comparison
- 4.3.2.1 Product range breadth
- 4.3.2.2 Technology
- 4.3.2.3 Innovation
- 4.3.3 Geographic presence comparison
- 4.3.3.1 Global footprint analysis
- 4.3.3.2 Service network coverage
- 4.3.3.3 Market penetration by region
- 4.3.4 Competitive positioning matrix
- 4.3.4.1 Leaders
- 4.3.4.2 Challengers
- 4.3.4.3 Followers
- 4.3.4.4 Niche players
- 4.3.5 Strategic outlook matrix
- 4.3.1 Financial performance comparison
- 4.4 Key developments, 2022-2025
- 4.4.1 Mergers and acquisitions
- 4.4.2 Partnerships and collaborations
- 4.4.3 Technological advancements
- 4.4.4 Expansion and investment strategies
- 4.4.5 Sustainability initiatives
- 4.4.6 Digital transformation initiatives
- 4.5 Emerging/ startup competitors landscape
Chapter 5 Particulate Matter Monitoring Market Estimates & Forecast, By Monitoring Technology, 2022 - 2035 (USD Billion)
- 5.1 Key trends,
- 5.2 Hardware
- 5.3 Gravimetric Methods
- 5.4 Beta Attenuation Monitors (BAM)
- 5.5 Tapered Element Oscillating Microbalance (TEOM)
- 5.6 Optical Particle Counters (OPC)/Laser Scattering
- 5.6.1 Professional/Reference-Grade OPC
- 5.6.2 Low-Cost Optical Sensors
- 5.6.3 Nephelometer
Chapter 6 Market Estimates and Forecast, By Particulate Matter Size, 2022 - 2035 (USD Billion)
- 6.1 Key trends
- 6.2 PM2.5 (≤ 2.5 µm)
- 6.3 PM10 (≤10 µm)
- 6.4 PM1 (≤ 1 µm)
Chapter 7 Market Estimates and Forecast, By Product Type Size, 2022 - 2035 (USD Billion)
- 7.1 Key trends
- 7.2 Outdoor Ambient Monitoring Systems
- 7.2.1 Fixed Ambient Monitoring Stations
- 7.2.2 Portable/Mobile Outdoor Monitors
- 7.2.3 Fence-line/Perimeter Monitors
- 7.2.4 Mobile Platform-Mounted Sensors
- 7.3 Indoor Environmental Monitoring Systems
- 7.3.1 General Building IAQ Monitors
- 7.3.2 Cleanroom & Controlled Environment Particle Counters
- 7.3.3 Industrial Indoor Monitors
- 7.3.4 HVAC-Integrated Monitoring Systems
- 7.3.5 Personal Wearable Exposure Monitors
Chapter 8 Market Estimates and Forecast, By Application, 2022 - 2035 (USD Billion)
- 8.1 Key trends
- 8.2 Regulatory Compliance & Ambient Air Quality Monitoring
- 8.3 Occupational Health & Workplace Safety
- 8.4 Industrial Process & Emission Monitoring
- 8.5 Building & Facility Indoor Air Quality Management
- 8.6 Personal Exposure Assessment & Epidemiological Research
- 8.7 Others
Chapter 9 Market Estimates and Forecast, By End-User Industry, 2022 - 2035 (USD Billion)
- 9.1 Key trends
- 9.2 Government & Regulatory Agencies
- 9.3 Power Generation
- 9.4 Chemical & Petrochemical Manufacturing
- 9.5 Metals & Mining
- 9.6 Healthcare & Life Sciences
- 9.7 Semiconductor & Electronics Manufacturing
- 9.8 Agriculture & Food Processing
- 9.9 Others
Chapter 10 Particulate Matter Monitoring Market Estimates & Forecast, By Region, 2022 - 2035 (USD Billion)
- 10.1 Key trends, by region
- 10.2 North America
- 10.2.1 U.S.
- 10.2.2 Canada
- 10.3 Europe
- 10.3.1 UK
- 10.3.2 Germany
- 10.3.3 France
- 10.3.4 Italy
- 10.3.5 Spain
- 10.3.6 Netherlands
- 10.3.7 Rest of Europe
- 10.4 Asia-Pacific
- 10.4.1 China
- 10.4.2 India
- 10.4.3 Japan
- 10.4.4 South Korea
- 10.4.5 Australia
- 10.4.6 Rest of Asia-Pacific
- 10.5 Latin America
- 10.5.1 Brazil
- 10.5.2 Mexico
- 10.5.3 Argentina
- 10.5.4 Rest of Latin America
- 10.6 MEA
- 10.6.1 Saudi Arabia
- 10.6.2 South Africa
- 10.6.3 UAE
- 10.6.4 Rest of MEA
Chapter 11 Company Profiles
- 11.1 3M Company
- 11.2 ACOEM Group
- 11.3 Aeroqual Group Limited
- 11.4 AMETEK, Inc.
- 11.5 Beckman Coulter, Inc.
- 11.6 Ecotech Pty Ltd
- 11.7 Enviro Technology Services plc
- 11.8 GrayWolf Sensing Solutions
- 11.9 Honeywell International Inc.
- 11.10 Horiba Ltd.
- 11.11 Kanomax USA, Inc.
- 11.12 Met One Instruments, Inc.
- 11.13 Opsis AB
- 11.14 Palas GmbH
- 11.15 PCE Instruments
- 11.16 Rupprecht & Patashnick Co., Inc. (R&P)
- 11.17 Siemens AG
- 11.18 terra
- 11.19 Thermo Fisher Scientific, Inc.
- 11.20 TSI Incorporated


