


 |
市场调查报告书
商品编码
1959628
离岸风力发电市场机会、成长要素、产业趋势分析及2026年至2035年预测Offshore Wind Energy Market Opportunity, Growth Drivers, Industry Trend Analysis, and Forecast 2026 - 2035 |
||||||
2025年全球离岸风力发电市场价值为769亿美元,预计2035年将达到3075亿美元,年复合成长率为12.2%。
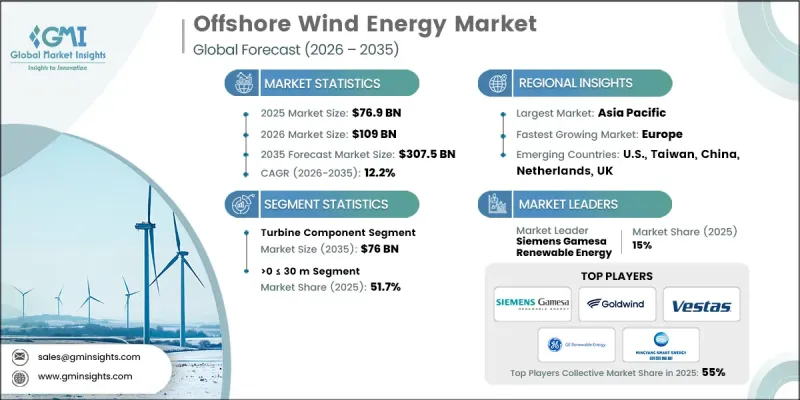
在电力需求不断增长和减少碳排放受到重视的推动下,世界各国政府正在推行扶持政策和法规结构,以促进离岸风力发电投资。上网电价补贴、特定技术的部署目标以及竞争性竞标流程等机制正惠及整个产业。包括先进船舶、电网连接和更有效率的安装方法在内的整个供应链的改进,正在缩短计划工期并降低成本。导管架和单桩结构等基础技术的创新,使得在更深、更具挑战性的海洋环境中开展计划成为可能。上网电价补贴(FIT)和差价合约(CfD)等政策提供了可预测的收入来源,提高了开发商的财务稳定性。此外,绿色债券、长期购电协议(PPA)以及对海上输电基础设施的投资正在加速全球市场成长。
| 市场范围 | |
|---|---|
| 开始年份 | 2025 |
| 预测年份 | 2026-2035 |
| 起始值 | 769亿美元 |
| 预测金额 | 3075亿美元 |
| 复合年增长率 | 12.2% |
预计到2035年,风力涡轮机市场规模将达到760亿美元,主要得益于更大、更有效率的涡轮机能够降低每兆瓦时电力的成本。更长的叶片和更高的塔筒将有助于利用更强、更稳定的风力,从而提高能源回收回收率。领先的涡轮机製造商包括维斯塔斯(Vestas)、西门子歌美飒再生能源公司(Siemens Gamesa Renewable Energy)和通用电气再生能源公司(GE Renewable Energy),而中国的金风科技(Goldwind)和民阳科技(Minyang)也迅速扩大市场份额。
预计到2035年,水深超过50公尺的离岸风计划将以28.5%的复合年增长率成长,这主要得益于浮体式涡轮机技术的发展,例如立柱式浮标、半潜式平台和张力脚平臺。日本的《专属经济海域法》和韩国的《离岸风力发电法》等扶持政策正加速深海域浮体式海上风电的推广应用。
2025年,美国离岸风力发电市场规模预计为31亿美元,预计在2026年至2035年间以8.5%的复合年增长率成长。在技术进步、有利政策和环保倡议的推动下,北美地区到2025年将占据4%的市场。纽约州、新泽西州、麻萨诸塞州、康乃狄克州、罗德岛州、马里兰州、维吉尼亚和北卡罗来纳州等州已製定了雄心勃勃的离岸风电发展目标。对涡轮机、叶片、塔筒、基础和电缆製造设施的投资,以及在东海岸、墨西哥湾沿岸和西海岸建设的专用离岸风电港口,正在推动市场进一步扩张。
目录
第一章:调查方法和范围
第二章执行摘要
第三章业界考察
- 产业生态系统
- 原物料供应及采购分析
- 製造能力评估
- 供应链韧性与风险因素
- 配电网路分析
- 监管环境
- 影响产业的因素
- 促进因素
- 产业潜在风险与挑战
- 成长潜力分析
- 价格趋势分析
- 按深度
- 按地区
- 成本结构分析
- 波特五力分析
- PESTEL 分析
- 新机会与趋势
- 数位化和物联网集成
- 进入新兴市场
- 投资分析及未来展望
第四章 竞争情势
- 介绍
- 企业市占率分析
- 北美洲
- 欧洲
- 亚太地区
- 世界其他地区
- 战略仪錶板
- 策略倡议
- 创新与科技趋势
第五章 市场规模及预测:依组件划分,2022-2035年
- 涡轮
- 等级
- ≤ 2 兆瓦
- 2 至 5 兆瓦
- >5<=8兆瓦
- >8<=10兆瓦
- >10<=12 MW
- 大于12兆瓦
- 安装
- 浮体式
- 轴
- 水平的
- 上风侧
- 顺风
- 垂直的
- 水平的
- 成分
- 刀刃
- 塔
- 其他的
- 轴
- 固定的
- 轴
- 水平的
- 上风侧
- 顺风
- 垂直的
- 水平的
- 成分
- 刀刃
- 塔
- 其他的
- 轴
- 浮体式
- 等级
- 支持结构
- 下部结构(钢结构)
- 基础
- 单桩
- 夹克
- 其他的
- 电力基础设施
- 电线电缆
- 变电站
- 其他的
- 其他的
第六章 市场规模及预测:依深度划分,2022-2035年
- 0-30米或更短
- 超过30米但不足50米
- 超过50米
第七章 市场规模及预测:依地区划分,2022-2035年
- 北美洲
- 我们
- 加拿大
- 欧洲
- 德国
- 西班牙
- 英国
- 法国
- 义大利
- 瑞典
- 波兰
- 丹麦
- 葡萄牙
- 荷兰
- 爱尔兰
- 比利时
- 亚太地区
- 中国
- 印度
- 澳洲
- 日本
- 韩国
- 越南
- 菲律宾
- 台湾
- 世界其他地区
第八章:公司简介
- China Longyuan Power Group
- Enessere
- Equinor ASA
- Furukawa Electric
- General Electric
- Global Energy(Group)Limited
- Goldwind
- IMPSA
- LS Cable &System
- Nexans
- Nordex SE
- Ørsted A/S
- Prysmian Group
- RWE Renewables
- Siemens Gamesa Renewable Energy
- Sumitomo Electric Industries
- Southwire Company
- Suzlon Energy Limited
- Vestas
- WEG
The Global Offshore Wind Energy Market was valued at USD 76.9 billion in 2025 and is estimated to grow at a CAGR of 12.2% to reach USD 307.5 billion by 2035.
Rising electricity demand, coupled with increased focus on reducing carbon emissions, has encouraged governments to implement supportive policies and regulatory frameworks, driving investments in offshore wind. The industry benefits from mechanisms such as fixed tariffs, technology-specific deployment targets, and competitive auction processes. Improvements across the supply chain, including advanced vessels, grid integration, and streamlined installation methods, are reducing project timelines and lowering costs. Innovations in foundation technologies, such as jacket and monopile structures, enable projects in deeper and more challenging marine environments. Policies like Feed-in Tariffs (FiTs) and Contracts for Difference (CfD) provide predictable revenue streams, enhancing financial security for developers. Additionally, green bonds, long-term Power Purchase Agreements (PPAs), and investment in offshore transmission infrastructure are accelerating market growth globally.
| Market Scope | |
|---|---|
| Start Year | 2025 |
| Forecast Year | 2026-2035 |
| Start Value | $76.9 Billion |
| Forecast Value | $307.5 Billion |
| CAGR | 12.2% |
The turbine segment is expected to reach USD 76 billion by 2035 as larger, more efficient turbines reduce the cost per MWh of electricity. Extended blade lengths and taller towers allow access to stronger, consistent winds, improving energy capture. Leading turbine manufacturers include Vestas, Siemens Gamesa Renewable Energy, and GE Renewable Energy, with Chinese players Goldwind and MingYang rapidly expanding their market presence.
The projects in water depths exceeding 50 meters are anticipated to grow at a CAGR of 28.5% through 2035, driven by floating turbine technologies such as spar-buoy, semi-submersible, and tension-leg platforms. Supportive policies like Japan's EEZ Bill and South Korea's OSS Bill are accelerating deepwater floating wind deployment.
U.S. Offshore Wind Energy Market was valued at USD 3.1 billion in 2025 and is forecasted to grow at a CAGR of 8.5% between 2026 and 2035. North America held a 4% market share in 2025, supported by technological advancements, favorable policies, and environmental initiatives. States including New York, New Jersey, Massachusetts, Connecticut, Rhode Island, Maryland, Virginia, and North Carolina are setting ambitious offshore wind targets. Investments in turbines, blade, tower, foundation, and cable manufacturing facilities, along with dedicated offshore wind ports on the East, Gulf, and West Coasts, are further driving market expansion.
Key players in the Global Offshore Wind Energy Market include Orsted A/S, Siemens Gamesa Renewable Energy, Vestas, GE Renewable Energy, Goldwind, China Longyuan Power Group, Enessere, Equinor ASA, Furukawa Electric, Global Energy (Group) Limited, IMPSA, LS Cable & System, Nexans, Nordex SE, Prysmian Group, RWE Renewables, Sumitomo Electric Industries, Southwire Company, Suzlon Energy Limited, and WEG. Key strategies adopted by companies in the offshore wind energy market include expanding global manufacturing and supply chain capabilities to reduce lead times, investing in R&D for larger and more efficient turbines, and deploying advanced floating foundation technologies to access deeper waters. Companies are also securing long-term Power Purchase Agreements (PPAs) to ensure steady revenue streams and participate in government-led competitive auctions to gain high-value contracts. Strategic partnerships with port operators, shipping companies, and local suppliers help optimize logistics and installation processes. Additionally, players are focusing on sustainability certifications and eco-friendly designs to strengthen brand credibility and align with regulatory requirements, enhancing their competitive positioning in the global offshore wind energy market.
Table of Contents
Chapter 1 Methodology & Scope
- 1.1 Research design
- 1.1.1 Research approach
- 1.1.2 Data collection methods
- 1.2 Base estimates and calculations
- 1.2.1 Base year calculation
- 1.2.2 Key trends for market estimates
- 1.3 Forecast model
- 1.3.1 Key trends for market estimates
- 1.3.1.1 Quantified market impact analysis
- 1.3.1.2 Mathematical impact of growth parameters on forecast
- 1.3.2 Scenario analysis framework
- 1.3.1 Key trends for market estimates
- 1.4 Primary research and validation
- 1.4.1 Some of the primary sources (but not limited to)
- 1.5 Data mining sources
- 1.5.1 Paid Sources
- 1.5.2 Sources, by region
- 1.6 Research trail & scoring components
- 1.6.1 Research trail components
- 1.6.2 Scoring components
- 1.7 Research transparency addendum
- 1.7.1 Source attribution framework
- 1.7.2 Quality assurance metrics
- 1.7.3 Our commitment to trust
- 1.8 Market definitions
Chapter 2 Executive Summary
- 2.1 Industry 360-degree synopsis, 2022 - 2035
- 2.2 Business trends
- 2.3 Component trends
- 2.4 Depth trends
- 2.5 Regional trends
Chapter 3 Industry Insights
- 3.1 Industry ecosystem
- 3.1.1 Raw material availability & sourcing analysis
- 3.1.2 Manufacturing capacity assessment
- 3.1.3 Supply chain resilience & risk factors
- 3.1.4 Distribution network analysis
- 3.2 Regulatory landscape
- 3.3 Industry impact forces
- 3.3.1 Growth drivers
- 3.3.2 Industry pitfalls & challenges
- 3.4 Growth potential analysis
- 3.5 Price trend analysis
- 3.5.1 By depth
- 3.5.2 By region
- 3.6 Cost structure analysis
- 3.7 Porter's analysis
- 3.7.1 Bargaining power of suppliers
- 3.7.2 Bargaining power of buyers
- 3.7.3 Threat of new entrants
- 3.7.4 Threat of substitutes
- 3.8 PESTEL analysis
- 3.8.1 Political factors
- 3.8.2 Economic factors
- 3.8.3 Social factors
- 3.8.4 Technological factors
- 3.8.5 Legal factors
- 3.8.6 Environmental factors
- 3.9 Emerging opportunities & trends
- 3.9.1 Digitalization & IoT integration
- 3.9.2 Emerging market penetration
- 3.10 Investment analysis and future outlook
Chapter 4 Competitive landscape, 2026
- 4.1 Introduction
- 4.2 Company market share analysis, 2025
- 4.2.1 North America
- 4.2.2 Europe
- 4.2.3 Asia Pacific
- 4.2.4 Rest of World
- 4.3 Strategic dashboard
- 4.4 Strategic initiatives
- 4.5 Innovation & technology landscape
Chapter 5 Market Size and Forecast, By Component, 2022 - 2035 (USD Billion & MW)
- 5.1 Key trends
- 5.2 Turbine
- 5.2.1 Rating
- 5.2.1.1 ≤ 2 MW
- 5.2.1.2 >2≤ 5 MW
- 5.2.1.3 >5≤ 8 MW
- 5.2.1.4 >8≤10 MW
- 5.2.1.5 >10≤ 12 MW
- 5.2.1.6 > 12 MW
- 5.2.2 Installation
- 5.2.2.1 Floating
- 5.2.2.1.1 Axis
- 5.2.2.1.1.1 Horizontal
- 5.2.2.1.1.1.1 Up wind
- 5.2.2.1.1.1.2 Down wind
- 5.2.2.1.1.2 Vertical
- 5.2.2.1.1.1 Horizontal
- 5.2.2.1.2 Component
- 5.2.2.1.2.1 Blade
- 5.2.2.1.2.2 Towers
- 5.2.2.1.2.3 Others
- 5.2.2.1.1 Axis
- 5.2.2.2 Fixed
- 5.2.2.2.1 Axis
- 5.2.2.2.1.1 Horizontal
- 5.2.2.2.1.1.1 Up wind
- 5.2.2.2.1.1.2 Down wind
- 5.2.2.2.1.2 Vertical
- 5.2.2.2.1.1 Horizontal
- 5.2.2.2.2 Component
- 5.2.2.2.2.1 Blade
- 5.2.2.2.2.2 Towers
- 5.2.2.2.2.3 Others
- 5.2.2.2.1 Axis
- 5.2.2.1 Floating
- 5.2.1 Rating
- 5.3 Support structure
- 5.3.1 Substructure (Steel)
- 5.3.2 Foundation
- 5.3.2.1 Monopile
- 5.3.2.2 Jacket
- 5.3.3 Others
- 5.4 Electrical Infrastructure
- 5.4.1 Wires & Cables
- 5.4.2 Substation
- 5.4.3 Others
- 5.5 Others
Chapter 6 Market Size and Forecast, By Depth, 2022 - 2035 (USD Billion & MW)
- 6.1 Key trends
- 6.2 > 0 to ≤ 30 m
- 6.3 > 30 to ≤ 50 m
- 6.4 > 50 m
Chapter 7 Market Size and Forecast, By Region, 2022 - 2035 (USD Billion & MW)
- 7.1 Key trends
- 7.2 North America
- 7.2.1 U.S.
- 7.2.2 Canada
- 7.3 Europe
- 7.3.1 Germany
- 7.3.2 Spain
- 7.3.3 UK
- 7.3.4 France
- 7.3.5 Italy
- 7.3.6 Sweden
- 7.3.7 Poland
- 7.3.8 Denmark
- 7.3.9 Portugal
- 7.3.10 Netherlands
- 7.3.11 Ireland
- 7.3.12 Belgium
- 7.4 Asia Pacific
- 7.4.1 China
- 7.4.2 India
- 7.4.3 Australia
- 7.4.4 Japan
- 7.4.5 South Korea
- 7.4.6 Vietnam
- 7.4.7 Philippines
- 7.4.8 Taiwan
- 7.5 Rest of World
Chapter 8 Company Profiles
- 8.1 China Longyuan Power Group
- 8.2 Enessere
- 8.3 Equinor ASA
- 8.4 Furukawa Electric
- 8.5 General Electric
- 8.6 Global Energy (Group) Limited
- 8.7 Goldwind
- 8.8 IMPSA
- 8.9 LS Cable & System
- 8.10 Nexans
- 8.11 Nordex SE
- 8.12 Ørsted A/S
- 8.13 Prysmian Group
- 8.14 RWE Renewables
- 8.15 Siemens Gamesa Renewable Energy
- 8.16 Sumitomo Electric Industries
- 8.17 Southwire Company
- 8.18 Suzlon Energy Limited
- 8.19 Vestas
- 8.20 WEG
 离岸风力发电市场:按组件、基础类型、涡轮机功率、应用和最终用户划分-2026-2032年全球市场预测
 2026年全球离岸风电市场报告
 离岸风力发电市场报告:按组件、基础类型、容量、位置和地区划分(2026-2034 年)离岸风力发电单桩市场依结构类型、水深等级、风扇容量等级及最终用户划分,2026-2032年预测
 近期技术发展及电力製X路径的技术经济评估离岸风力发电贯入试验市场规模、份额、成长及全球产业分析:按类型、应用和地区划分,预测2026-2034年
 全球离岸风电电气基础设施市场:预测(至2034年)-按组件、电缆、输电技术、安装方式、併网/整合、安装/试运行服务和区域进行分析日本离岸风力发电市场规模、份额、趋势及预测(按安装方式、水深、容量和地区划分,2026-2034年)日本离岸风力发电市场规模、份额、趋势和预测:按组件、基础类型、容量、水域面积和地区划分,2026-2034年2026年全球自主式海上平台清洁机器人市场报告