


 |
市场调查报告书
商品编码
1959634
风力发电机变桨及偏航驱动装置市场机会、成长要素、产业趋势分析及2026年至2035年预测Wind Turbine Pitch and Yaw Drive Market Opportunity, Growth Drivers, Industry Trend Analysis, and Forecast 2026 - 2035 |
||||||
2025 年全球风力发电机变桨偏航驱动装置市场价值为 71 亿美元,预计到 2035 年将达到 123 亿美元,年复合成长率为 5.5%。
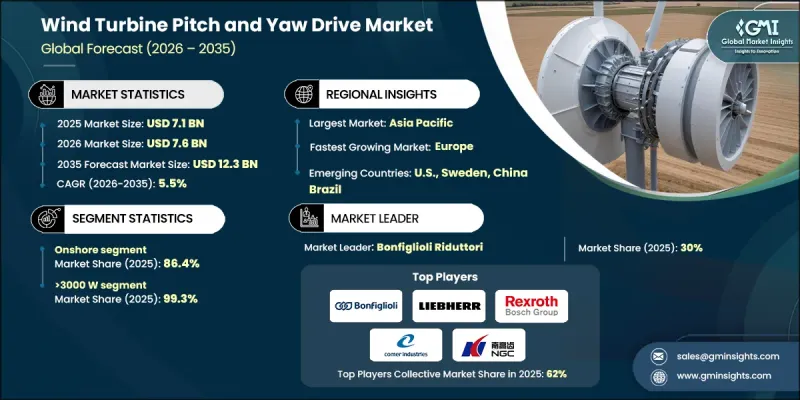
这一市场前景与这些系统在风力发电机的性能和安全方面发挥的关键作用密切相关。变桨驱动系统用于根据风速变化调整叶片角度,使涡轮机能够高效运作,同时防止过大的机械载荷,并在必要时实现受控停机。偏航驱动系统确保涡轮机保持相对于风流的正确方向,从而支持稳定的能量输出并减少结构疲劳。全球对可再生能源普及和排放目标的日益重视,持续增强了市场发展动能。风能仍然是最具成本效益的可再生能源解决方案之一,涡轮机效率、耐久性和自动化水平的不断提高,进一步巩固了其长期应用前景。材料、控制技术和製造精度的进步,正在进一步提高系统的可靠性和成本效益,从而推动全球对风力发电设施的持续需求。
| 市场范围 | |
|---|---|
| 开始年份 | 2025 |
| 预测年份 | 2026-2035 |
| 起始值 | 71亿美元 |
| 预测金额 | 123亿美元 |
| 复合年增长率 | 5.5% |
预计到2025年,陆上安装市场将占全球市场份额的86.4%,并在2026年至2035年间以4.5%的复合年增长率成长。这一主导地位得益于低廉的安装和维护成本、成熟的供应链网路以及可扩展的生产能力。叶片长度和塔筒高度不断增加的大型风力发电机组的持续发展,提高了能源捕获效率,同时,市场对能够承受高负载并确保长使用寿命的坚固耐用的俯仰-偏航系统的需求也日益增长。
预计到2035年,1000瓦至3000瓦容量段的复合年增长率将达到9%。这一成长主要受以下因素驱动:老旧风力发电机系统的更新换代、对电网和安装空间受限地区的适应性提升,以及发展中市场对该类产品的日益青睐。此类系统通常采用主动式俯仰偏航机构,并依赖成熟的技术平台和可靠的供应链,从而实现经济高效的部署。
预计到2025年,北美风力发电机变桨偏航驱动装置市场的份额将达到14.8%。该地区市场受益于持续的技术研发和创新,这些研发和创新旨在提高涡轮机效率并扩大部署范围。加拿大虽然在该地区规模较小,但其市场份额正在稳步增长。
目录
第一章:调查方法和范围
第二章执行摘要
第三章业界考察
- 产业生态系统
- 原物料供应及采购分析
- 製造能力评估
- 供应链韧性与风险因素
- 配电网路分析
- 监管环境
- 影响产业的因素
- 促进因素
- 产业潜在风险与挑战
- 成长潜力分析
- 价格趋势分析
- 按类型
- 按地区
- 成本结构分析
- 波特五力分析
- PESTEL 分析
- 新兴机会和趋势
- 数位化和物联网集成
- 进入新兴市场
- 投资分析及未来展望
第四章 竞争情势
- 介绍
- 企业市占率分析
- 北美洲
- 欧洲
- 亚太地区
- 中东和非洲
- 拉丁美洲
- 战略仪錶板
- 策略倡议
- 创新与科技趋势
第五章 市场规模及预测:依最终用途划分,2022-2035年
- 陆上
- 离岸
第六章 市场规模及预测:依类型划分,2022-2035年
- 小于1000瓦
- 1000 W~3000 W
- 超过3000瓦
第七章 市场规模及预测:依音调系统划分,2022-2035年
- 电的
- 机械的
- 油压
第八章 市场规模及预测:依叶片长度划分,2022-2035年
- 小型
- 中号
- 大的
第九章 市场规模及预测:依地区划分,2022-2035年
- 北美洲
- 我们
- 加拿大
- 墨西哥
- 欧洲
- 德国
- 西班牙
- 英国
- 法国
- 义大利
- 瑞典
- 波兰
- 丹麦
- 葡萄牙
- 荷兰
- 爱尔兰
- 比利时
- 亚太地区
- 中国
- 印度
- 澳洲
- 日本
- 韩国
- 越南
- 泰国
- 菲律宾
- 台湾
- 中东和非洲
- 南非
- 埃及
- 拉丁美洲
- 巴西
- 智利
- 阿根廷
第十章:公司简介
- ABB
- ABM Greiffenberger
- Bosch Rexroth AG
- Bonfiglioli SpA
- Comer Industries
- Dana SAC UK
- General Electric
- Goldwind Science and Technologies
- KEBA
- Liebherr
- Mitsubishi Heavy Industries
- Nabtesco Corporation
- Nanjing High Speed Gear Manufacturing
- Nidec Conversion
- Nordex
- SIPCO-MLS
- Siemens Gamesa Renewable Energy
- Schaeffler Group
- Vestas Wind Systems
- ZOLLERN GmbH
The Global Wind Turbine Pitch and Yaw Drive Market was valued at USD 7.1 billion in 2025 and is estimated to grow at a CAGR of 5.5% to reach USD 12.3 billion by 2035.
The market outlook is tied to the critical role these systems play in wind turbine performance and safety. Pitch drive systems are used to adjust blade angles in response to changing wind speeds, allowing turbines to operate efficiently while preventing excessive mechanical loads and enabling controlled shutdowns when required. Yaw drive systems ensure that turbines remain properly oriented toward wind flow, supporting consistent energy output and reducing structural fatigue. Growing global commitment to renewable energy adoption and emission reduction targets continues to reinforce market momentum. Wind power remains one of the most cost-effective renewable solutions, and ongoing improvements in turbine efficiency, durability, and automation are strengthening long-term deployment prospects. Advancements in materials, control technologies, and manufacturing precision are further improving system reliability and cost efficiency, driving sustained demand across global wind installations.
| Market Scope | |
|---|---|
| Start Year | 2025 |
| Forecast Year | 2026-2035 |
| Start Value | $7.1 Billion |
| Forecast Value | $12.3 Billion |
| CAGR | 5.5% |
The onshore installations segment accounted for 86.4% share in 2025 and is expected to grow at a CAGR of 4.5% from 2026 to 2035. This dominance is supported by lower installation and servicing expenses, established supply networks, and scalable production capabilities. Continued development of larger turbines with extended blade lengths and increased tower heights has improved energy capture, driving the need for robust pitch and yaw systems capable of handling higher loads and ensuring long operational lifespans.
The 1000 W to 3000 W capacity segment is projected to grow at a CAGR of 9% through 2035. Growth in this range is linked to the modernization of aging turbine fleets, suitability for regions with grid or space limitations, and increasing deployment across developing markets. Systems within this category commonly utilize active pitch and yaw mechanisms supported by mature technology platforms and proven supply chains, supporting cost-effective adoption.
North America Wind Turbine Pitch and Yaw Drive Market accounted for 14.8% share in 2025. The regional market benefits from ongoing technological research and innovation aimed at improving turbine efficiency and expanding deployment feasibility. Canada represents a smaller yet steadily expanding contributor within the regional landscape.
Key companies operating in the Global Wind Turbine Pitch and Yaw Drive Market include Siemens Gamesa Renewable Energy, Vestas Wind Systems, General Electric, ABB, Bosch Rexroth, Bonfiglioli, Schaeffler Group, Nordex, Nidec Conversion, Mitsubishi Heavy Industries, Liebherr, Goldwind Science and Technologies, ZOLLERN GmbH, Dana SAC UK, Nabtesco Corporation, KEBA, Comer Industries, ABM Greiffenberger, SIPCO-MLS, and Nanjing High Speed Gear Manufacturing. Companies in the wind turbine pitch and yaw drive market are strengthening their competitive positions through continuous innovation and system optimization. Many players are investing in advanced control technologies and durable materials to enhance performance and reduce lifecycle costs. Strategic partnerships with turbine manufacturers and energy developers are being used to secure long-term supply agreements. Firms are also expanding manufacturing footprints and local service capabilities to improve responsiveness and cost efficiency.
Table of Contents
Chapter 1 Methodology & Scope
- 1.1 Research design
- 1.1.1 Research approach
- 1.1.2 Data collection methods
- 1.2 Base estimates and calculations
- 1.2.1 Base year calculation
- 1.2.2 Key trends for market estimates
- 1.3 Forecast model
- 1.3.1 Key trends for market estimates
- 1.3.1.1 Quantified market impact analysis
- 1.3.1.2 Mathematical impact of growth parameters on forecast
- 1.3.2 Scenario analysis framework
- 1.3.1 Key trends for market estimates
- 1.4 Primary research and validation
- 1.4.1 Some of the primary sources (but not limited to)
- 1.5 Data mining sources
- 1.5.1 Paid Sources
- 1.5.2 Sources, by region
- 1.6 Research trail & scoring components
- 1.6.1 Research trail components
- 1.6.2 Scoring components
- 1.7 Research transparency addendum
- 1.7.1 Source attribution framework
- 1.7.2 Quality assurance metrics
- 1.7.3 Our commitment to trust
- 1.8 Market definitions
Chapter 2 Executive Summary
- 2.1 Industry 360-degree synopsis, 2022 - 2035
- 2.2 Business trends
- 2.3 End Use trends
- 2.4 Type trends
- 2.5 Pitch System trends
- 2.6 Blade Length trends
- 2.7 Regional trends
Chapter 3 Industry Insights
- 3.1 Industry ecosystem
- 3.1.1 Raw material availability & sourcing analysis
- 3.1.2 Manufacturing capacity assessment
- 3.1.3 Supply chain resilience & risk factors
- 3.1.4 Distribution network analysis
- 3.2 Regulatory landscape
- 3.3 Industry impact forces
- 3.3.1 Growth drivers
- 3.3.2 Industry pitfalls & challenges
- 3.4 Growth potential analysis
- 3.5 Price trend analysis
- 3.5.1 By type
- 3.5.2 By region
- 3.6 Cost structure analysis
- 3.7 Porter's analysis
- 3.7.1 Bargaining power of suppliers
- 3.7.2 Bargaining power of buyers
- 3.7.3 Threat of new entrants
- 3.7.4 Threat of substitutes
- 3.8 PESTEL analysis
- 3.8.1 Political factors
- 3.8.2 Economic factors
- 3.8.3 Social factors
- 3.8.4 Technological factors
- 3.8.5 Legal factors
- 3.8.6 Environmental factors
- 3.9 Emerging opportunities & trends
- 3.9.1 Digitalization & IoT integration
- 3.9.2 Emerging market penetration
- 3.10 Investment analysis and future outlook
Chapter 4 Competitive landscape, 2026
- 4.1 Introduction
- 4.2 Company market share analysis, 2025
- 4.2.1 North America
- 4.2.2 Europe
- 4.2.3 Asia Pacific
- 4.2.4 Middle East & Africa
- 4.2.5 Latin America
- 4.3 Strategic dashboard
- 4.4 Strategic initiatives
- 4.5 Innovation & technology landscape
Chapter 5 Market Size and Forecast, By End Use, 2022 - 2035 (USD Million & MW)
- 5.1 Key trends
- 5.2 Onshore
- 5.3 Offshore
Chapter 6 Market Size and Forecast, By Type, 2022 - 2035 (USD Million & MW)
- 6.1 Key trends
- 6.2 <1000 W
- 6.3 1000 W - 3000 W
- 6.4 >3000 W
Chapter 7 Market Size and Forecast, By Pitch System, 2022 - 2035 (USD Million & MW)
- 7.1 Key trends
- 7.2 Electric
- 7.3 Mechanical
- 7.4 Hydraulic
Chapter 8 Market Size and Forecast, By Blade Length, 2022 - 2035 (USD Million & MW)
- 8.1 Key trends
- 8.2 Small
- 8.3 Medium
- 8.4 Large
Chapter 9 Market Size and Forecast, By Region, 2022 - 2035 (USD Million)
- 9.1 Key trends
- 9.2 North America
- 9.2.1 U.S.
- 9.2.2 Canada
- 9.2.3 Mexico
- 9.3 Europe
- 9.3.1 Germany
- 9.3.2 Spain
- 9.3.3 UK
- 9.3.4 France
- 9.3.5 Italy
- 9.3.6 Sweden
- 9.3.7 Poland
- 9.3.8 Denmark
- 9.3.9 Portugal
- 9.3.10 Netherlands
- 9.3.11 Ireland
- 9.3.12 Belgium
- 9.4 Asia Pacific
- 9.4.1 China
- 9.4.2 India
- 9.4.3 Australia
- 9.4.4 Japan
- 9.4.5 South Korea
- 9.4.6 Vietnam
- 9.4.7 Thailand
- 9.4.8 Philippines
- 9.4.9 Taiwan
- 9.5 Middle East & Africa
- 9.5.1 South Africa
- 9.5.2 Egypt
- 9.6 Latin America
- 9.6.1 Brazil
- 9.6.2 Chile
- 9.6.3 Argentina
Chapter 10 Company Profiles
- 10.1 ABB
- 10.2 ABM Greiffenberger
- 10.3 Bosch Rexroth AG
- 10.4 Bonfiglioli S.p.A
- 10.5 Comer Industries
- 10.6 Dana SAC UK
- 10.7 General Electric
- 10.8 Goldwind Science and Technologies
- 10.9 KEBA
- 10.10 Liebherr
- 10.11 Mitsubishi Heavy Industries
- 10.12 Nabtesco Corporation
- 10.13 Nanjing High Speed Gear Manufacturing
- 10.14 Nidec Conversion
- 10.15 Nordex
- 10.16 SIPCO-MLS
- 10.17 Siemens Gamesa Renewable Energy
- 10.18 Schaeffler Group
- 10.19 Vestas Wind Systems
- 10.20 ZOLLERN GmbH
 风力发电机轴承市场:按轴承类型、安装位置、材质、涡轮机类型和最终用户划分,全球预测,2026-2032年风力发电机铸件市场:依铸造类型、材质、製造流程、产能范围、涡轮机类型、加工状态、最终用途划分,全球预测(2026-2032年)风力发电机齿轮油市场:按产品类型、涡轮机类型、功能、添加剂、应用和最终用户划分-2026-2032年全球预测
 2026-2030年全球风力发电机零件市场
 2026年全球风力发电机铸件市场报告风力发电机梯架市场:依产品类型、材料、通路和最终用户划分,全球预测(2026-2032年)
 风力发电机零件市场规模、份额、趋势和预测:按零件、风力发电机类型、风力发电厂类型和地区划分,2026-2034年风力发电机电刷架市场:依发电机类型、销售管道、电刷材料、安装类型、最终用途划分,全球预测(2026-2032年)2026年全球风力水泵市场报告
 风力发电机变桨系统市场规模、份额和成长分析(按产品类型、应用、组件、容量和地区划分)-2026-2033年产业预测