


 |
市场调查报告书
商品编码
1982268
电力製液(P2L)物流市场:成长机会、成长要素、产业趋势分析及2026-2035年预测Power-to-Liquids Logistics Market Opportunity, Growth Drivers, Industry Trend Analysis, and Forecast 2026 - 2035 |
||||||
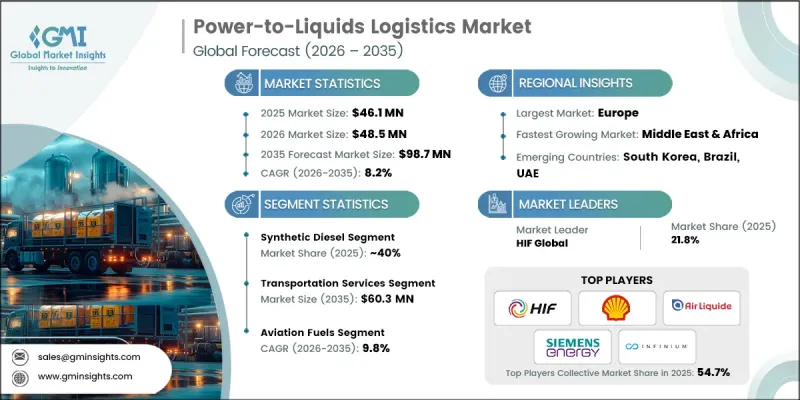
全球电力製液 (P2L) 物流市场预计到 2025 年将价值 4,610 万美元,预计到 2035 年将以 8.2% 的复合年增长率增长至 9,870 万美元。
随着全球加速推动难以电气化的交通运输产业的脱碳进程,市场成长动能日益强劲。这个市场反映出对用于管理再生能源和利用碳捕获合成燃料的专用基础设施的需求不断增长。气候变迁法规、不断演进的永续性目标以及合成燃料商业化的推进,共同推动了这一成长趋势。由于生产基地通常位于可再生能源中心和碳捕获设施附近,高效的储存、处理和运输系统对于确保终端使用者的安全供应至关重要。因此,相关人员正在投资码头升级、先进的运输网路和数位化监控平台,以满足P2L(电转液)物流需求。在支持性政策框架持续推动基础建设的同时,创新也不断提升整个供应链的营运可靠性、可追溯性和安全标准。
| 市场范围 | |
|---|---|
| 开始年份 | 2025 |
| 预测期 | 2026-2035 |
| 上市时的市场规模 | 4610万美元 |
| 预测金额 | 9870万美元 |
| 复合年增长率 | 8.2% |
电力製油 (P2L) 物流市场正受惠于旨在减少碳排放的监管措施。政策奖励和合规框架正在整体仓储和配送系统的基础设施升级和私人投资。技术进步也在改变物流绩效,现代化管道正在维修以适应合成燃料,新型铁路车辆、船舶和油轮系统也正在投入使用。能源生产商、物流运营商和科技公司携手建构一体化配送模式,产业合作正在加速发展。各公司正在部署数位化追踪平台、自动化工具和先进的安全系统以简化营运。联合倡议正在支持专用混合设施的建设、增强型仓储设施的开发以及生产工厂与多模态走廊的无缝连接。
在电力製油(P2L)物流市场中,预计到2025年,合成柴油将占据40%的市场份额,市场规模将达到1,820万美元。其主导地位得益于航运和运输业的强劲需求。合成柴油与传统柴油基础设施相容,无需对储油码头或燃料配送系统进行大规模维修,即可透过现有的公路、铁路和海运网路进行运输。这种营运柔软性提高了成本效益,并加速了市场普及。
预计到2025年,运输服务领域将占62.7%的市场份额,到2035年将达到6,030万美元。由于生产设施通常与消费点地理位置相距甚远,运输仍是P2L物流市场中最关键的因素。虽然合成燃料工厂通常位于可再生能源资源和碳捕获区域附近,但工业丛集、港口和机场等主要需求中心却位于其他地区。供需之间的这种物理距离增加了对协调的多模态网络的依赖,使得物流成为计划总成本和市场成长的重要影响因素。
预计2025年,美国电力製油(P2L)物流市场规模将达860万美元。美国正崛起为商业规模合成燃料生产的战略枢纽,直接推动了物流的扩张。联邦和州级永续性政策正在促进对专用仓储设施、铁路连接、海运出口能力以及旨在应对日益增长的燃料运输量的道路运输解决方案的资本投入。随着国内产能的扩大,对跨区域走廊的综合性、标准化物流系统的需求持续成长。
目录
第一章:调查方法
第二章执行摘要
第三章业界考察
- 生态系分析
- 供应商情况
- 利润率
- 成本结构
- 每个阶段增加的价值
- 影响价值链的因素
- 中断
- 影响产业的因素
- 促进因素
- 提高对永续航空燃料(SAF)的要求
- 严格的全球脱碳和净零排放目标
- 政府奖励和碳定价机制
- 建构跨境绿色燃料贸易走廊
- 产业潜在风险与挑战
- 专用仓储和运输设施有限。
- 对可再生能源供应状况的依赖
- 市场机会
- 开发电子燃料专用出口码头
- 官民合作关係促进永续燃料走廊建设
- 向可再生能源资源丰富的新兴地区扩张
- 促进因素
- 成长潜力分析
- 监理情势
- 北美洲
- 美国环保署(EPA)
- 联邦能源管理委员会(FERC)
- 国家可再生能源实验室(NREL)
- 加拿大能源监理局(CER)
- 欧洲
- 可再生燃料监理委员会(REFUREC)
- 欧盟委员会能源总司
- 欧洲能源监管机构委员会(CEER)
- 欧洲航空安全局(EASA)
- 亚太地区
- 东协能源监理网络(AERN)
- 泰国能源监管委员会
- 中国国家能源局
- 澳洲可再生能源署(ARENA)
- 拉丁美洲
- 石油、天然气和生质燃料管理局(ANP)
- 能源监理委员会(CRE)
- 国家能源政策委员会(CNPE)
- 中东和非洲
- RAERESA
- 南非国家能源监管局(NERSA)
- 波湾合作理事会互联机构(GCCIA)
- 北美洲
- 波特五力分析
- PESTEL 分析
- 科技与创新趋势
- 当前技术趋势
- 提高电解槽效率
- 费托合成製程的优化
- 可再生氢整合到燃料合成中
- 新兴技术
- 将直接空气回收(DAC)整合到PtL系统中
- 商业规模固体氧化物电解(SOEC)
- 当前技术趋势
- 生产统计
- 生产基地
- 消费者群体
- 出口和进口
- 价格趋势
- 按地区
- 按燃料
- 成本細項分析
- 永续性和环境影响
- 环境影响评估
- 社会影响和对社区的益处
- 公司管治与企业社会责任
- 永续金融与投资趋势
- 基础建设发展现况及能力分析
- 全球PtL生产设施分布图
- 区域物流基础设施短缺
- 终端和混合设施的可用性
- 管道和运输网路的适用性
- 未来基础建设投资需求
- 物流风险评估与缓解措施
- 储存稳定性和劣化风险
- 运输安全通讯协定
- 供应链中断情景
- 紧急时应对计画和备用路线
- 案例研究
- 未来展望与机会
第四章 竞争情势
- 介绍
- 企业市占率分析
- 北美洲
- 欧洲
- 亚太地区
- 拉丁美洲
- 中东和非洲(MEA)
- 主要市场公司的竞争分析
- 竞争定位矩阵
- 主要进展
- 併购
- 伙伴关係与合作
- 新产品发布
- 业务拓展计划及资金筹措
第五章 市场估算与预测:依燃料类型划分,2022-2035年
- 合成航空燃料(SAF)
- 合成柴油
- 乙醇
- 其他的
第六章 市场估算与预测:依物流服务划分,2022-2035年
- 运输服务
- 铁路
- 陆路交通
- 海上运输
- 管道
- 储存服务
- 其他的
第七章 市场估计与预测:依最终用途划分,2022-2035年
- 航空燃料
- 船用燃料
- 道路运输燃料
第八章 市场估计与预测:依地区划分,2022-2035年
- 北美洲
- 我们
- 加拿大
- 欧洲
- 德国
- 英国
- 法国
- 义大利
- 西班牙
- 比利时
- 俄罗斯
- 荷兰
- 亚太地区
- 中国
- 印度
- 日本
- 韩国
- 澳洲
- 新加坡
- 马来西亚
- 印尼
- 越南
- 泰国
- 拉丁美洲
- 巴西
- 墨西哥
- 阿根廷
- 哥伦比亚
- 中东和非洲(MEA)
- 南非
- 沙乌地阿拉伯
- 阿拉伯聯合大公国
第九章:公司简介
- 世界公司
- HIF Global
- Infinium
- Siemens Energy
- Sunfire
- Shell
- Air Liquide
- BP
- 当地公司
- Nordic Electrofuel
- P2X Solutions
- Repsol
- Twelve
- INERATEC
- Linde
- 物流公司
- Kuehne+Nagel
- DHL
- Hoyer
- 新兴企业
- Synhelion
- Aemetis
- Carbon Engineering
- Dimensional Energy
The Global Power-to-Liquids Logistics Market was valued at USD 46.1 million in 2025 and is estimated to grow at a CAGR of 8.2% to reach USD 98.7 million by 2035.
Market growth is gaining momentum as global industries accelerate efforts to decarbonize hard-to-electrify transportation segments such as aviation and maritime shipping. The market reflects the growing need for specialized infrastructure to manage fuels synthesized from renewable electricity and captured carbon. This upward trajectory is fueled by climate-driven regulations, evolving sustainability targets, and the increasing commercialization of synthetic fuels. Because production sites are typically located near renewable energy hubs or carbon capture facilities, efficient storage, handling, and transportation systems are crucial to ensure safe delivery to end-users. As a result, stakeholders are channeling investments into upgraded terminals, advanced transport networks, and digital monitoring platforms tailored to power-to-liquids logistics requirements. Supportive policy frameworks continue to shape infrastructure development, while innovation is improving operational reliability, traceability, and safety standards across the supply chain.
| Market Scope | |
|---|---|
| Start Year | 2025 |
| Forecast Year | 2026-2035 |
| Start Value | $46.1 Million |
| Forecast Value | $98.7 Million |
| CAGR | 8.2% |
The power-to-liquids logistics market is benefiting significantly from regulatory mandates designed to lower carbon emissions. Policy incentives and compliance frameworks are encouraging infrastructure upgrades and private investment across storage and distribution systems. Technological progress is also transforming logistics performance, with modernized pipelines being adapted to accommodate synthetic fuels and newly engineered railcars, marine vessels, and tanker systems entering service. Industry collaboration is accelerating development, as energy producers, logistics providers, and technology companies work together to create integrated distribution models. Companies are deploying digital tracking platforms, automation tools, and advanced safety systems to streamline operations. Joint initiatives are supporting the construction of specialized blending facilities, reinforced storage installations, and seamless connectivity between production plants and multimodal transport corridors.
Within the power-to-liquids logistics market, the synthetic diesel segment accounted for 40% of the share in 2025, generating USD 18.2 million. Its leadership position is driven by strong adoption across marine and transportation applications. Synthetic diesel offers compatibility with conventional diesel infrastructure, allowing it to move through established road, rail, and maritime networks without requiring extensive modifications to storage terminals or fuel distribution systems. This operational flexibility enhances cost efficiency and accelerates market uptake.
The transportation services segment held 62.7% share in 2025 and is forecast to reach USD 60.3 million by 2035. Transportation remains the most critical component of the power-to-liquids logistics market because production facilities are often geographically distant from consumption centers. Synthetic fuel plants are typically positioned near renewable energy resources and carbon capture zones, while major demand hubs, including industrial clusters, ports, and airports, are located elsewhere. The physical separation between supply and demand increases reliance on coordinated, multimodal transport networks, making logistics a substantial contributor to overall project costs and market growth.
U.S. Power-to-Liquids Logistics Market reached USD 8.6 million in 2025. The United States is emerging as a strategic center for commercial-scale synthetic fuel production, which directly stimulates logistics expansion. Federal and state-level sustainability policies are encouraging capital allocation toward specialized storage, rail connectivity, marine export capacity, and road transport solutions designed to handle growing fuel volumes. As domestic production capacity scales, the need for integrated and compliant logistics systems continues to strengthen across regional corridors.
Key participants operating in the Global Power-to-Liquids Logistics Market include Air Liquide, BP, HIF Global, INERATEC, Infinium, Nordic Electrofuel, Shell, Siemens Energy, Sunfire, and Twelve. Companies competing in the Power-to-Liquids Logistics Market are strengthening their foothold through strategic partnerships, infrastructure investments, and technology integration. Many players are forming alliances with renewable energy producers, carbon capture developers, and transportation operators to secure long-term supply and distribution agreements. Firms are also investing in upgraded storage terminals, specialized tanker fleets, and adaptable pipeline systems to improve operational flexibility. Digitalization remains a central strategy, with companies deploying real-time tracking systems, predictive maintenance tools, and data-driven optimization platforms to enhance efficiency and safety.
Table of Contents
Chapter 1 Methodology
- 1.1 Research approach
- 1.2 Quality commitments
- 1.2.1 GMI AI policy & data integrity commitment
- 1.3 Research trail & confidence scoring
- 1.3.1 Research trail components
- 1.3.2 Scoring components
- 1.4 Data collection
- 1.4.1 Partial list of primary sources
- 1.5 Data mining sources
- 1.5.1 Paid sources
- 1.6 Base estimates and calculations
- 1.6.1 Base year calculation
- 1.7 Forecast model
- 1.8 Research transparency addendum
Chapter 2 Executive Summary
- 2.1 Industry 360° synopsis, 2022 - 2035
- 2.2 Key market trends
- 2.2.1 Regional
- 2.2.2 Fuel
- 2.2.3 Logistics Service
- 2.2.4 End-Use
- 2.3 TAM analysis, 2026-2035
- 2.4 CXO perspectives: Strategic imperatives
Chapter 3 Industry Insights
- 3.1 Industry ecosystem analysis
- 3.1.1 Supplier landscape
- 3.1.2 Profit margin
- 3.1.3 Cost structure
- 3.1.4 Value addition at each stage
- 3.1.5 Factor affecting the value chain
- 3.1.6 Disruptions
- 3.2 Industry impact forces
- 3.2.1 Growth drivers
- 3.2.1.1 Rising sustainable aviation fuel (SAF) mandates
- 3.2.1.2 Stringent global decarbonization and net-zero targets
- 3.2.1.3 Government incentives and carbon pricing mechanisms
- 3.2.1.4 Development of cross-border green fuel trade corridors
- 3.2.2 Industry pitfalls and challenges
- 3.2.2.1 Limited dedicated storage and transport facilities
- 3.2.2.2 Dependence on renewable power availability
- 3.2.3 Market opportunities
- 3.2.3.1 Development of dedicated e-fuel export terminals
- 3.2.3.2 Public-private partnerships for sustainable fuel corridors
- 3.2.3.3 Expansion into emerging renewable-rich regions
- 3.2.1 Growth drivers
- 3.3 Growth potential analysis
- 3.4 Regulatory landscape
- 3.4.1 North America
- 3.4.1.1 U.S. Environmental Protection Agency (EPA)
- 3.4.1.2 Federal Energy Regulatory Commission (FERC)
- 3.4.1.3 National Renewable Energy Laboratory (NREL)
- 3.4.1.4 Canada Energy Regulator (CER)
- 3.4.2 Europe
- 3.4.2.1 Renewable Fuels Regulators Club (REFUREC)
- 3.4.2.2 European Commission - DG ENERGY
- 3.4.2.3 Council of European Energy Regulators (CEER)
- 3.4.2.4 European Union Aviation Safety Agency (EASA)
- 3.4.3 Asia Pacific
- 3.4.3.1 ASEAN Energy Regulators’ Network (AERN)
- 3.4.3.2 Energy Regulatory Commission (Thailand)
- 3.4.3.3 National Energy Administration (China)
- 3.4.3.4 Australian Renewable Energy Agency (ARENA)
- 3.4.4 Latin America
- 3.4.4.1 National Agency of Petroleum, Natural Gas and Biofuels (ANP)
- 3.4.4.2 Comision Reguladora de Energia (CRE)
- 3.4.4.3 National Energy Policy Council (CNPE)
- 3.4.5 Middle East & Africa
- 3.4.5.1 RAERESA
- 3.4.5.2 National Energy Regulator of South Africa (NERSA)
- 3.4.5.3 Gulf Cooperation Council Interconnection Authority (GCCIA)
- 3.4.1 North America
- 3.5 Porter's analysis
- 3.6 PESTEL analysis
- 3.7 Technology and innovation landscape
- 3.7.1 Current technological trends
- 3.7.1.1 Electrolyzer efficiency improvements
- 3.7.1.2 Fischer Tropsch synthesis optimization
- 3.7.1.3 Renewable hydrogen integration into fuel synthesis
- 3.7.2 Emerging technologies
- 3.7.2.1 Direct air capture (DAC) integration with PtL systems
- 3.7.2.2 Solid oxide electrolysis (SOEC) at commercial scale
- 3.7.1 Current technological trends
- 3.8 Production statistics
- 3.8.1 Production hubs
- 3.8.2 Consumption hubs
- 3.8.3 Export and import
- 3.9 Price trends
- 3.9.1 By region
- 3.9.2 By fuel
- 3.10 Cost breakdown analysis
- 3.11 Sustainability and environmental impact
- 3.11.1 Environmental impact assessment
- 3.11.2 Social impact & community benefits
- 3.11.3 Governance & corporate responsibility
- 3.11.4 Sustainable finance & investment trends
- 3.12 Infrastructure Readiness & Capacity Analysis
- 3.12.1 Global PtL production facility mapping
- 3.12.2 Logistics infrastructure gaps by region
- 3.12.3 Terminal and blending facility availability
- 3.12.4 Pipeline and transportation network adequacy
- 3.12.5 Future infrastructure investment requirements
- 3.13 Logistics Risk Assessment & Mitigation
- 3.13.1 Storage stability and degradation risks
- 3.13.2 Transportation safety protocols
- 3.13.3 Supply chain disruption scenarios
- 3.13.4 Contingency planning and alternative routing
- 3.14 Case studies
- 3.15 Future outlook & opportunities
Chapter 4 Competitive Landscape, 2025
- 4.1 Introduction
- 4.2 Company market share analysis
- 4.2.1 North America
- 4.2.2 Europe
- 4.2.3 Asia Pacific
- 4.2.4 LATAM
- 4.2.5 MEA
- 4.3 Competitive analysis of major market players
- 4.4 Competitive positioning matrix
- 4.5 Key developments
- 4.5.1 Mergers & acquisitions
- 4.5.2 Partnerships & collaborations
- 4.5.3 New product launches
- 4.5.4 Expansion plans and funding
Chapter 5 Market Estimates & Forecast, By Fuel, 2022 - 2035 ($Mn)
- 5.1 Key trends
- 5.2 Synthetic Aviation Fuel (SAF)
- 5.3 Synthetic diesel
- 5.4 E-methanol
- 5.5 Others
Chapter 6 Market Estimates & Forecast, By Logistics Service, 2022 - 2035 ($Mn)
- 6.1 Key trends
- 6.2 Transportation services
- 6.2.1 Rail
- 6.2.2 Road
- 6.2.3 Sea
- 6.2.4 Pipeline
- 6.3 Storage services
- 6.4 Others
Chapter 7 Market Estimates & Forecast, By End Use, 2022 - 2035 ($Mn)
- 7.1 Key trends
- 7.2 Aviation fuels
- 7.3 Marine fuels
- 7.4 Road transport fuels
Chapter 8 Market Estimates & Forecast, By Region, 2022 - 2035 ($Mn)
- 8.1 Key trends
- 8.2 North America
- 8.2.1 US
- 8.2.2 Canada
- 8.3 Europe
- 8.3.1 Germany
- 8.3.2 UK
- 8.3.3 France
- 8.3.4 Italy
- 8.3.5 Spain
- 8.3.6 Belgium
- 8.3.7 Russia
- 8.3.8 Netherlands
- 8.4 Asia Pacific
- 8.4.1 China
- 8.4.2 India
- 8.4.3 Japan
- 8.4.4 South Korea
- 8.4.5 Australia
- 8.4.6 Singapore
- 8.4.7 Malaysia
- 8.4.8 Indonesia
- 8.4.9 Vietnam
- 8.4.10 Thailand
- 8.5 Latin America
- 8.5.1 Brazil
- 8.5.2 Mexico
- 8.5.3 Argentina
- 8.5.4 Colombia
- 8.6 MEA
- 8.6.1 South Africa
- 8.6.2 Saudi Arabia
- 8.6.3 UAE
Chapter 9 Company Profiles
- 9.1 Global players
- 9.1.1 HIF Global
- 9.1.2 Infinium
- 9.1.3 Siemens Energy
- 9.1.4 Sunfire
- 9.1.5 Shell
- 9.1.6 Air Liquide
- 9.1.7 BP
- 9.2 Regional players
- 9.2.1 Nordic Electrofuel
- 9.2.2 P2X Solutions
- 9.2.3 Repsol
- 9.2.4 Twelve
- 9.2.5 INERATEC
- 9.2.6 Linde
- 9.3 Logistics players
- 9.3.1 Kuehne + Nagel
- 9.3.2 DHL
- 9.3.3 Hoyer
- 9.4 Emerging players
- 9.4.1 Synhelion
- 9.4.2 Aemetis
- 9.4.3 Carbon Engineering
- 9.4.4 Dimensional Energy
 2026年全球电力服务市场报告
 能源转型融资市场预测至2034年-按资金筹措方式、组成部分、能源来源、应用、最终用户和地区分類的全球分析
 能源即服务市场:依服务模式、经营模式、最终用户和服务供应商划分-2026-2032年全球市场预测2026年全球能源物流市场报告能源物流市场:2026-2032年全球市场预测(依能源来源、服务类型、最终用户产业及运输方式划分)
 能源即服务 (EaaS) 市场规模、份额、成长和全球产业分析:按类型、应用和地区分類的洞察,2026-2034 年预测2026年全球能源即服务市场报告2026年全球能源即服务(EaaS)市场报告
 能源即服务市场-全球产业规模、份额、趋势、机会与预测:按服务类型、最终用户、地区和竞争对手划分,2021-2031年商业电气服务市场:按服务、计划、技术、用途和应用划分,全球预测,2026-2032年