


 |
市场调查报告书
商品编码
1982347
臭氧产生器市场:商业机会、成长要素、产业趋势分析及2026-2035年预测Ozone Generator Market Opportunity, Growth Drivers, Industry Trend Analysis, and Forecast 2026 - 2035 |
||||||
预计到 2025 年,全球臭氧产生器市场价值将达到 4.662 亿美元,年复合成长率为 7.3%,到 2035 年将达到 9.304 亿美元。
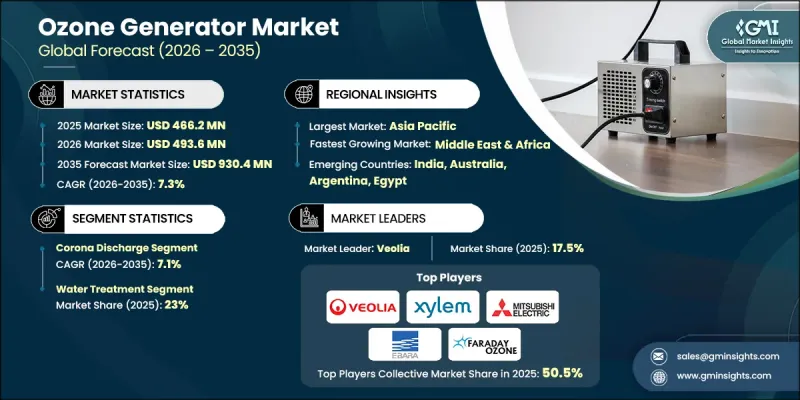
工业废弃物排放的不断增加和污染的日益严重导致全球空气和水质恶化,从而增加了对臭氧发生器等先进处理技术的需求。臭氧发生器利用电晕放电和紫外线照射等方法将氧气转化为臭氧气体。臭氧是一种强氧化剂和消毒剂,广泛应用于水和废水处理、空气净化、除臭和工业生产过程。为因应主要地区日益严重的都市区污染,世界各国政府正在实施旨在改善空气和水质的政策,这提振了市场前景。各国优先发展永续工业的国家策略,加上监管支援、技术进步和贸易便利化进程,进一步加速了臭氧处理系统在全球的应用。
| 市场范围 | |
|---|---|
| 开始年份 | 2025 |
| 预测期 | 2026-2035 |
| 上市时的市场规模 | 4.662亿美元 |
| 预测金额 | 9.304亿美元 |
| 复合年增长率 | 7.3% |
预计到2025年,电晕放电技术将占据43.3%的市场份额,并在2035年之前以7.1%的复合年增长率成长。其高功率、高能源效率的设计使其能够持续产生高浓度臭氧,因此非常适合大规模水处理厂、工业污水处理设施以及需要可靠且扩充性性能的应用。为了满足客户需求并推动市场成长,各公司正越来越多地将这项技术整合到其产品中。
预计到2025年,水处理市占率将达到23%,并在2026年至2035年间以8%的复合年增长率成长。饮用水净化、污水回用和水处理基础设施投资的增加正在推动该领域的应用。臭氧系统因其高效的杀菌、去除有机杂质以及无化学残留的特性而备受青睐。政府法规和机构为执行更严格的水质标准所做的努力,正在加速向先进的臭氧水处理解决方案的转变。
预计到2025年,美国臭氧产生器市占率将达到90.6%,到2035年市场规模将达到1.77亿美元。联邦和州政府对水质净化、污水回用和环保计划的资助推动了臭氧产生器的普及应用。公共产业越来越依赖无化学消毒技术,以符合更严格的水质法规和永续性目标。主要企业的加入以及与新兴企业的策略合作进一步巩固了美国市场的领先地位。
目录
第一章:调查方法和范围
第二章执行摘要
第三章业界考察
- 产业生态系统
- 原物料供应及采购分析
- 生产能力评估
- 供应链韧性与风险因素
- 配电网路分析
- 监理情势
- 影响产业的因素
- 促进因素
- 产业潜在风险与挑战
- 成长潜力分析
- 波特的分析
- 供应商的议价能力
- 买方的议价能力
- 新进入者的威胁
- 替代品的威胁
- PESTEL 分析
- 成本结构分析
- 价格趋势分析(美元/单位)
- 透过技术
- 投资分析及未来展望
- 水处理的去中心化
- 数位化和物联网集成
- 能源效率创新
- 技术创新趋势
- 电晕放电技术的进步
- 电解臭氧发生技术的创新
- 紫外线发生技术的进步
- 冷等离子技术的发展
第四章 竞争情势
- 介绍
- 企业市占率分析:按地区划分
- 北美洲
- 欧洲
- 亚太地区
- 拉丁美洲
- 中东和非洲
- 战略仪錶板
- 策略倡议
- 企业标竿管理
- 创新与科技趋势
第五章 市场规模及预测:依技术划分,2022-2035年
- 紫外线
- 低温等离子体
- 冠状病毒出院
- 电解
第六章 市场规模与预测:依应用领域划分,2022-2035年
- 水处理
- 水处理
- 工业製程水处理
- 其他的
- 实验室和医疗设备
- 空气处理
- 其他的
第七章 市场规模及预测:依最终用途划分,2022-2035年
- 商业的
- 地方政府
- 工业的
- 车
- 食品/饮料
- 纤维
- 製药
- 其他的
第八章 市场规模及预测:依产能划分,2022-2035年
- 5克/小时或以上
- 5 g/h~100 g/h
- 100 g/h~1 kg/h
- 1 kg/h-5 kg/h
- 超过 5 公斤/小时
第九章 市场规模及预测:依地区划分,2022-2035年
- 北美洲
- 我们
- 加拿大
- 欧洲
- 德国
- 英国
- 法国
- 俄罗斯
- 义大利
- 西班牙
- 亚太地区
- 中国
- 澳洲
- 印度
- 日本
- 中东和非洲
- 沙乌地阿拉伯
- 阿拉伯聯合大公国
- 埃及
- 拉丁美洲
- 巴西
- 阿根廷
第十章:公司简介
- Aeolus Sustainable Bio Energy Pvt Ltd
- Aurozone
- Chemtronics
- EBARA Technologies
- Eltech Ozone Pvt. Ltd.
- Faraday Ozone
- Prolux
- Guangzhou Quanju Ozone Technology Co., Ltd.
- Minnuo Gas Equipment Co., Ltd
- Mitsubishi Electric
- OTSIL
- Oxyzone International
- OZ-AIR Malaysia
- Ozonetek
- Pacific Water Technology
- Primozone
- Salher
- Veolia
- Toshiba
- Xylem Water
The Global Ozone Generator Market was valued at USD 466.2 million in 2025 and is estimated to grow at a CAGR of 7.3% to reach USD 930.4 million by 2035.
Rising industrial waste discharge and escalating pollution are increasingly affecting global air and water quality, driving the demand for advanced treatment technologies such as ozone generators. Ozone generators produce ozone gas by converting oxygen through methods like electrical corona discharge or ultraviolet radiation. This ozone acts as a powerful oxidant and disinfectant, widely utilized in water and wastewater treatment, air purification, odor elimination, and industrial processes. Growing urban pollution in major regions has prompted governments to implement policies aimed at improving air and water quality, boosting the market outlook. National strategies prioritizing sustainable industrial growth, coupled with regulatory support, technological advancements, and improved trade facilitation, are further enhancing the adoption of ozone-based treatment systems worldwide.
| Market Scope | |
|---|---|
| Start Year | 2025 |
| Forecast Year | 2026-2035 |
| Start Value | $466.2 Million |
| Forecast Value | $930.4 Million |
| CAGR | 7.3% |
The corona discharge technology segment held a 43.3% share in 2025 and is expected to grow at a CAGR of 7.1% through 2035. Its high output and energy-efficient design enable continuous ozone production at higher concentrations, making it ideal for large-scale water treatment plants, industrial wastewater facilities, and operations requiring reliable, scalable performance. Companies increasingly integrate this technology into their offerings, responding to customer demand and driving market growth.
The water treatment segment accounted for a 23% share in 2025 and is anticipated to grow at a CAGR of 8% from 2026 to 2035. Rising investments in drinking water purification, wastewater reuse, and water treatment infrastructure are fueling adoption. Ozone-based systems are preferred for their effective disinfection, removal of organic impurities, and ability to treat water without leaving chemical residues. Government regulations and institutional initiatives enforcing stricter water quality standards are accelerating the transition toward advanced, ozone-based water treatment solutions.
U.S. Ozone Generator Market held a 90.6% share in 2025 and is projected to generate USD 177 million by 2035. Federal and state funding for water purification, wastewater reuse, and environmental projects is supporting ozone generator adoption. Utilities increasingly rely on chemical-free disinfection technologies to comply with stricter water quality regulations and sustainability objectives. The presence of major players and strategic partnerships with emerging firms further strengthens the U.S. market position.
Key companies shaping the Global Ozone Generator Market include Aeolus Sustainable Bio Energy Pvt Ltd, Aurozone, Chemtronics, EBARA Technologies, Eltech Ozone Pvt. Ltd., Faraday Ozone, Prolux, Guangzhou Quanju Ozone Technology Co., Ltd., Minnuo Gas Equipment Co., Ltd, Mitsubishi Electric, OTSIL, Oxyzone International, OZ-AIR Malaysia, Ozonetek, Pacific Water Technology, Primozone, Salher, Veolia, Toshiba, and Xylem Water. Companies in the Global Ozone Generator Market are employing diverse strategies to expand their market presence. They are investing in research and development to enhance energy efficiency and ozone output, introducing technologically advanced solutions to meet evolving regulatory standards, and forming strategic partnerships or alliances to enter new regional markets. Many are also focusing on strengthening domestic manufacturing capabilities, expanding distribution networks, and offering tailored solutions to industries with specific water and air treatment needs. These combined efforts help firms increase market share, reinforce brand recognition, and maintain a competitive edge in the growing ozone generator market.
Table of Contents
Chapter 1 Methodology & Scope
- 1.1 Research design
- 1.2 Quality commitment
- 1.2.1 GMI AI policy & data integrity commitment
- 1.2.1.1 Source consistency protocol
- 1.2.1 GMI AI policy & data integrity commitment
- 1.3 Research Trail & Confidence Scoring
- 1.3.1 Research Trail Components
- 1.3.2 Scoring Components
- 1.4 Data Collection
- 1.4.1 Partial list of primary sources
- 1.5 Data mining sources
- 1.5.1 Paid sources
- 1.5.1.1 Sources, by region
- 1.5.1 Paid sources
- 1.6 Base estimates and calculations
- 1.6.1 Base year calculation for any one approach
- 1.7 Forecast model
- 1.8 Research transparency addendum
- 1.8.1 Source attribution framework
- 1.8.2 Quality assurance metrics
- 1.8.3 Our commitment to trust
- 1.9 Market definitions
Chapter 2 Executive Summary
- 2.1 Industry synopsis, 2022 - 2035
- 2.2 Business trends
- 2.3 Technology trends
- 2.4 Application trends
- 2.5 End use trends
- 2.6 Capacity trends
- 2.7 Regional trends
Chapter 3 Industry Insights
- 3.1 Industry ecosystem
- 3.1.1 Raw material availability & sourcing analysis
- 3.1.2 Manufacturing capacity assessment
- 3.1.3 Supply chain resilience & risk factors
- 3.1.4 Distribution network analysis
- 3.2 Regulatory landscape
- 3.3 Industry impact forces
- 3.3.1 Growth drivers
- 3.3.2 Industry pitfalls & challenges
- 3.4 Growth potential analysis
- 3.5 Porter's analysis
- 3.5.1 Bargaining power of suppliers
- 3.5.2 Bargaining power of buyers
- 3.5.3 Threat of new entrants
- 3.5.4 Threat of substitutes
- 3.6 PESTEL analysis
- 3.6.1 Political factors
- 3.6.2 Economic factors
- 3.6.3 Social factors
- 3.6.4 Technological factors
- 3.6.5 Legal factors
- 3.6.6 Environmental factors
- 3.7 Cost structure analysis
- 3.8 Price trend analysis (USD/Units)
- 3.8.1 By technology
- 3.9 Investment analysis & future outlook
- 3.9.1 Decentralization of water treatment
- 3.9.2 Digitalization and IoT integration
- 3.9.3 Energy efficiency innovations
- 3.10 Technology Innovation Landscape
- 3.10.1 Corona discharge technology advancements
- 3.10.2 Electrolytic ozone generation innovations
- 3.10.3 UV-based generation developments
- 3.10.4 Cold plasma technology evolution
Chapter 4 Competitive landscape, 2026
- 4.1 Introduction
- 4.2 Company market share analysis, by region, 2025
- 4.2.1 North America
- 4.2.2 Europe
- 4.2.3 Asia Pacific
- 4.2.4 Latin America
- 4.2.5 Middle East & Africa
- 4.3 Strategic dashboard
- 4.4 Strategic initiatives
- 4.5 Company benchmarking
- 4.6 Innovation & technology landscape
Chapter 5 Market Size and Forecast, By Technology, 2022 - 2035 (USD Million & Units)
- 5.1 Key trends
- 5.2 Ultraviolet
- 5.3 Cold plasma
- 5.4 Corona discharge
- 5.5 Electrolytic
Chapter 6 Market Size and Forecast, By Application, 2022 - 2035 (USD Million & Units)
- 6.1 Key trends
- 6.2 Water treatment
- 6.2.1 Municipal water treatment
- 6.2.2 Industrial process water treatment
- 6.2.3 Others
- 6.3 Laboratory & medical equipment
- 6.4 Air treatment
- 6.5 Others
Chapter 7 Market Size and Forecast, By End Use, 2022 - 2035 (USD Million & Units)
- 7.1 Key trends
- 7.2 Commercial
- 7.3 Municipal
- 7.4 Industrial
- 7.4.1 Automotive
- 7.4.2 Food & beverages
- 7.4.3 Textile
- 7.4.4 Pharmaceutical
- 7.4.5 Others
Chapter 8 Market Size and Forecast, By Capacity, 2022 - 2035 (USD Million & Units)
- 8.1 Key trends
- 8.2 ≥ 5 gm/hr
- 8.3 5 gm/hr - 100 gm/hr
- 8.4 100 gm/hr - 1 kg/hr
- 8.5 1 kg/hr - 5 kg/hr
- 8.6 > 5 kg/hr
Chapter 9 Market Size and Forecast, By Region, 2022 - 2035 (USD Million & Units)
- 9.1 Key trends
- 9.2 North America
- 9.2.1 U.S.
- 9.2.2 Canada
- 9.3 Europe
- 9.3.1 Germany
- 9.3.2 UK
- 9.3.3 France
- 9.3.4 Russia
- 9.3.5 Italy
- 9.3.6 Spain
- 9.4 Asia Pacific
- 9.4.1 China
- 9.4.2 Australia
- 9.4.3 India
- 9.4.4 Japan
- 9.5 Middle East & Africa
- 9.5.1 Saudi Arabia
- 9.5.2 UAE
- 9.5.3 Egypt
- 9.6 Latin America
- 9.6.1 Brazil
- 9.6.2 Argentina
Chapter 10 Company Profiles
- 10.1 Aeolus Sustainable Bio Energy Pvt Ltd
- 10.2 Aurozone
- 10.3 Chemtronics
- 10.4 EBARA Technologies
- 10.5 Eltech Ozone Pvt. Ltd.
- 10.6 Faraday Ozone
- 10.7 Prolux
- 10.8 Guangzhou Quanju Ozone Technology Co., Ltd.
- 10.9 Minnuo Gas Equipment Co., Ltd
- 10.10 Mitsubishi Electric
- 10.11 OTSIL
- 10.12 Oxyzone International
- 10.13 OZ-AIR Malaysia
- 10.14 Ozonetek
- 10.15 Pacific Water Technology
- 10.16 Primozone
- 10.17 Salher
- 10.18 Veolia
- 10.19 Toshiba
- 10.20 Xylem Water
 空冷式臭氧产生器市场:按应用、技术、终端用户产业、产能和分销管道划分-2026-2032年全球预测水冷式臭氧产生器市场:按输出容量、模组类型、分销管道、应用和最终用户划分-2026-2032年全球预测
 全球臭氧产生器市场规模、份额、趋势和成长分析报告(2026-2034年)
 2026年全球臭氧产生器市场报告
 臭氧产生器市场 - 全球产业规模、份额、趋势、机会及预测(按技术、应用、最终用途、类型、地区和竞争格局划分,2021-2031年)
 日本臭氧发生器市场报告(按技术、应用、最终用户和地区划分,2026-2034年)
 臭氧产生器市场规模、份额和成长分析(按製程、技术、应用、终端用户产业和地区划分)-2026-2033年产业预测
 紫外线臭氧消毒设备:全球市占率及排名、总收入及需求预测(2025-2031年)
 全球工业製氧机市场(按气体类型/流量、尺寸、设计、技术、最终用途产业和地区划分)- 预测至2030年2025-2033年臭氧发生器市场报告(依技术、应用、最终用途及地区)