


 |
市场调查报告书
商品编码
1982363
驳船运输市场商机、成长机会、产业趋势分析及2026-2035年预测Barge Transportation Market Opportunity, Growth Drivers, Industry Trend Analysis, and Forecast 2026 - 2035 |
||||||
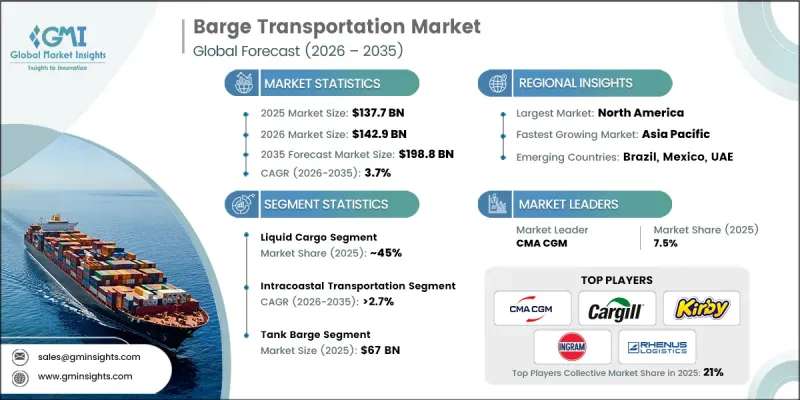
2025年全球驳船运输市场价值为1,377亿美元,预计到2035年将以3.7%的复合年增长率成长至1,988亿美元。
在全球贸易量不断增长以及对高效、安全且环境永续的货运需求日益增长的推动下,内河航运市场正在扩张。北美、欧洲和亚太地区的监管奖励、永续性义务以及政府政策,都在积极推动低排放运输,这促使船队所有者、物流运营商和驳船运营商采用先进的船队管理、预测性维护和运营优化解决方案。为了最大限度地提高船舶运转率、提升燃油效率并满足严格的安全和环保标准,各方加大了对引擎诊断、船体维护、辅助系统检查、自主导航和排放气体控制技术的投资。船队现代化、内河航道走廊的扩建以及货柜和散货驳船的引入,进一步加速了高效、数据驱动型解决方案的普及,而物联网赋能的监控、远端资讯处理和整合性能平台正在变革传统的驳船运营模式。
| 市场范围 | |
|---|---|
| 开始年份 | 2025 |
| 预测期 | 2026-2035 |
| 上市时的市场规模 | 1377亿美元 |
| 预测金额 | 1988亿美元 |
| 复合年增长率 | 3.7% |
液体货物运输占45%的市场份额,预计到2035年将以2.9%的复合年增长率成长。液体货物运输之所以占据市场主导地位,是因为透过内河航道和沿海驳船航线运输石油、化学品和其他散装液体对全球贸易、能源供应和工业活动仍然至关重要。高商业性价值、稳定的需求以及严格的监管要求,确保了航运公司和物流营运商持续使用驳船船队。
预计到2025年,沿海内河航运将占据60%的市场份额,并在2035年之前以2.7%的复合年增长率成长。沿海航道支援港口、工业中心和商业枢纽之间大量货物的运输,包括散装液体、石油产品、化学品和货柜货物。营运商正在推进船舶营运、安全通讯协定和货物装卸的标准化,以确保这些航道上可靠、高效且规范的运输。
美国驳船运输市场占83%的份额,预计2025年市场规模将达383亿美元。该地区受益于成熟的内河航道网络、庞大的船队运营和先进的港口基础设施。完善的河流系统、船队管理以及预测性维护技术的应用,正在巩固北美在安全、高运量驳船运输领域的领先地位。
目录
第一章:调查方法和范围
第二章执行摘要
第三章业界考察
- 生态系分析
- 供应商情况
- 利润率
- 成本结构
- 每个阶段增加的价值
- 影响价值链的因素
- 中断
- 影响产业的因素
- 促进因素
- 内河航运需求日益增长
- 车辆现代化数位化
- 永续交通的监管支持
- 贸易走廊的扩张
- 产业潜在风险与挑战
- 高昂的营运和维护成本
- 基础设施限制
- 市场机会
- 绿色和混合动力推进技术
- 预测性维护和人工智慧驱动的车辆管理
- 多式联运和货柜运输
- 进阶预测性维护服务
- 促进因素
- 成长潜力分析
- 监理情势
- 北美洲
- 美国:环保署、美国海岸警卫队、《清洁水法》、国家运输安全委员会
- 加拿大:加拿大运输部,CMVSS 305
- 欧洲
- 德国:BMDV,欧洲 6/7
- 法国:运输部,6/7欧元
- 英国:运输部,Euro 6/7
- 义大利:基础设施和运输部
- 亚太地区
- 中国:工信部、中国 6/7 标准
- 日本:国土交通省,JIS排放气体法规
- 韩国:国土交通部(MOLIT)、韩国(KS)排放标准
- 印度:MoRTH,BS6标准
- 拉丁美洲
- 巴西:DENATRAN、CONAMA 标准
- 墨西哥:通讯运输运输部发布NOM排放气体法规
- 中东和非洲
- 阿联酋:RTA、ESMA排放法规
- 沙乌地阿拉伯:运输部製定SASO排放标准
- 北美洲
- 波特的分析
- PESTEL 分析
- 科技与创新趋势
- 当前技术趋势
- 新兴技术
- 价格趋势
- 按地区
- 副产品
- 成本細項分析
- 专利分析
- 永续性和环境方面
- 永续倡议
- 减少废弃物策略
- 生产中的能源效率
- 环保意识的倡议
- 关于碳足迹的考量
- 使用案例场景
- 内河航道基础设施与运输能力评估
- 多式联运和模式转换趋势
- 车辆年龄结构与更换週期分析
第四章 竞争情势
- 介绍
- 企业市占率分析
- 北美洲
- 欧洲
- 亚太地区
- 拉丁美洲
- 中东和非洲
- 主要市场公司的竞争分析
- 竞争定位矩阵
- 战略展望矩阵
- 主要进展
- 併购
- 伙伴关係与合作
- 新产品发布
- 业务拓展计划及资金筹措
第五章 市场估价与预测:依货物类型划分,2022-2035年
- 液体货物
- 气态货物
- 干货
第六章 市场估算与预测:依驳船船队划分,2022-2035年
- 目标驳船
- 目前正在服役的驳船
- 油轮驳船
第七章 市场估算与预测:依驳船运输活动划分,2022-2035年
- 沿海和内陆运输
- 内河航运
第八章 市场规模估算与预测(2022-2035年)
- 140英尺至180英尺
- 195至250英尺
- 260至300英尺
- 超过300英尺
第九章 市场估计与预测:依应用领域划分,2022-2035年
- 煤炭
- 原油和石油产品
- 液态化学品
- 食品浆和其他液体
- 农产品
- 金属矿石和金属製品
- 製药
- 干粉和气态化学品
- 液化石油气、压缩天然气和其他气体产品
- 电子设备和数位设备
- 其他的
第十章 市场估价与预测:依地区划分,2022-2035年
- 北美洲
- 我们
- 加拿大
- 欧洲
- 英国
- 德国
- 法国
- 义大利
- 西班牙
- 比利时
- 荷兰
- 瑞典
- 亚太地区
- 中国
- 印度
- 日本
- 澳洲
- 新加坡
- 韩国
- 越南
- 印尼
- 拉丁美洲
- 巴西
- 墨西哥
- 阿根廷
- 中东和非洲(MEA)
- 阿拉伯聯合大公国
- 南非
- 沙乌地阿拉伯
第十一章:公司简介
- Global Player
- American Commercial Barge Line
- Cargill Marine &Terminal
- CMA CGM
- Contargo
- Ingram Barge
- Kirby
- Marquette Transportation
- McAllister Towing &Transportation
- Rhenus
- SEACOR
- Regional Player
- HGK Shipping
- Danser
- Argosy International
- Blessey Marine Services
- Ergon
- Haeger and Schmidt Logistics
- Heartland Barge Management
- Livingston International
- Maritime
- Waalhaven
The Global Barge Transportation Market was valued at USD 137.7 billion in 2025 and is estimated to grow at a CAGR of 3.7% to reach USD 198.8 billion by 2035.
The market is expanding as demand for inland waterway transport rises alongside global trade volumes and the need for efficient, safe, and environmentally sustainable cargo movement. Regulatory incentives promoting low-emission transport, sustainability mandates, and government policies in North America, Europe, and Asia Pacific are encouraging fleet owners, logistics providers, and barge operators to adopt advanced fleet management, predictive maintenance, and operational optimization solutions. Pressure to maximize vessel uptime, improve fuel efficiency, and meet strict safety and environmental standards is driving investment in engine diagnostics, hull maintenance, auxiliary system checks, automated navigation, and emission control technologies. Fleet modernization, expansion of inland shipping corridors, and adoption of containerized and bulk cargo barges further support the uptake of high-efficiency, data-driven solutions, while IoT-enabled monitoring, telematics, and integrated performance platforms are transforming traditional barge operations.
| Market Scope | |
|---|---|
| Start Year | 2025 |
| Forecast Year | 2026-2035 |
| Start Value | $137.7 Billion |
| Forecast Value | $198.8 Billion |
| CAGR | 3.7% |
The liquid cargo segment held a 45% share and is expected to grow at a CAGR of 2.9% through 2035. Liquid cargo dominates because transporting petroleum, chemicals, and other bulk liquids via inland waterways and coastal barge routes remains critical for global trade, energy supply, and industrial activities. The high commercial value, steady demand, and strict regulatory handling requirements ensure that barge fleets are consistently utilized by shipping companies and logistics providers.
The intracoastal transportation segment accounted for 60% share in 2025 and is projected to grow at a CAGR of 2.7% through 2035. Intracoastal routes support high-volume cargo movement between ports, industrial hubs, and commercial centers, handling bulk liquids, petroleum products, chemicals, and containerized goods. Operators are standardizing vessel operations, safety protocols, and cargo handling to ensure reliable, efficient, and compliant transport along these corridors.
US Barge Transportation Market held an 83% share, generating USD 38.3 billion in 2025. The region benefits from a mature inland waterway network, extensive fleet operations, and advanced port infrastructure. Well-developed river systems, fleet management adoption, and predictive maintenance technologies strengthen North America's leadership in safe, high-capacity barge transportation.
Key players operating in the Global Barge Transportation Market include Kirby Corporation, Cargill Marine & Terminal, American Commercial Barge Line, Marquette Transportation, McAllister Towing & Transportation, CMA CGM Group, Contargo, SEACOR, Rhenus Group, and Ingram Barge Company. Companies in the barge transportation market are employing multiple strategies to enhance their presence and strengthen their market foothold. Operators are investing in fleet modernization and adopting predictive maintenance solutions to maximize uptime and minimize operational costs. Integration of IoT, telematics, and automated navigation systems improves fuel efficiency, route optimization, and cargo monitoring. Strategic partnerships with logistics providers, port authorities, and industrial clients help expand route coverage and operational reach. Firms are focusing on specialized vessels for liquid and bulk cargo, compliance with safety and environmental regulations, and sustainability initiatives to gain a competitive edge.
Table of Contents
Chapter 1 Methodology & Scope
- 1.1 Market scope and definition
- 1.2 Research design
- 1.2.1 Research approach
- 1.2.2 Data collection methods
- 1.3 Data mining sources
- 1.3.1 Global
- 1.3.2 Regional/Country
- 1.4 Base estimates and calculations
- 1.4.1 Base year calculation
- 1.4.2 Key trends for market estimation
- 1.5 Primary research and validation
- 1.5.1 Primary sources
- 1.6 Forecast
- 1.7 Research assumptions and limitations
Chapter 2 Executive Summary
- 2.1 Industry 360° synopsis, 2022 - 2035
- 2.2 Key market trends
- 2.2.1 Regional
- 2.2.2 Cargo
- 2.2.3 Barge Fleet
- 2.2.4 Barging Activity
- 2.2.5 Size
- 2.2.6 Application
- 2.3 TAM Analysis, 2026-2035
- 2.4 CXO perspectives: Strategic imperatives
- 2.4.1 Executive decision points
- 2.4.2 Critical success factors
- 2.5 Future outlook and strategic recommendations
Chapter 3 Industry Insights
- 3.1 Industry ecosystem analysis
- 3.1.1 Supplier Landscape
- 3.1.2 Profit Margin
- 3.1.3 Cost structure
- 3.1.4 Value addition at each stage
- 3.1.5 Factor affecting the value chain
- 3.1.6 Disruptions
- 3.2 Industry impact forces
- 3.2.1 Growth drivers
- 3.2.1.1 Rising demand for inland waterway transport
- 3.2.1.2 Fleet modernization and digitalization
- 3.2.1.3 Regulatory support for sustainable transport
- 3.2.1.4 Expansion of trade corridors
- 3.2.2 Industry pitfalls and challenges
- 3.2.2.1 High operational and maintenance costs
- 3.2.2.2 Infrastructure limitations
- 3.2.3 Market opportunities
- 3.2.3.1 Green and hybrid propulsion technologies
- 3.2.3.2 Predictive maintenance and AI-driven fleet management
- 3.2.3.3 Intermodal & containerized transport
- 3.2.3.4 Advanced predictive maintenance services
- 3.2.1 Growth drivers
- 3.3 Growth potential analysis
- 3.4 Regulatory landscape
- 3.4.1 North America
- 3.4.1.1 U.S.: EPA, U.S. Coast Guard, Clean Water Act, NTSB
- 3.4.1.2 Canada: Transport Canada, CMVSS 305
- 3.4.2 Europe
- 3.4.2.1 Germany: BMDV, Euro 6/7
- 3.4.2.2 France: Ministry of Transport, Euro 6/7
- 3.4.2.3 UK: Department for Transport, Euro 6/7
- 3.4.2.4 Italy: Ministry of Infrastructure & Transport
- 3.4.3 Asia Pacific
- 3.4.3.1 China: MIIT, China 6/7 Standards
- 3.4.3.2 Japan: MLIT, JIS Emission Regulations
- 3.4.3.3 South Korea: MOLIT, KS Emission Standards
- 3.4.3.4 India: MoRTH, BS6 Norms
- 3.4.4 Latin America
- 3.4.4.1 Brazil: DENATRAN, CONAMA Standards
- 3.4.4.2 Mexico: Ministry of Communications & Transport, NOM Emission Regulations
- 3.4.5 Middle East and Africa
- 3.4.5.1 UAE: RTA, ESMA Emission Regulations
- 3.4.5.2 Saudi Arabia: Ministry of Transport, SASO Emission Standards
- 3.4.1 North America
- 3.5 Porter’s analysis
- 3.6 PESTEL analysis
- 3.7 Technology and Innovation Landscape
- 3.7.1 Current technological trends
- 3.7.2 Emerging technologies
- 3.8 Price trends
- 3.8.1 By region
- 3.8.2 By product
- 3.9 Cost breakdown analysis
- 3.10 Patent analysis
- 3.11 Sustainability and Environmental Aspects
- 3.11.1 Sustainable practices
- 3.11.2 Waste reduction strategies
- 3.11.3 Energy efficiency in production
- 3.11.4 Eco-friendly initiatives
- 3.11.5 Carbon footprint considerations
- 3.12 Use case scenarios
- 3.13 Inland Waterway Infrastructure & Capacity Assessment
- 3.14 Intermodal Connectivity & Modal Shift Dynamics
- 3.15 Fleet Age Profile & Replacement Cycle Analysis
Chapter 4 Competitive Landscape, 2025
- 4.1 Introduction
- 4.2 Company market share analysis
- 4.2.1 North America
- 4.2.2 Europe
- 4.2.3 Asia Pacific
- 4.2.4 Latin America
- 4.2.5 Middle East & Africa
- 4.3 Competitive analysis of major market players
- 4.4 Competitive positioning matrix
- 4.5 Strategic outlook matrix
- 4.6 Key developments
- 4.6.1 Mergers & acquisitions
- 4.6.2 Partnerships & collaborations
- 4.6.3 New product launches
- 4.6.4 Expansion plans and funding
Chapter 5 Market Estimates & Forecast, By Cargo, 2022 - 2035 ($Bn, Million tons)
- 5.1 Key trends
- 5.2 Liquid Cargo
- 5.3 Gaseous Cargo
- 5.4 Dry Cargo
Chapter 6 Market Estimates & Forecast, By Barge Fleet, 2022 - 2035 ($Bn, Million tons)
- 6.1 Key trends
- 6.2 Covered Barge
- 6.3 Opened Barge
- 6.4 Tank Barge
Chapter 7 Market Estimates & Forecast, By Barging Activity, 2022 - 2035 ($Bn, Million tons)
- 7.1 Key trends
- 7.2 Intracoastal Transportation
- 7.3 Inland Water Transport
Chapter 8 Market Estimates & Forecast, By Size, 2022 - 2035 ($Bn, Million tons)
- 8.1 Key trends
- 8.2 140ft to 180ft
- 8.3 195ft to 250ft
- 8.4 260ft to 300ft
- 8.5 300ft and above
Chapter 9 Market Estimates & Forecast, By Application , 2022 - 2035 ($Bn, Million tons)
- 9.1 Key trends
- 9.2 Coal
- 9.3 Crude & Petroleum Products
- 9.4 Liquid Chemicals
- 9.5 Food Pulp & Other Liquid
- 9.6 Agricultural Products
- 9.7 Metal Ores and Fabricated Metal Products
- 9.8 Pharmaceuticals
- 9.9 Dry & Gaseous Chemicals
- 9.10 LPG, CNG, and Other Gaseous Products
- 9.11 Electronics & Digital Equipment
- 9.12 Others
Chapter 10 Market Estimates & Forecast, By Region, 2022 - 2035 ($Bn, Million tons)
- 10.1 Key trends
- 10.2 North America
- 10.2.1 US
- 10.2.2 Canada
- 10.3 Europe
- 10.3.1 UK
- 10.3.2 Germany
- 10.3.3 France
- 10.3.4 Italy
- 10.3.5 Spain
- 10.3.6 Belgium
- 10.3.7 Netherlands
- 10.3.8 Sweden
- 10.4 Asia Pacific
- 10.4.1 China
- 10.4.2 India
- 10.4.3 Japan
- 10.4.4 Australia
- 10.4.5 Singapore
- 10.4.6 South Korea
- 10.4.7 Vietnam
- 10.4.8 Indonesia
- 10.5 Latin America
- 10.5.1 Brazil
- 10.5.2 Mexico
- 10.5.3 Argentina
- 10.6 MEA
- 10.6.1 UAE
- 10.6.2 South Africa
- 10.6.3 Saudi Arabia
Chapter 11 Company Profiles
- 11.1 Global Player
- 11.1.1 American Commercial Barge Line
- 11.1.2 Cargill Marine & Terminal
- 11.1.3 CMA CGM
- 11.1.4 Contargo
- 11.1.5 Ingram Barge
- 11.1.6 Kirby
- 11.1.7 Marquette Transportation
- 11.1.8 McAllister Towing & Transportation
- 11.1.9 Rhenus
- 11.1.10 SEACOR
- 11.2 Regional Player
- 11.2.1 HGK Shipping
- 11.2.2 Danser
- 11.2.3 Argosy International
- 11.2.4 Blessey Marine Services
- 11.2.5 Ergon
- 11.2.6 Haeger and Schmidt Logistics
- 11.2.7 Heartland Barge Management
- 11.2.8 Livingston International
- 11.2.9 Maritime
- 11.2.10 Waalhaven


