


 |
市场调查报告书
商品编码
1982364
增压器市场机会、成长要素、产业趋势分析及2026-2035年预测Hypercharger Market Opportunity, Growth Drivers, Industry Trend Analysis, and Forecast 2026 - 2035 |
||||||
全球超级充电器市场预计到 2025 年将价值 62 亿美元,预计到 2035 年将以 14.6% 的复合年增长率增长至 252 亿美元。
全球对永续发展和零排放交通目标的加速承诺正推动电动车 (EV) 的普及,从而催生了对高功率充电基础设施的需求。随着汽车製造商不断将产品线转向电动车型,对更快、更有效率的充电解决方案的需求变得日益迫切。充电网路营运商正优先发展能够缩短充电时间、提升整体便利性的超快速充电技术,进而解决电动车普及的主要障碍之一。已开发市场和新兴市场基础设施的扩展正在增强大众对长途电动出行的信心。各国政府正透过政策架构、财政援助计画和减排义务,在支持排放普及方面发挥核心作用。北美、欧洲和亚洲的投资正在加速高容量充电走廊和都市区充电中心的建设,确保更多人能够使用先进的充电系统。透过公共和私营部门的合作努力,超级充电桩正逐渐成为不断发展的全球电动车生态系统中不可或缺的一部分。
| 市场范围 | |
|---|---|
| 开始年份 | 2025 |
| 预测期 | 2026-2035 |
| 上市时的市场规模 | 62亿美元 |
| 预测金额 | 252亿美元 |
| 复合年增长率 | 14.6% |
与传统充电方式相比,高功率直流充电系统可显着减少车辆运作。某些电动车平台连接350kW充电器后,可在约15至30分钟内恢復80%的电池容量。相较之下,低功率充电方案达到类似充电等级需要更长的时间。 ABB、特斯拉和IONITY等业界领导企业正在部署先进的快速充电技术,旨在支援都市区通勤和长途高速公路驾驶。公共部门透过协调的资金筹措机制和以高容量充电网路为重点的监管支持,持续加速基础设施的部署。
50-150kW功率段占50.3%的市场份额,预计到2025年市场规模将达到31亿美元。此功率范围的充电器因其兼容多种车型且安装成本相对较低(相比高功率系统)而广泛应用。此类充电器通常可在1小时内为车辆充满电,适用于车辆停车时间适中的场所。其成本绩效使其在整个超级充电器市场中占据了基础性地位。
预计到2025年,乘用车市场将占总市场份额的92.4%,到2035年将达到226亿美元。这一主导地位反映了私家车占据充电次数和收入的大部分这一现实。虽然大部分充电活动发生在住宅和职场场所,但公共快速充电网路对于长途旅行以及无法使用私人充电设施的驾驶员至关重要。为了满足这一日益增长的需求,走廊式基础设施规划和都市区充电中心正在不断扩展。
预计到2025年,美国超级充电桩市场规模将达到9.879亿美元,这得益于联邦和州政府层级旨在提升充电便利性和减少排放领域排放的各项措施。政府主导的基础设施建设项目正在资助沿着战略交通路线扩建高功率充电站,以促进全国范围内的互联互通。这些措施优先考虑互通性、标准化部署和快速充电解决方案的广泛普及,有助于缓解续航里程的担忧,并加速电动车的普及。
目录
第一章:调查方法
第二章执行摘要
第三章业界考察
- 生态系分析
- 供应商情况
- 利润率
- 成本结构
- 每个阶段增加的价值
- 影响价值链的因素
- 中断
- 影响产业的因素
- 促进因素
- 加速全球电动车(EV)的普及
- 对更短充电时间和高功率基础设施的需求正在成长。
- 政府奖励和国家电动汽车基础设施发展计划
- 扩展高速公路和走廊式快速充电网络
- 产业潜在风险与挑战
- 输电网容量限制和配电限制
- 安装和升级电网需要大量资金投入。
- 市场机会
- 与可再生能源和能源储存系统的集成
- 新兴电动车市场的扩张
- 官民合作关係促进基础建设
- 商用车和车队车辆电气化进展
- 促进因素
- 成长潜力分析
- 监理情势
- 北美洲
- SAE J3400
- J1772
- NEVI 专案要求
- 欧洲
- 欧盟TEN-T法规
- 强制性CCS
- 亚太地区
- CHAdeMO 3.0
- GB/T
- 区域奖励
- 拉丁美洲
- 巴西ANEEL电动车充电法规结构
- 墨西哥电动车充电桩实施倡议
- 中东和非洲
- 阿联酋国家电动车政策
- 杜拜/阿布达比电动车充电网路法规
- 北美洲
- 投资与资金筹措分析
- 公共基础设施投资(NEVI,欧盟资助计画)
- 私募股权和创业投资的趋势
- 原始设备製造商和能源公司的策略性投资
- 波特的分析
- PESTEL 分析
- 科技与创新趋势
- 当前技术趋势
- 高功率直流充电(安装功率350kW或以上)
- 模组化电源架构
- 水冷充电线
- 动态负载管理
- 新兴技术
- 百万级充电(大型车辆的MCS)
- 车网互动(V2G)集成
- 人工智慧驱动的充电优化
- 可再生能源一体化充电站
- 当前技术趋势
- 价格分析(基于初步调查)
- 对过去价格趋势的分析
- 按业务类型分類的定价策略(溢价/价值/成本加成)
- 贸易数据分析(基于初步调查)
- 进出口量和进出口额的趋势
- 主要贸易走廊及关税的影响
- 专利趋势(基于初步调查)
- 永续性和环境影响
- 环境影响评估
- 社会影响和对社区的益处
- 公司管治与企业社会责任
- 永续金融与投资趋势
- 人工智慧对超级充电器市场的影响
- 利用人工智慧改造现有经营模式
- GenAI 各细分市场的应用案例与部署蓝图
- 风险、限制和监管考量
- 可再生能源的整合
- 现场光电发电与超级充电器结合。
- 能源储存系统(ESS)及充电基础设施
- 远端充电枢纽的微电网架构
- 车网互动(V2G)与可再生能源集成
- 多功能设施共用太阳能充电中心
- 超快速充电网路快速扩张
- 高速公路走廊的部署策略
- 适用于商业和车队应用的超高速枢纽
- 官民合作关係(PPP)与投资模式
- 技术标准化和互通性
- 案例研究
- 未来展望与机会
- 预测假设和情境分析(基于初步研究)
- 基本案例-驱动复合年增长率的关键宏观经济与产业变量
- 乐观情境-宏观经济与产业的顺风
- 悲观情景-宏观经济放缓或产业逆风
第四章 竞争情势
- 介绍
- 企业市占率分析
- 北美洲
- 欧洲
- 亚太地区
- 拉丁美洲
- 中东和非洲(MEA)
- 主要市场公司的竞争分析
- 竞争定位矩阵
- 主要进展
- 併购
- 伙伴关係与合作
- 新产品发布
- 业务拓展计划及资金筹措
第五章 市场估计与预测:依产量划分,2022-2035年
- 50~150 kW
- 150~350 kW
- 超过350千瓦
第六章 市场估价与预测:依车辆类型划分,2022-2035年
- 搭乘用车
- 掀背车
- 轿车
- SUV
- 商用车辆
- LCV
- MCV
- 重型车辆(HCV)
第七章 市场估算与预测:依连接器类型划分,2022-2035年
- CCS(Combined Charging System)
- CHAdeMO
- GB/T
- 其他的
第八章 市场估计与预测:依应用领域划分,2022-2035年
- 公共充电站
- 主路
- 都市区的充电站
- 船队和商业运营
- 零售和便利商店
- 购物中心和经销店
- 加油站
第九章 市场估价与预测:以充电地点划分,2022-2035年
- 都市区
- 郊区/沿高速公路
第十章 市场估价与预测:依地区划分,2022-2035年
- 北美洲
- 我们
- 加拿大
- 欧洲
- 德国
- 英国
- 法国
- 义大利
- 西班牙
- 比利时
- 俄罗斯
- 荷兰
- 亚太地区
- 中国
- 印度
- 日本
- 韩国
- 澳洲
- 新加坡
- 马来西亚
- 印尼
- 越南
- 泰国
- 拉丁美洲
- 巴西
- 墨西哥
- 阿根廷
- 哥伦比亚
- 中东和非洲(MEA)
- 南非
- 沙乌地阿拉伯
- 阿拉伯聯合大公国
第十一章:公司简介
- 世界公司
- ABB
- Tesla
- Siemens
- ChargePoint
- Tritium
- Schneider Electric
- Eaton
- Blink Charging
- Delta Electronics
- Kempower
- 当地公司
- EVgo Services
- Electrify America
- Alpitronic
- StarCharge
- Enel X Way
- EVBox
- 新兴企业
- Wallbox
- ADS-TEC Energy
- Compleo Charging
- Allego
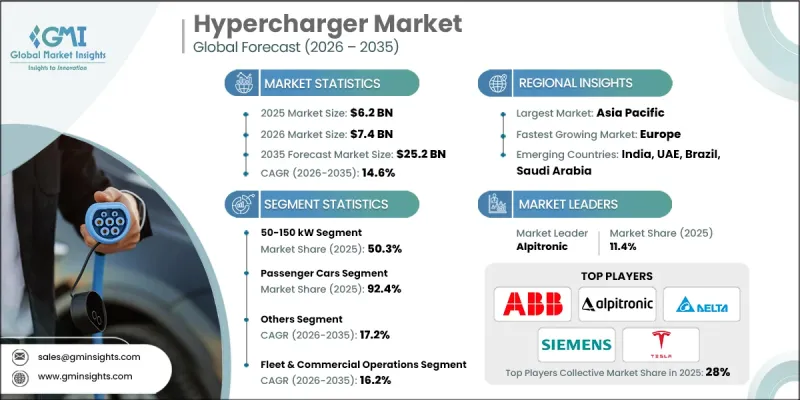
The Global Hypercharger Market was valued at USD 6.2 billion in 2025 and is estimated to grow at a CAGR of 14.6% to reach USD 25.2 billion by 2035.
Accelerating sustainability initiatives and zero-emission transportation targets worldwide are significantly increasing electric vehicle adoption, which in turn is driving demand for high-power charging infrastructure. As automotive manufacturers continue shifting their portfolios toward electrified models, the need for faster and more efficient charging solutions has become increasingly critical. Charging network operators are prioritizing ultra-fast technologies that reduce charging times and improve overall convenience, thereby addressing one of the primary barriers to EV adoption. Infrastructure expansion across developed and emerging markets is strengthening public confidence in long-distance electric mobility. Governments are playing a central role by supporting deployment through policy frameworks, funding programs, and emission-reduction mandates. Investments across North America, Europe, and Asia are accelerating the installation of high-capacity charging corridors and urban hubs, ensuring broader accessibility to advanced charging systems. These coordinated efforts between public authorities and private industry participants are positioning hyperchargers as essential components of the evolving global electric mobility ecosystem.
| Market Scope | |
|---|---|
| Start Year | 2025 |
| Forecast Year | 2026-2035 |
| Start Value | $6.2 Billion |
| Forecast Value | $25.2 Billion |
| CAGR | 14.6% |
High-power DC charging systems significantly reduce vehicle downtime compared to conventional alternatives. Certain EV platforms can replenish battery capacity to 80% within approximately 15 to 30 minutes when connected to 350 kW chargers. By contrast, lower-tier charging solutions require substantially longer durations to achieve similar levels. Industry leaders such as ABB, Tesla, and IONITY have introduced advanced fast-charging technologies designed to support both urban commuting and extended highway travel. Public-sector backing continues to accelerate infrastructure deployment through coordinated funding mechanisms and regulatory support focused on high-capacity charging networks.
The 50-150 kW segment held 50.3% share, generating USD 3.1 billion in 2025. This power range remains widely adopted due to its broad vehicle compatibility and comparatively lower installation costs than ultra-high-capacity systems. Chargers within this category typically deliver a meaningful driving range within a single hour, making them well-suited for locations where vehicles remain parked for moderate durations. Their cost-performance balance has solidified their role as a foundational tier within the overall hypercharger landscape.
The passenger vehicles segment accounted for 92.4% share in 2025 and is expected to reach USD 22.6 billion by 2035. This dominance reflects the reality that private vehicles represent the majority of charging sessions and revenue generation. While a substantial portion of charging activity occurs in residential and workplace environments, public fast-charging networks are essential for long-distance travel and for drivers without access to private charging infrastructure. Corridor-based infrastructure planning and urban charging hubs continue to expand to meet rising demand.
U.S. Hypercharger Market reached USD 987.9 million in 2025, supported by comprehensive federal and state-level initiatives aimed at improving charging accessibility and reducing transportation emissions. Government-backed infrastructure programs are funding the expansion of high-power charging stations along strategic transportation routes to facilitate nationwide connectivity. These efforts prioritize interoperability, standardized deployment, and widespread access to fast-charging solutions, helping to alleviate range anxiety and encourage broader EV adoption.
Major companies operating in the Global Hypercharger Market include Siemens, Schneider Electric, Delta Electronics, Alpitronic, Eaton, EVgo Services, Tritium, and Kempower. These companies compete through technological innovation, network expansion, and strategic collaborations with automakers and infrastructure developers. Companies in the Hypercharger Market are strengthening their competitive position by investing in next-generation high-power charging systems, expanding modular and scalable infrastructure solutions, and forming partnerships with automotive OEMs and utility providers. Many firms are focusing on improving charger uptime, enhancing software integration, and enabling smart-grid compatibility to optimize energy management. Geographic expansion into high-growth EV markets, combined with participation in government-funded infrastructure programs, is accelerating deployment. Businesses are also prioritizing interoperability standards and user-friendly digital platforms to improve customer experience.
Table of Contents
Chapter 1 Methodology
- 1.1 Research approach
- 1.2 Quality commitments
- 1.2.1 GMI AI policy & data integrity commitment
- 1.3 Research trail & confidence scoring
- 1.3.1 Research trail components
- 1.3.2 Scoring components
- 1.4 Data collection
- 1.4.1 Partial list of primary sources
- 1.5 Data mining sources
- 1.5.1 Paid sources
- 1.6 Base estimates and calculations
- 1.6.1 Base year calculation
- 1.7 Forecast model
- 1.8 Research transparency addendum
Chapter 2 Executive Summary
- 2.1 Industry 360° synopsis
- 2.2 Key market trends
- 2.2.1 Regional
- 2.2.2 Power Output
- 2.2.3 Vehicle
- 2.2.4 Connector
- 2.2.5 Application
- 2.2.6 Charging Location
- 2.3 TAM analysis, 2026-2035
- 2.4 CXO perspectives: Strategic imperatives
Chapter 3 Industry Insights
- 3.1 Industry ecosystem analysis
- 3.1.1 Supplier landscape
- 3.1.2 Profit margin
- 3.1.3 Cost structure
- 3.1.4 Value addition at each stage
- 3.1.5 Factor affecting the value chain
- 3.1.6 Disruptions
- 3.2 Industry impact forces
- 3.2.1 Growth drivers
- 3.2.1.1 Accelerating global electric vehicle (EV) adoption
- 3.2.1.2 Growing demand for reduced charging time and high-power infrastructure
- 3.2.1.3 Government incentives and national EV infrastructure programs
- 3.2.1.4 Expansion of highway and corridor-based fast charging networks
- 3.2.2 Industry pitfalls and challenges
- 3.2.2.1 Grid capacity constraints and power distribution limitations
- 3.2.2.2 High capital expenditure for installation and grid upgrades
- 3.2.3 Market opportunities
- 3.2.3.1 Integration with renewable energy and energy storage systems
- 3.2.3.2 Expansion in emerging EV markets
- 3.2.3.3 Public-private partnerships for infrastructure expansion
- 3.2.3.4 Increasing electrification of commercial and fleet vehicles
- 3.2.1 Growth drivers
- 3.3 Growth potential analysis
- 3.4 Regulatory landscape
- 3.4.1 North America
- 3.4.1.1 SAE J3400
- 3.4.1.2 J1772
- 3.4.1.3 NEVI Program Requirements
- 3.4.2 Europe
- 3.4.2.1 EU TEN-T Regulations
- 3.4.2.2 CCS Mandates
- 3.4.3 Asia Pacific
- 3.4.3.1 CHAdeMO 3.0
- 3.4.3.2 GB/T
- 3.4.3.3 Regional Incentives
- 3.4.4 Latin America
- 3.4.4.1 Brazil ANEEL EV Charging Regulatory Framework
- 3.4.4.2 Mexico EVSE Deployment Initiatives
- 3.4.5 Middle East & Africa
- 3.4.5.1 UAE National Electric Vehicle Policy
- 3.4.5.2 Dubai/Abu Dhabi EV Charging Network Regulations
- 3.4.1 North America
- 3.5 Investment & Funding Analysis
- 3.5.1 Public infrastructure investments (NEVI, EU Funding Programs)
- 3.5.2 Private equity & venture capital trends
- 3.5.3 OEM & energy company strategic investments
- 3.6 Porter’s analysis
- 3.7 PESTEL analysis
- 3.8 Technology and innovation landscape
- 3.8.1 Current technological trends
- 3.8.1.1 High Power DC Charging (350 kW+ Deployments)
- 3.8.1.2 Modular Power Architecture
- 3.8.1.3 Liquid-Cooled Charging Cables
- 3.8.1.4 Dynamic Load Management
- 3.8.2 Emerging technologies
- 3.8.2.1 Megawatt-Class Charging (MCS for Heavy Duty)
- 3.8.2.2 Vehicle-to-Grid (V2G) Integration
- 3.8.2.3 AI-Enabled Charging Optimization
- 3.8.2.4 Renewable-Integrated Charging Sites
- 3.8.1 Current technological trends
- 3.9 Pricing analysis (Driven by Primary Research)
- 3.9.1 Historical price trend analysis
- 3.9.2 Pricing strategy by player type (Premium / Value / Cost-plus)
- 3.10 Trade data analysis (Driven by Primary Research)
- 3.10.1 Import/export volume & value trends
- 3.10.2 Key trade corridors & tariff impact
- 3.11 Patent landscape (Driven by Primary Research)
- 3.12 Sustainability and environmental impact
- 3.12.1 Environmental impact assessment
- 3.12.2 Social impact & community benefits
- 3.12.3 Governance & corporate responsibility
- 3.12.4 Sustainable finance & investment trends
- 3.13 Impact of AI on the hypercharger market
- 3.13.1 AI-driven disruption of existing business models
- 3.13.2 GenAI use cases & adoption roadmap by segment
- 3.13.3 Risks, limitations & regulatory considerations
- 3.14 Integration of Renewable Energy
- 3.14.1 On site solar photovoltaic (PV) coupled with hyperchargers
- 3.14.2 Energy storage systems (ESS) with charging infrastructure
- 3.14.3 Microgrid architectures for remote charging hubs
- 3.14.4 Vehicle-to-grid (V2G) with renewable integration
- 3.14.5 Shared solar charging hubs for multi-use sites
- 3.15 Rapid expansion of ultra-fast charging networks
- 3.15.1 Highway corridor deployment strategies
- 3.15.2 Commercial and fleet-oriented ultra-fast hubs
- 3.15.3 Public-private partnerships (PPPs) and investment models
- 3.15.4 Technological standardization and interoperability
- 3.16 Case studies
- 3.17 Future outlook & opportunities
- 3.18 Forecast assumptions & scenario analysis (Driven by Primary Research)
- 3.18.1 Base Case - key macro & industry variables driving CAGR
- 3.18.2 Optimistic Scenarios - Favorable macro and industry tailwinds
- 3.18.3 Pessimistic Scenario - Macroeconomic slowdown or industry headwinds
Chapter 4 Competitive Landscape, 2025
- 4.1 Introduction
- 4.2 Company market share analysis
- 4.2.1 North America
- 4.2.2 Europe
- 4.2.3 Asia Pacific
- 4.2.4 LATAM
- 4.2.5 MEA
- 4.3 Competitive analysis of major market players
- 4.4 Competitive positioning matrix
- 4.5 Key developments
- 4.5.1 Mergers & acquisitions
- 4.5.2 Partnerships & collaborations
- 4.5.3 New product launches
- 4.5.4 Expansion plans and funding
Chapter 5 Market Estimates & Forecast, By Power Output, 2022 - 2035 ($Mn, Thousand Units)
- 5.1 Key trends
- 5.2 50-150 kW
- 5.3 150-350 kW
- 5.4 Above 350kW
Chapter 6 Market Estimates & Forecast, By Vehicle, 2022 - 2035 ($Mn, Thousand Units)
- 6.1 Key trends
- 6.2 Passenger cars
- 6.2.1 Hatchback
- 6.2.2 Sedan
- 6.2.3 SUV
- 6.3 Commercial vehicles
- 6.3.1 LCV
- 6.3.2 MCV
- 6.3.3 HCV
Chapter 7 Market Estimates & Forecast, By Connector, 2022 - 2035 ($Mn, Thousand Units)
- 7.1 Key trends
- 7.2 CCS (Combined Charging System)
- 7.3 CHAdeMO
- 7.4 GB/T
- 7.5 Others
Chapter 8 Market Estimates & Forecast, By Application, 2022 - 2035 ($Mn, Thousand Units)
- 8.1 Key trends
- 8.2 Public charging hubs
- 8.2.1 Highway corridors
- 8.2.2 Urban charging plazas
- 8.3 Fleet & commercial operations
- 8.4 Retail & convenience
- 8.4.1 Shopping centers & outlets
- 8.4.2 Service stations
Chapter 9 Market Estimates & Forecast, By Charging Location, 2022 - 2035 ($Mn, Thousand Units)
- 9.1 Key trends
- 9.2 Urban
- 9.3 Sub-Urban / highway corridors
Chapter 10 Market Estimates & Forecast, By Region, 2022 - 2035 ($Mn, Thousand Units)
- 10.1 Key trends
- 10.2 North America
- 10.2.1 US
- 10.2.2 Canada
- 10.3 Europe
- 10.3.1 Germany
- 10.3.2 UK
- 10.3.3 France
- 10.3.4 Italy
- 10.3.5 Spain
- 10.3.6 Belgium
- 10.3.7 Russia
- 10.3.8 Netherlands
- 10.4 Asia Pacific
- 10.4.1 China
- 10.4.2 India
- 10.4.3 Japan
- 10.4.4 South Korea
- 10.4.5 Australia
- 10.4.6 Singapore
- 10.4.7 Malaysia
- 10.4.8 Indonesia
- 10.4.9 Vietnam
- 10.4.10 Thailand
- 10.5 Latin America
- 10.5.1 Brazil
- 10.5.2 Mexico
- 10.5.3 Argentina
- 10.5.4 Colombia
- 10.6 MEA
- 10.6.1 South Africa
- 10.6.2 Saudi Arabia
- 10.6.3 UAE
Chapter 11 Company Profiles
- 11.1 Global players
- 11.1.1 ABB
- 11.1.2 Tesla
- 11.1.3 Siemens
- 11.1.4 ChargePoint
- 11.1.5 Tritium
- 11.1.6 Schneider Electric
- 11.1.7 Eaton
- 11.1.8 Blink Charging
- 11.1.9 Delta Electronics
- 11.1.10 Kempower
- 11.2 Regional players
- 11.2.1 EVgo Services
- 11.2.2 Electrify America
- 11.2.3 Alpitronic
- 11.2.4 StarCharge
- 11.2.5 Enel X Way
- 11.2.6 EVBox
- 11.3 Emerging players
- 11.3.1 Wallbox
- 11.3.2 ADS-TEC Energy
- 11.3.3 Compleo Charging
- 11.3.4 Allego
 汽车翻新涡轮增压器市场:按分销管道、车辆类型、翻新型号、最终用户和涡轮增压器类型划分-2026年至2032年全球市场预测
 2026年全球汽车涡轮增压器市场报告2026年全球汽车涡轮增压器软管市场报告2026年全球超级充电器市场报告超级充电器市场:2026-2032年全球市场预测(依输出功率、连接器类型、车辆类别、安装环境、充电模式和应用划分)工业涡轮增压器市场:按级数、类型、驱动系统、压力比、应用和销售管道划分-2026-2032年全球预测
 电动涡轮增压器市场:策略性洞察与预测(2026-2031年)非道路涡轮增压器市场:按类型、引擎功率、冷却技术、应用、最终用户划分,全球预测,2026-2032年工业柴油涡轮增压器市场:按级数、轴承类型、引擎排气量、销售管道、应用和最终用户产业划分-全球预测,2026-2032年2026-2034年全球汽车涡轮增压器市场规模、份额、趋势和成长分析报告