


 |
市场调查报告书
商品编码
1982376
热成像市场商机、成长要素、产业趋势分析及2026-2035年预测。Thermal Imaging Market Opportunity, Growth Drivers, Industry Trend Analysis, and Forecast 2026 - 2035 |
||||||
全球热感成像市场预计到 2025 年将价值 149 亿美元,预计到 2035 年将以 10.8% 的复合年增长率增长至 413 亿美元。
热感成像技术的工作原理是侦测物体发出的红外线辐射,并利用专用相机将这些热讯号转换成可见影像。由于该系统无需可见光即可运作,因此非常适合用于国防行动、边防安全、工业检测和医疗诊断,即使在完全黑暗、雾霾或烟雾瀰漫的环境下也能正常工作。在现代化专案和日益增长的安全需求的推动下,国防和工业领域对这些系统的应用不断增加,从而推动了市场扩张。技术的持续进步、政府对公共的投入以及工业自动化的发展,进一步加速了热感成像解决方案的普及。市场正受益于威胁侦测、监控、紧急应变和提升营运效率等各领域的应用。
| 市场范围 | |
|---|---|
| 开始年份 | 2025 |
| 预测期 | 2026-2035 |
| 上市时的市场规模 | 149亿美元 |
| 预计金额 | 413亿美元 |
| 复合年增长率 | 10.8% |
到2025年,手持式和可携式热感像仪将占据51.2%的市场。其便携性和易于部署的特点使其成为电气设备检测、暖通空调维护、消防和快速紧急应变等领域不可或缺的工具。最新的非冷冻感测器重量不足500克,解析度高达640x512,灵敏度达20mK,可在工业、公共和建筑评估等应用中实现对机壳的快速非接触式检测。
预计到2025年,政府和国防领域的市场规模将达到44亿美元,这主要得益于国防预算的成长、无人机和无人飞行器对紧凑型红外线系统的需求增加以及边防安全安全措施的加强。先进的冷却式中波红外线(MWIR)和长波红外线(LWIR)系统即使在黑暗和恶劣天气条件下也能实现远端目标捕获,而基于人工智慧的分析功能则有助于自主识别威胁。製造商正致力于开发功能强大、结构紧凑且具备人工智慧边缘分析能力的晶片,以优化其在空中平台和战术性部署中的应用。
预计2025年,美国热感成像市场规模将达38亿美元,主要驱动力包括国防现代化、公共投资增加以及工业自动化普及。在军事应用领域,冷却式和中波红外线技术因其精确的目标捕获和监视功能而备受青睐。民用应用则涵盖公共产业监控、汽车安全和医疗筛检等领域。稳定的政府资金投入和规范的采购流程为市场的持续成长提供了支撑,而国内製造则在系统整合和供应链连续性方面具有优势。
目录
第一章:调查方法和范围
第二章执行摘要
第三章业界考察
- 生态系分析
- 供应商情况
- 利润率
- 成本结构
- 每个阶段增加的价值
- 影响价值链的因素
- 中断
- 影响产业的因素
- 促进因素
- 扩大国防现代化计划
- 扩大边防安全和海上监视范围
- 无人机和无人飞行器威胁侦测
- 将夜视功能整合到自主系统中
- 公共和紧急应变需求
- 产业潜在风险与挑战
- 冷却式中波/长波红外线感知器高成本
- SWaP-C 在携带式应用中的局限性
- 市场机会
- 人工智慧热分析技术的广泛应用。
- 高光谱遥测和频谱融合
- 促进因素
- 成长潜力分析
- 监理情势
- 北美洲
- 欧洲
- 亚太地区
- 拉丁美洲
- 中东和非洲
- 波特的分析
- PESTEL 分析
- 科技与创新趋势
- 当前技术趋势
- 新兴技术
- 价格趋势
- 历史价格分析(2022-2024)
- 影响价格趋势的因素
- 各地区价格波动
- 价格预测(2026-2035)
- 定价策略
- 新兴经营模式
- 合规要求
- 专利分析
第四章 竞争情势
- 介绍
- 企业市占率分析
- 按地区
- 北美洲
- 欧洲
- 亚太地区
- 拉丁美洲
- 中东和非洲
- 市场集中度分析
- 按地区
- 主要企业的竞争标竿分析
- 财务绩效比较
- 销售量
- 利润率
- 研究与开发
- 产品系列比较
- 产品线
- 科技
- 创新
- 区域扩张比较
- 全球扩张分析
- 服务网路覆盖
- 按地区分類的市场渗透率
- 竞争定位矩阵
- 领导者
- 挑战者
- 追踪者
- 小众玩家
- 战略展望矩阵
- 财务绩效比较
- 2022-2025 年重大发展
- 併购
- 伙伴关係和联盟
- 技术进步
- 业务拓展与投资策略
- 永续发展倡议
- 数位转型计划
- 新兴/Start-Ups竞争对手的发展趋势
第五章:热成像市场估算与预测:依产品划分,2022-2035年
- 手持/可携式相机
- 固定/静止模型是主要类型。
- 瞄准镜和视力眼镜
第六章:热成像市场估算与预测:依技术划分,2022-2035年
- 冷却类型
- 非冷却型
第七章 市场估计与预测:依应用领域划分,2022-2035年
- 检测与测量
- 监测和检查
- 个人视觉系统
- 搜救
- 安全监控
- 其他的
第八章 市场估算与预测:依最终用途产业划分,2022-2035年
- 车
- 商业的
- 政府/国防
- 医学与生命科学
- 工业的
- 住宅
- 其他的
第九章:热成像市场估算与预测:按地区划分,2022-2035年
- 按地区
- 北美洲
- 我们
- 加拿大
- 欧洲
- 英国
- 德国
- 法国
- 义大利
- 西班牙
- 荷兰
- 其他欧洲地区
- 亚太地区
- 中国
- 印度
- 日本
- 韩国
- 澳洲
- 亚太其他地区
- 拉丁美洲
- 巴西
- 墨西哥
- 阿根廷
- 其他拉丁美洲地区
- 中东和非洲(MEA)
- 沙乌地阿拉伯
- 南非
- 阿拉伯聯合大公国
- 其他中东和非洲地区
第十章:公司简介
- 3M Scott
- Allied Vision
- American Technologies Network(ATN)Corp.
- Avon Protection Systems Inc.
- Axis Communications
- Bae Systems Imaging Solutions
- COX
- Dali Technology
- Draeger Safety Inc.
- FLIR Systems
- Fluke Corporation(Fortive subsidiary)
- General Starlight Company Inc.(GSCI)
- L3 Technologies
- Leonardo DRS
- Magnity Electronics
- Opgal Optronic Industries Limited
- Palmer Wahl Instrumentation Group
- Raytheon
- Seek Thermal
- Testo SE
- Thermoteknix Systems
- Tonbo Imaging
- ULIS(Sofradir subsidiary)
- Wuhan Guide Infrared Co., Ltd.
- Xenics NV
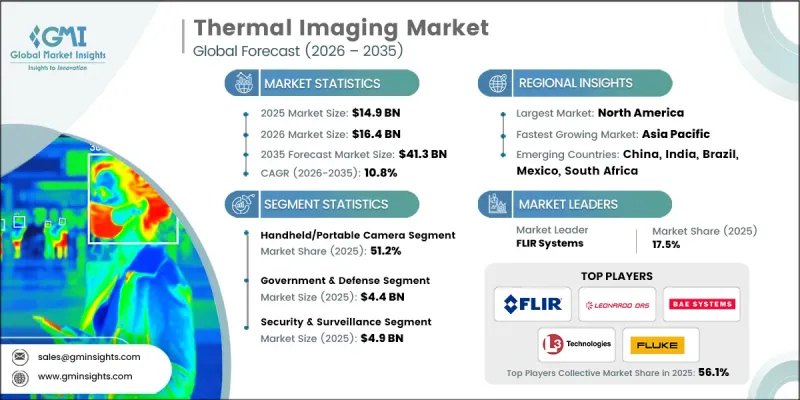
The Global Thermal Imaging Market was valued at USD 14.9 billion in 2025 and is estimated to grow at a CAGR of 10.8% to reach USD 41.3 billion by 2035.
Thermal imaging technology works by detecting infrared radiation emitted by objects and converting these heat signatures into visible images using specialized cameras. The system can operate without visible light, making it ideal for defense operations, border security, industrial inspections, and medical diagnostics in total darkness, fog, or smoke. The rising adoption of these systems across defense and industrial sectors, driven by modernization programs and increasing security demands, is fueling market expansion. Continuous technological advancements, government funding for public safety, and growing industrial automation are further accelerating the deployment of thermal imaging solutions. The market benefits from its applications in threat detection, surveillance, emergency response, and operational efficiency across diverse sectors.
| Market Scope | |
|---|---|
| Start Year | 2025 |
| Forecast Year | 2026-2035 |
| Start Value | $14.9 Billion |
| Forecast Value | $41.3 Billion |
| CAGR | 10.8% |
The handheld and portable thermal cameras segment held a 51.2% share in 2025. Their portability and ease of deployment make them essential for electrical inspections, HVAC maintenance, firefighting, and rapid emergency response. Modern uncooled sensors offer 640x512 resolution with 20mK sensitivity in compact packages under 500g, enabling quick, non-contact detection of hotspots in industrial, public safety, and building assessments.
The government and defense segment generated USD 4.4 billion in 2025, fueled by rising defense budgets, UAV and drone integrations requiring compact infrared systems, and border security initiatives. Advanced cooled MWIR and LWIR systems enable long-range targeting through darkness and adverse weather, while AI-based analytics support autonomous threat identification. Manufacturers focus on developing ruggedized, compact cores with AI edge analytics optimized for aerial platforms and tactical deployment.
U.S. Thermal Imaging Market was valued at USD 3.8 billion in 2025, driven by defense modernization, public safety funding, and industrial automation adoption. Military applications emphasize cooled and mid-wave infrared technologies for precise targeting and surveillance. Civilian use extends to utility monitoring, automotive safety, and healthcare screening. Stable government funding and organized procurement processes support sustained market expansion, while domestic manufacturing provides advantages in system integration and supply chain continuity.
Leading players in the Global Thermal Imaging Market include Raytheon, Seek Thermal, ULIS (Sofradir subsidiary), Draeger Safety Inc., Thermoteknix Systems, Palmer Wahl Instrumentation Group, 3M Scott, American Technologies Network (ATN) Corp., Bae Systems Imaging Solutions, Opgal Optronic Industries Limited, FLIR Systems, L3 Technologies, Axis Communications, Xenics NV, Tonbo Imaging, Leonardo DRS, Magnity Electronics, COX, Fluke Corporation (Fortive subsidiary), General Starlight Company Inc. (GSCI), Dali Technology, Avon Protection Systems Inc., and Wuhan Guide Infrared Co., Ltd. Companies in the Global Thermal Imaging Market are adopting strategies to strengthen their market position and expand global presence. They are investing heavily in research and development to enhance sensitivity, image resolution, and AI-driven analytics. Strategic partnerships, mergers, and acquisitions help penetrate new regional markets and broaden product offerings. Many firms focus on developing portable and ruggedized solutions for defense and industrial applications while enhancing manufacturing capabilities to improve supply chain efficiency.
Table of Contents
Chapter 1 Methodology and Scope
- 1.1 Market scope and definition
- 1.2 Research design
- 1.2.1 Research approach
- 1.2.2 Data collection methods
- 1.3 Data mining sources
- 1.3.1 Global
- 1.3.2 Regional/Country
- 1.4 Base estimates and calculations
- 1.4.1 Base year calculation
- 1.4.2 Key trends for market estimation
- 1.5 Primary research and validation
- 1.5.1 Primary sources
- 1.6 Forecast model
- 1.7 Research assumptions and limitations
Chapter 2 Executive Summary
- 2.1 Industry snapshot
- 2.2 Key market trends
- 2.2.1 Product trends
- 2.2.2 Technology trends
- 2.2.3 Application trends
- 2.2.4 End-user industry trends
- 2.2.5 Regional trends
- 2.3 TAM Analysis, 2025-2034 (USD Billion)
- 2.4 CXO perspectives: Strategic imperatives
- 2.4.1 Executive decision points
- 2.4.2 Critical success factors
- 2.5 Future outlook and strategic recommendations
Chapter 3 Industry Insights
- 3.1 Industry ecosystem analysis
- 3.1.1 Supplier Landscape
- 3.1.2 Profit Margin
- 3.1.3 Cost structure
- 3.1.4 Value addition at each stage
- 3.1.5 Factor affecting the value chain
- 3.1.6 Disruptions
- 3.2 Industry impact forces
- 3.2.1 Growth drivers
- 3.2.1.1 Rising Defense Modernization Programs
- 3.2.1.2 Border Security & Maritime Surveillance Expansion
- 3.2.1.3 Counter-Drone & UAV Threat Detection
- 3.2.1.4 Night Vision Integration in Autonomous Systems
- 3.2.1.5 Public Safety & First Responder Demand
- 3.2.2 Industry pitfalls and challenges
- 3.2.2.1 High Cost of Cooled MWIR/LWIR Sensors
- 3.2.2.2 SWaP-C Constraints in Portable Applications
- 3.2.3 Market opportunities
- 3.2.3.1 AI-Enhanced Thermal Analytics Proliferation
- 3.2.3.2 Hyperspectral & Multi-Spectral Fusion
- 3.2.1 Growth drivers
- 3.3 Growth potential analysis
- 3.4 Regulatory landscape
- 3.4.1 North America
- 3.4.2 Europe
- 3.4.3 Asia Pacific
- 3.4.4 Latin America
- 3.4.5 Middle East & Africa
- 3.5 Porter’s analysis
- 3.6 PESTEL analysis
- 3.7 Technology and innovation landscape
- 3.7.1 Current technological trends
- 3.7.2 Emerging technologies
- 3.8 Price trends
- 3.8.1 Historical price analysis (2022-2024)
- 3.8.2 Price trend drivers
- 3.8.3 Regional price variations
- 3.8.4 Price forecast (2026-2035)
- 3.9 Pricing strategies
- 3.10 Emerging business models
- 3.11 Compliance requirements
- 3.12 Patent analysis
Chapter 4 Competitive Landscape, 2025
- 4.1 Introduction
- 4.2 Company market share analysis
- 4.2.1 By Region
- 4.2.1.1 North America
- 4.2.1.2 Europe
- 4.2.1.3 Asia Pacific
- 4.2.1.4 Latin America
- 4.2.1.5 Middle East & Africa
- 4.2.2 Market Concentration Analysis
- 4.2.1 By Region
- 4.3 Competitive benchmarking of key players
- 4.3.1 Financial performance comparison
- 4.3.1.1 Revenue
- 4.3.1.2 Profit margin
- 4.3.1.3 R&D
- 4.3.2 Product portfolio comparison
- 4.3.2.1 Product range breadth
- 4.3.2.2 Technology
- 4.3.2.3 Innovation
- 4.3.3 Geographic presence comparison
- 4.3.3.1 Global footprint analysis
- 4.3.3.2 Service network coverage
- 4.3.3.3 Market penetration by region
- 4.3.4 Competitive positioning matrix
- 4.3.4.1 Leaders
- 4.3.4.2 Challengers
- 4.3.4.3 Followers
- 4.3.4.4 Niche players
- 4.3.5 Strategic outlook matrix
- 4.3.1 Financial performance comparison
- 4.4 Key developments, 2022-2025
- 4.4.1 Mergers and acquisitions
- 4.4.2 Partnerships and collaborations
- 4.4.3 Technological advancements
- 4.4.4 Expansion and investment strategies
- 4.4.5 Sustainability initiatives
- 4.4.6 Digital transformation initiatives
- 4.5 Emerging/ startup competitors landscape
Chapter 5 Thermal Imaging Market Estimates & Forecast, By Product, 2022 - 2035 (USD Million)
- 5.1 Key trends
- 5.2 Handheld/Portable camera
- 5.3 Fixed/Mounted Core
- 5.4 Scopes & Vision Googles
Chapter 6 Thermal Imaging Market Estimates & Forecast, By Technology, 2022 - 2035 (USD Million)
- 6.1 Key trends
- 6.2 Cooled
- 6.3 Uncooled
Chapter 7 Market Estimates and Forecast, By Application , 2022 - 2035 (USD Million)
- 7.1 Key trends
- 7.2 Detection & measurement
- 7.3 Monitoring & inspection
- 7.4 Personal vision systems
- 7.5 Search & rescue
- 7.6 Security & surveillance
- 7.7 Others
Chapter 8 Market Estimates and Forecast, By End-Use Industry, 2022 - 2035 (USD Million)
- 8.1 Key trends
- 8.2 Automotive
- 8.3 Commercial
- 8.4 Government & Defense
- 8.5 Healthcare & Life Sciences
- 8.6 Industrial
- 8.7 Residential
- 8.8 Others
Chapter 9 Thermal Imaging Market Estimates & Forecast, By Region, 2022 - 2035 (USD Million)
- 9.1 Key trends, by region
- 9.2 North America
- 9.2.1 U.S.
- 9.2.2 Canada
- 9.3 Europe
- 9.3.1 UK
- 9.3.2 Germany
- 9.3.3 France
- 9.3.4 Italy
- 9.3.5 Spain
- 9.3.6 Netherlands
- 9.3.7 Rest of Europe
- 9.4 Asia-Pacific
- 9.4.1 China
- 9.4.2 India
- 9.4.3 Japan
- 9.4.4 South Korea
- 9.4.5 Australia
- 9.4.6 Rest of Asia-Pacific
- 9.5 Latin America
- 9.5.1 Brazil
- 9.5.2 Mexico
- 9.5.3 Argentina
- 9.5.4 Rest of Latin America
- 9.6 MEA
- 9.6.1 Saudi Arabia
- 9.6.2 South Africa
- 9.6.3 UAE
- 9.6.4 Rest of MEA
Chapter 10 Company Profiles
- 10.1 3M Scott
- 10.2 Allied Vision
- 10.3 American Technologies Network (ATN) Corp.
- 10.4 Avon Protection Systems Inc.
- 10.5 Axis Communications
- 10.6 Bae Systems Imaging Solutions
- 10.7 COX
- 10.8 Dali Technology
- 10.9 Draeger Safety Inc.
- 10.10 FLIR Systems
- 10.11 Fluke Corporation (Fortive subsidiary)
- 10.12 General Starlight Company Inc. (GSCI)
- 10.13 L3 Technologies
- 10.14 Leonardo DRS
- 10.15 Magnity Electronics
- 10.16 Opgal Optronic Industries Limited
- 10.17 Palmer Wahl Instrumentation Group
- 10.18 Raytheon
- 10.19 Seek Thermal
- 10.20 Testo SE
- 10.21 Thermoteknix Systems
- 10.22 Tonbo Imaging
- 10.23 ULIS (Sofradir subsidiary)
- 10.24 Wuhan Guide Infrared Co., Ltd.
- 10.25 Xenics NV
 热成像市场:全球市场预测(按产品类型、技术、销售管道、最终用途和应用划分)- 2026-2032 年
 全球国防热成像模组(冷却型)市场:2026–2036携带式热感双筒望远镜市场:按技术、解析度、价格范围、应用、最终用户和分销管道划分,全球预测,2026-2032年低温中波热感市场:检测器材料、平台、解析度、影格速率、应用和最终用户成像器-全球预测,2026-2032年携带式测温热感成像器市场:依技术、价格范围、频谱范围、解析度、最终用途产业、应用类型和分销管道划分,全球预测(2026-2032年)
 热感成像市场分析及预测(至2035年):按类型、产品、服务、技术、组件、应用、设备、最终用户、功能及安装类型划分
 亚太地区热感成像系统:市场占有率分析、产业趋势与统计、成长预测(2026-2031)
 2026年全球热感成像市场报告
 军用热感成像市场-全球产业规模、份额、趋势、机会、预测:依技术类型、应用类型、最终用户类型、地区和竞争格局划分,2021-2031年热感成像市场-全球产业规模、份额、趋势、机会、预测:按类型、应用、技术、垂直市场、地区和竞争对手划分,2021-2031年