


 |
市场调查报告书
商品编码
1998745
光收发器市场机会、成长要素、产业趋势分析及2026-2035年预测。Optical Transceiver Market Opportunity, Growth Drivers, Industry Trend Analysis, and Forecast 2026 - 2035 |
||||||
全球光收发器市场预计到 2025 年价值 134 亿美元,预计到 2035 年将达到 481 亿美元,年复合成长率为 13.5%。
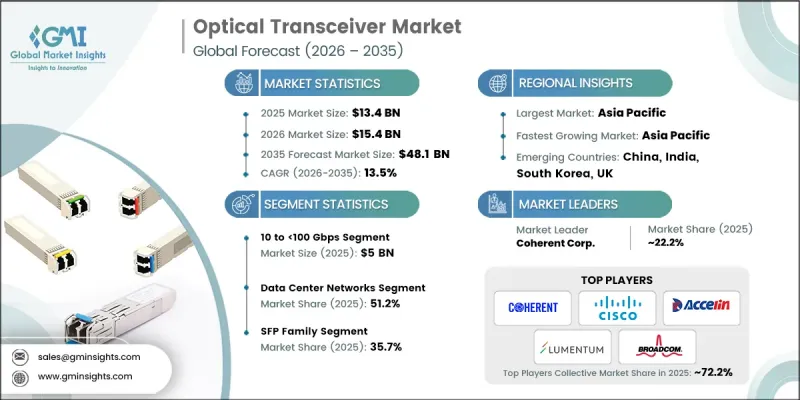
企业、云端和电信网路向高频宽数位基础设施的持续转型是推动市场成长的主要因素。通讯传输领域连贯的广泛应用、分散式边缘运算设施的扩展以及对高速互连以支援云端原生应用和内容传送平台日益增长的需求,都进一步刺激了市场需求。为实现 800G 和 1.6T 连接,超大规模资料中心的投资不断增加,加上海底光缆容量的扩展,正在增强全球资料传输能力。都会区网路的持续升级、DSP 效率的提高、端口密度交换器的普及以及基于标准的连贯光技术的应用,都在加速这一趋势的实施。最初由 2020 年前后 400ZR 插件模组标准化引发的解耦式连贯光技术发展趋势,预计将持续到 2030 年,从而促进供应商多元化和灵活的网路架构。
| 市场范围 | |
|---|---|
| 开始年份 | 2025 |
| 预测期 | 2026-2035 |
| 上市时的市场规模 | 134亿美元 |
| 预测金额 | 481亿美元 |
| 复合年增长率 | 13.5% |
由于10-100 Gbps频宽在企业、通讯聚合和行动接取网路的广泛应用,预计到2025年,该细分市场的规模将达到50亿美元。 10G、25G和50G频宽连结在全球范围内仍广泛部署,因此持续存在替换和升级需求。这些解决方案经济高效,并与现有交换基础设施保持高度相容性,从而维持了企业和通讯环境中的出货量。
预计到2025年,包括SFP+、SFP28和SFP56模组在内的SFP系列产品将占据35.7%的市场。其向下相容性、经济性和对1G至25G应用的适应性使其在企业网路、城域存取和传统资料中心广泛应用。宽频汇聚和企业交换领域的持续成长也确保了成熟市场和新兴市场对SFP系列产品的稳定需求。
预计到2025年,北美光收发器市占率将达到28.3%。这一成长主要得益于大规模超大规模资料中心的扩张、人工智慧基础设施的快速部署以及400G和800G互连技术的升级。北美拥有众多云端服务供应商,推动了对增强连贯传输网路和宽频骨干网路的持续投资。政府和通讯业者为提升海底光网路和城域网路基础设施所做的努力,进一步巩固了该地区的技术领先地位,这一趋势预计将持续到2035年。
目录
第一章:调查方法和范围
第二章执行摘要
第三章业界考察
- 生态系分析
- 供应商情况
- 利润率
- 成本结构
- 每个阶段增加的价值
- 影响价值链的因素
- 中断
- 影响产业的因素
- 促进因素
- 部署 800G 和 1.6T 超大规模资料中心
- 用于人工智慧/机器学习集群间互连的频宽扩展
- 海底电缆容量扩充计划
- 5G去程传输和中传中的高密度光纤。
- 共封装光学元件开发方面的倡议
- 产业潜在风险与挑战
- 高密度机架温度控管的复杂性
- 800G模组的高功耗
- 市场机会
- 硅光电整合技术的商业化
- 边缘资料中心的光纤通讯升级週期
- 促进因素
- 成长潜力分析
- 监理情势
- 北美洲
- 欧洲
- 亚太地区
- 拉丁美洲
- 中东和非洲
- 波特五力分析
- PESTEL 分析
- 科技与创新趋势
- 当前技术趋势
- 新兴技术
- 价格趋势
- 按地区
- 副产品
- 定价策略
- 新兴经营模式
- 合规要求
- 专利和智慧财产权分析
- 地缘政治和贸易趋势
第四章 竞争情势
- 介绍
- 企业市占率分析
- 按地区
- 北美洲
- 欧洲
- 亚太地区
- 拉丁美洲
- 中东和非洲
- 市场集中度分析
- 按地区
- 主要企业的竞争标竿分析
- 财务绩效比较
- 销售量
- 利润率
- 研究与开发
- 产品系列比较
- 产品线宽度
- 科技
- 创新
- 区域扩张比较
- 全球扩张分析
- 服务网路覆盖
- 按地区分類的市场渗透率
- 竞争定位矩阵
- 领导者
- 挑战者
- 追踪者
- 小众玩家
- 战略展望矩阵
- 财务绩效比较
- 主要进展
- 併购
- 伙伴关係与合作
- 技术进步
- 扩张和投资策略
- 数位转型计划
- 新兴竞争对手和Start-Ups竞争对手的发展趋势
第五章 市场估算与预测:依外型尺寸划分,2022-2035年
- SFP光束(SFP、SFP+、SFP28、SFP56、SFP112、SFP-DD)
- QSFP组(QSFP、QSFP+、QSFP28、QSFP56、QSFP-DD)
- OSFP
- CFP家族(CFP、CFP2、CFP4)
- XFP
- CXP
第六章 市场估计与预测:依资料传输速度划分,2022-2035年
- 小于 10 Gbps
- 10 至 100 Gbps
- 100-400 Gbps
- 400-800 Gbps
- 800 Gbps 或更高
第七章 市场估计与预测:依通讯协定,2022-2035年
- 乙太网路
- 光纤通道
- InfiniBand
- OTN(光纤传输网路)
- SONET/SDH
- PON(无源光纤网路)
- CPRI/eCPRI(通用公共无线电介面)
- PCIe 透过光纤传输
第八章 市场估算与预测:依采购管道划分,2022-2035年
- OEM捆绑采购
- 直接向製造商采购
- 第三方相容/售后市场采购
- 透过分销管道进行采购
- 透过系统整合商/承包解决方案进行采购
第九章 市场估算与预测:依部署环境划分,2022-2035年
- 资料中心网络
- 通讯/运营商网络
- 企业园区/区域网路
- 工业/OT网络
- 国防和军事网络
第十章 市场估价与预测:依连接器类型划分,2022-2035年
- LC(朗讯连接器)
- SC(用户连接器)
- MPO/MTP(多芯光纤推入/拉出)
- FC(套圈连接器)
- ST(直尖)
- RJ45(铜线介面)
第十一章 市场估价与预测:按地区划分,2022-2035年
- 北美洲
- 我们
- 加拿大
- 欧洲
- 德国
- 英国
- 法国
- 西班牙
- 义大利
- 俄罗斯
- 亚太地区
- 中国
- 印度
- 日本
- 澳洲
- 韩国
- 拉丁美洲
- 巴西
- 墨西哥
- 阿根廷
- 中东和非洲
- 南非
- 沙乌地阿拉伯
- 阿拉伯聯合大公国
第十二章:公司简介
- 主要企业
- Cisco Systems, Inc.
- Broadcom Inc.
- Coherent Corp.
- Lumentum Holdings Inc.
- Sumitomo Electric Industries, Ltd.
- 按地区分類的主要企业
- 北美洲
- Applied Optoelectronics, Inc.
- Molex, LLC
- 亚太地区
- Accelink Technologies Co., Ltd.
- Eoptolink Technology Inc., Ltd.
- Fujitsu Optical Components Limited
- Hisense Broadband
- Linktel Technologies Co., Ltd.
- Source Photonics, Inc.
- 欧洲
- Smiths Interconnect
- 北美洲
- 特殊玩家/干扰者
- ATOP Corporation
- ColorChip Ltd.
The Global Optical Transceiver Market was valued at USD 13.4 billion in 2025 and is estimated to grow at a CAGR of 13.5% to reach USD 48.1 billion by 2035.
The market growth is driven by the ongoing shift toward high-bandwidth digital infrastructure across enterprises, cloud, and telecom networks. Demand is fueled by the widespread deployment of coherent pluggables in telecom transport, the expansion of distributed edge computing facilities, and the rising need for high-speed interconnects to support cloud-native applications and content delivery platforms. Increasing investments in hyperscale data centers to implement 800G and 1.6T connectivity, combined with submarine cable capacity expansions, are enhancing global data transmission capabilities. Continued upgrades of metro networks, improved DSP efficiency, higher port-density switches, and adoption of standard-based coherent optics accelerate deployment. The trend toward disaggregated coherent optics, first catalyzed by 400ZR pluggable standardization around 2020, is expected to continue through 2030, promoting vendor diversification and flexible network architectures.
| Market Scope | |
|---|---|
| Start Year | 2025 |
| Forecast Year | 2026-2035 |
| Start Value | $13.4 Billion |
| Forecast Value | $48.1 Billion |
| CAGR | 13.5% |
The 10 to <100 Gbps segment reached USD 5 billion in 2025, due to its widespread presence across enterprise, telecom aggregation, and mobile access networks. Links in the 10G, 25G, and 50G range remain extensively deployed worldwide, resulting in consistent replacement and upgrade demand. These solutions are cost-effective and maintain high compatibility with existing switching infrastructure, sustaining shipment volumes in enterprise and telecom environments.
The SFP family segment held a 35.7% share in 2025, encompassing SFP+, SFP28, and SFP56 modules. Their backward compatibility, affordability, and suitability for 1G to 25G applications make them widely adopted across enterprise networks, metro access, and legacy data centers. Continued deployment in broadband aggregation and enterprise switching ensures steady demand across both mature and emerging markets.
North America Optical Transceiver Market accounted for 28.3% share in 2025. The region's growth is supported by large-scale hyperscale data center expansions, rapid AI infrastructure adoption, and upgrades to 400G and 800G interconnects. North America hosts a significant concentration of cloud service providers, driving sustained capital expenditure on coherent transport networks and broadband backbone enhancements. Government and operator initiatives to strengthen subsea and metro infrastructure further reinforce the region's technology leadership, expected to continue through 2035.
Prominent players in the Global Optical Transceiver Market include Accelink Technologies Co., Ltd., Eoptolink Technology Inc., Cisco Systems, Inc., Applied Optoelectronics, Inc., Coherent Corp. (formerly II-VI Incorporated), Fujitsu Optical Components Limited, Lumentum Holdings Inc., Molex, LLC, Sumitomo Electric Industries, Ltd., ATOP Corporation, ColorChip Ltd., Linktel Technologies Co., Ltd., Smiths Interconnect, Broadcom Inc., Hisense Broadband, and Source Photonics, Inc. Companies in the Optical Transceiver Market are strengthening their position by investing heavily in research and development to launch high-speed, energy-efficient, and scalable transceivers. Strategic partnerships with telecom operators, hyperscale cloud providers, and data center integrators enable faster adoption and market penetration. Firms are diversifying their portfolios to include coherent pluggables, high-bandwidth SFP modules, and disaggregated solutions to meet evolving network needs. Expansion of global manufacturing and logistics capabilities ensures timely delivery and scalability. Additionally, companies are focusing on standard compliance, interoperability testing, and collaborative ecosystem development to maintain credibility and expand their share in both mature and emerging markets.
Table of Contents
Chapter 1 Methodology and Scope
- 1.1 Market scope and definition
- 1.2 Research design
- 1.2.1 Research approach
- 1.2.2 Data collection methods
- 1.3 Data mining sources
- 1.3.1 Global
- 1.3.2 Regional/Country
- 1.4 Base estimates and calculations
- 1.4.1 Base year calculation
- 1.4.2 Key trends for market estimation
- 1.5 Primary research and validation
- 1.5.1 Primary sources
- 1.6 Forecast model
- 1.7 Research assumptions and limitations
Chapter 2 Executive Summary
- 2.1 Industry 360° synopsis, 2022 - 2035
- 2.2 Key market trends
- 2.2.1 Form factor trends
- 2.2.2 Data rate trends
- 2.2.3 Protocol trends
- 2.2.4 Deployment environment trends
- 2.2.5 Procurement channel trends
- 2.2.6 Connector type trends
- 2.2.7 Regional trends
- 2.3 TAM Analysis, 2026-2035
- 2.4 CXO perspectives: Strategic imperatives
- 2.4.1 Executive decision points
- 2.4.2 critical success factors
- 2.5 Future outlook and strategic recommendations
Chapter 3 Industry Insights
- 3.1 Industry ecosystem analysis
- 3.1.1 Supplier Landscape
- 3.1.2 Profit Margin
- 3.1.3 Cost structure
- 3.1.4 Value addition at each stage
- 3.1.5 Factor affecting the value chain
- 3.1.6 Disruptions
- 3.2 Industry impact forces
- 3.2.1 Growth drivers
- 3.2.1.1 800G and 1.6T hyperscale data center deployments
- 3.2.1.2 AI/ML cluster interconnect bandwidth expansion
- 3.2.1.3 Submarine cable capacity expansion projects
- 3.2.1.4 5G fronthaul and midhaul fiber densification
- 3.2.1.5 Co-packaged optics development initiatives
- 3.2.2 Industry pitfalls and challenges
- 3.2.2.1 Thermal management complexity in dense racks
- 3.2.2.2 High 800G module power consumption
- 3.2.3 Market opportunities
- 3.2.3.1 Silicon photonics integration commercialization
- 3.2.3.2 Edge data center optical upgrade cycles
- 3.2.1 Growth drivers
- 3.3 Growth potential analysis
- 3.4 Regulatory landscape
- 3.4.1 North America
- 3.4.2 Europe
- 3.4.3 Asia Pacific
- 3.4.4 Latin America
- 3.4.5 Middle East & Africa
- 3.5 Porter's analysis
- 3.6 PESTEL analysis
- 3.7 Technology and Innovation landscape
- 3.7.1 Current technological trends
- 3.7.2 Emerging technologies
- 3.8 Price trends
- 3.8.1 By region
- 3.8.2 By product
- 3.9 Pricing Strategies
- 3.10 Emerging Business Models
- 3.11 Compliance Requirements
- 3.12 Patent and IP analysis
- 3.13 Geopolitical and trade dynamics
Chapter 4 Competitive Landscape, 2025
- 4.1 Introduction
- 4.2 Company market share analysis
- 4.2.1 By region
- 4.2.1.1 North America
- 4.2.1.2 Europe
- 4.2.1.3 Asia Pacific
- 4.2.1.4 Latin America
- 4.2.1.5 Middle East & Africa
- 4.2.2 Market concentration analysis
- 4.2.1 By region
- 4.3 Competitive benchmarking of key players
- 4.3.1 Financial performance comparison
- 4.3.1.1 Revenue
- 4.3.1.2 Profit margin
- 4.3.1.3 R&D
- 4.3.2 Product portfolio comparison
- 4.3.2.1 Product range breadth
- 4.3.2.2 Technology
- 4.3.2.3 Innovation
- 4.3.3 Geographic presence comparison
- 4.3.3.1 Global footprint analysis
- 4.3.3.2 Service network coverage
- 4.3.3.3 Market penetration by region
- 4.3.4 Competitive positioning matrix
- 4.3.4.1 Leaders
- 4.3.4.2 Challengers
- 4.3.4.3 Followers
- 4.3.4.4 Niche players
- 4.3.5 Strategic outlook matrix
- 4.3.1 Financial performance comparison
- 4.4 Key developments
- 4.4.1 Mergers and acquisitions
- 4.4.2 Partnerships and collaborations
- 4.4.3 Technological advancements
- 4.4.4 Expansion and investment strategies
- 4.4.5 Digital transformation initiatives
- 4.5 Emerging/ startup competitors landscape
Chapter 5 Market Estimates and Forecast, By Form Factor, 2022 - 2035 (USD Million)
- 5.1 Key trends
- 5.2 SFP family (SFP, SFP+, SFP28, SFP56, SFP112, SFP-DD)
- 5.3 QSFP family (QSFP, QSFP+, QSFP28, QSFP56, QSFP-DD)
- 5.4 OSFP
- 5.5 CFP family (CFP, CFP2, CFP4)
- 5.6 XFP
- 5.7 CXP
Chapter 6 Market Estimates and Forecast, By Data Rate, 2022 - 2035 (USD Million)
- 6.1 Key trends
- 6.2 Less than 10 Gbps
- 6.3 10 to <100 Gbps
- 6.4 100 to <400 Gbps
- 6.5 400 to <800 Gbps
- 6.6 800 Gbps and above
Chapter 7 Market Estimates and Forecast, By Protocol, 2022 - 2035 (USD Million)
- 7.1 Key trends
- 7.2 Ethernet
- 7.3 Fibre channel
- 7.4 InfiniBand
- 7.5 OTN (optical transport network)
- 7.6 SONET/SDH
- 7.7 PON (passive optical network)
- 7.8 CPRI/eCPRI (common public radio interface)
- 7.9 PCIe over optical
Chapter 8 Market Estimates and Forecast, By Procurement Channel, 2022 - 2035 (USD Million)
- 8.1 Key trends
- 8.2 OEM-bundled procurement
- 8.3 Direct manufacturer procurement
- 8.4 Third-party compatible/aftermarket procurement
- 8.5 Distribution channel procurement
- 8.6 System integrator/turnkey solution procurement
Chapter 9 Market Estimates and Forecast, By Deployment Environment, 2022 - 2035 (USD Million)
- 9.1 Key trends
- 9.2 Data center networks
- 9.3 Telecom/carrier networks
- 9.4 Enterprise campus/LAN networks
- 9.5 Industrial/OT networks
- 9.6 Defense & military networks
Chapter 10 Market Estimates and Forecast, By Connector Type, 2022 - 2035 (USD Million)
- 10.1 Key trends
- 10.2 LC (lucent connector)
- 10.3 SC (subscriber connector)
- 10.4 MPO/MTP (multi-fiber push-on/pull)
- 10.5 FC (ferrule connector)
- 10.6 ST (straight tip)
- 10.7 RJ45 (copper interface)
Chapter 11 Market Estimates and Forecast, By Region, 2022 - 2035 (USD Million)
- 11.1 Key trends
- 11.2 North America
- 11.2.1 U.S.
- 11.2.2 Canada
- 11.3 Europe
- 11.3.1 Germany
- 11.3.2 UK
- 11.3.3 France
- 11.3.4 Spain
- 11.3.5 Italy
- 11.3.6 Russia
- 11.4 Asia Pacific
- 11.4.1 China
- 11.4.2 India
- 11.4.3 Japan
- 11.4.4 Australia
- 11.4.5 South Korea
- 11.5 Latin America
- 11.5.1 Brazil
- 11.5.2 Mexico
- 11.5.3 Argentina
- 11.6 Middle East and Africa
- 11.6.1 South Africa
- 11.6.2 Saudi Arabia
- 11.6.3 UAE
Chapter 12 Company Profiles
- 12.1 Global Key Players
- 12.1.1 Cisco Systems, Inc.
- 12.1.2 Broadcom Inc.
- 12.1.3 Coherent Corp.
- 12.1.4 Lumentum Holdings Inc.
- 12.1.5 Sumitomo Electric Industries, Ltd.
- 12.2 Regional key players
- 12.2.1 North America
- 12.2.1.1 Applied Optoelectronics, Inc.
- 12.2.1.2 Molex, LLC
- 12.2.2 Asia Pacific
- 12.2.2.1 Accelink Technologies Co., Ltd.
- 12.2.2.2 Eoptolink Technology Inc., Ltd.
- 12.2.2.3 Fujitsu Optical Components Limited
- 12.2.2.4 Hisense Broadband
- 12.2.2.5 Linktel Technologies Co., Ltd.
- 12.2.2.6 Source Photonics, Inc.
- 12.2.3 Europe
- 12.2.3.1 Smiths Interconnect
- 12.2.1 North America
- 12.3 Niche Players/Disruptors
- 12.3.1 ATOP Corporation
- 12.3.2 ColorChip Ltd.
 第三方光收发器市场:2026-2032年全球市场预测(依资料速率、外形尺寸、传输距离、连接器类型、应用程式和最终用户划分)光收发器市场:2026-2032年全球市场预测(依资料速率、外形规格、元件、光纤模式、波长、传输距离、连接器类型、通讯协定、安装环境和应用划分)
 光收发器市场分析及预测(至2035年):类型、产品、技术、组件、应用、形状、材料类型、最终用户、模组、功能
 2026年全球多模光收发器市场报告2026年全球光收发器市场报告
 光收发器市场:按光纤类型、波长、外形尺寸、连接器、应用、距离、资料速率、国家和地区划分-产业分析、市场规模、份额和预测(2025-2032年)
 光收发器市场规模、份额和趋势分析报告:按外形尺寸、数据速率、光纤类型、连接器、通讯协定、传输距离、波长、应用、地区和细分市场预测(2026-2033 年)
 全球5G光收发器市场规模、份额、趋势和成长分析报告(2026-2034年)全球光收发器市场规模、份额、趋势和成长分析报告(2026-2034年)
 2026-2034年光收发器市场按外形规格、光纤类型、资料速率、连接器类型、应用和地区划分