


 |
市场调查报告书
商品编码
1998764
骨质疏鬆症治疗市场:市场机会、成长要素、产业趋势分析及2026-2035年预测Osteoporosis Drugs Market Opportunity, Growth Drivers, Industry Trend Analysis, and Forecast 2026 - 2035 |
||||||
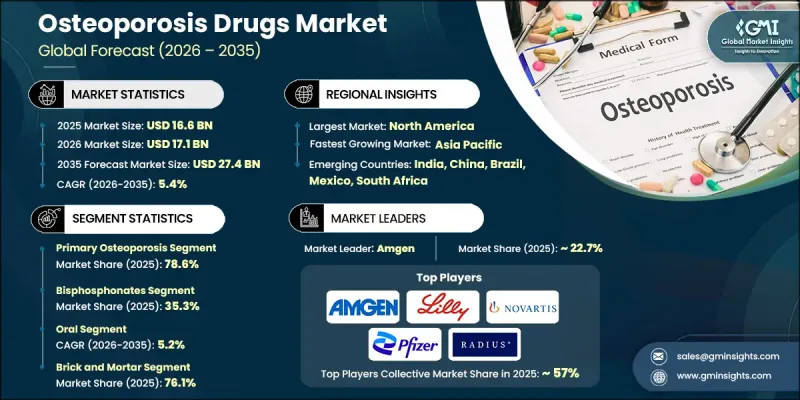
2025 年全球骨质疏鬆症治疗市场价值 166 亿美元,预计到 2035 年将以 5.4% 的复合年增长率增长至 274 亿美元。
骨质疏鬆症治疗市场的成长与人口结构变化密切相关,尤其是全球老年人口的持续成长。随着老龄化,骨骼强度逐渐下降,骨折和骨骼相关併发症的风险显着增加。旨在控制骨质疏鬆症的药物治疗在维持骨骼密度和最大限度降低骨折风险方面发挥着至关重要的作用。这些药物透过减缓骨骼分解过程或促进新骨形成来发挥作用,帮助患者长期维持骨骼强度。病人和医护人员对骨质疏鬆症的认识不断提高,也促进了诊断率的提升,尤其是在医疗体係日益重视骨质疏鬆症早期检测方面。诊断筛检技术的广泛应用有助于更早启动治疗,并增加参与长期治疗计画的患者人数。此外,旨在支持患者监测和治疗依从性的数位健康工具正逐渐成为骨质疏鬆症常规管理的一部分。这些技术有助于改善治疗效果,并帮助医护人员追踪长期治疗的有效性。
| 市场范围 | |
|---|---|
| 开始年份 | 2025 |
| 预测期 | 2026-2035 |
| 上市时的市场规模 | 166亿美元 |
| 预测金额 | 274亿美元 |
| 复合年增长率 | 5.4% |
预计到2025年,骨质疏鬆症主要细分市场将占据78.6%的市场份额,到2035年市场规模将达到220亿美元,年复合成长率(CAGR)为5.6%。由于骨骼密度老龄化增长而下降是全球骨质疏鬆症病例的主要原因,因此该细分市场需求强劲。随着许多国家预期寿命的延长,面临骨骼劣化风险的人数持续成长。这种人口趋势导致人们对长期药物干预以维持骨骼健康的需求不断增加。此外,诊断筛检技术的普及使医疗专业人员能够及早发现骨质流失,并在出现严重併发症之前启动治疗。早期发现疾病有助于更积极主动地进行疾病管理,从而导致接受骨质疏鬆症治疗的患者总数增加。
预计到2025年,口服药物市场规模将达到91亿美元,并在2026年至2035年间以5.2%的复合年增长率成长。口服製剂因其服用方便、易于透过多种医疗管道分销而广泛使用。已开发国家和开发中国家医疗体系的供应确保了市场需求的稳定和持续。由于口服骨质疏鬆症药物在维持骨骼健康和降低骨折相关併发症发生率方面具有确切的疗效,医疗专业人员仍继续开立此类药物。丰富的临床经验增强了医生对这些治疗方法的信心,并促进了其在全球的普及。
预计到2025年,美国骨质疏鬆症治疗市场规模将达57亿美元。骨质疏鬆症相关疾病在北美老龄化人口中仍然普遍存在,导致长期药物治疗的需求日益增长。预期寿命的延长使得需要持续进行骨骼健康管理的患者人数不断增加。加强宣传活动和医生主导的筛检计画也有助于提高早期发现率并推广预防性治疗方法。此外,先进的医疗基础设施和完善的诊断技术也持续全部区域有效的疾病管理提供支援。
目录
第一章:调查方法
- 研究途径
- 品质改进计划
- GMI人工智慧政策和资料完整性倡议
- 资讯来源一致性通讯协定
- GMI人工智慧政策和资料完整性倡议
- 调查过程和可靠性评分
- 调查过程的组成部分
- 评分组成部分
- 数据收集
- 主要来源部分列表
- 资料探勘资讯来源
- 付费资讯来源
- 区域资讯来源
- 付费资讯来源
- 基本估算和计算方法
- 每种方法中基准年的计算
- 预测模型
- 量化市场影响分析
- 生长参数对预测的数学影响
- 量化市场影响分析
- 关于调查透明度的补充信息
- 资讯来源归属框架
- 品质保证指标
- 对信任的承诺
第二章执行摘要
第三章业界考察
- 生态系分析
- 影响产业的因素
- 促进因素
- 骨质疏鬆症盛行率增加
- 药物研发中的技术进步
- 骨折发生率增加
- 生物製药和新型治疗方法的应用日益广泛
- 产业潜在风险与挑战
- 高昂的医疗费用
- 副作用和安全问题
- 市场机会
- 下一代合成代谢药物的研发
- 生物相似药和生技改良药的出现
- 促进因素
- 成长潜力分析
- 监理情势
- 北美洲
- 欧洲
- 亚太地区
- 科技趋势
- 当前技术趋势
- 新兴技术
- 救赎方案
- 未来市场趋势
- 管道分析
- 价值链分析
- 人工智慧和生成式人工智慧对市场的影响
- 波特五力分析
- PESTEL 分析
- Start-Ups场景
- 差距分析
第四章 竞争情势
- 介绍
- 企业矩阵分析
- 企业市占率分析
- 世界
- 北美洲
- 欧洲
- 亚太地区
- 竞争定位矩阵
- 主要市场公司的竞争分析
- 主要进展
- 併购
- 伙伴关係与合作
- 新产品发布
- 业务拓展计划
第五章 市场估计与预测:依类型划分,2022-2035年
- 原发性骨质疏鬆症
- 停经后骨质疏鬆症
- 老年性骨质疏鬆症
- 特发性骨质疏鬆症
- 续发性骨质疏鬆症
第六章 市场估计与预测:依药物类别划分,2022-2035年
- 双磷酸盐
- RANK配体抑制剂
- 副甲状腺素类似物
- 荷尔蒙补充疗法(HRT)
- 选择性雌激素受体调节(SERMs)
- 其他药物分类
第七章 市场估计与预测:依给药途径划分,2022-2035年
- 口服
- 注射药物
- 其他给药途径
第八章 市场估算与预测:依通路划分,2022-2035年
- 店铺
- 电子商务
第九章 市场估计与预测:依地区划分,2022-2035年
- 北美洲
- 我们
- 加拿大
- 欧洲
- 德国
- 英国
- 法国
- 西班牙
- 义大利
- 荷兰
- 亚太地区
- 中国
- 日本
- 印度
- 澳洲
- 韩国
- 拉丁美洲
- 巴西
- 墨西哥
- 阿根廷
- 中东和非洲
- 南非
- 沙乌地阿拉伯
- 阿拉伯聯合大公国
第十章:公司简介
- Amgen
- Apotex
- DAIICHI SANKYO COMPANY
- Dr. Reddy's Laboratories
- Eisai
- Eli Lilly and Company
- Merck &Co.
- Mylan
- Novartis
- Pfizer
- Radius Health
- Roche
- Sanofi
- Sun Pharmaceutical Industries
- Teva Pharmaceutical Industries
The Global Osteoporosis Drugs Market was valued at USD 16.6 billion in 2025 and is estimated to grow at a CAGR of 5.4% to reach USD 27.4 billion by 2035.
The growth of the osteoporosis drugs market is closely associated with demographic changes, particularly the steady expansion of the elderly population worldwide. As individuals age, bone strength gradually declines, which significantly increases the risk of fractures and bone-related complications. Pharmaceutical therapies designed to manage osteoporosis play an essential role in preserving bone density and minimizing fracture risk. These medications function by slowing the process of bone degradation or by stimulating new bone formation, helping patients maintain skeletal strength over time. Increased awareness among patients and healthcare providers has also contributed to improved diagnosis rates, particularly as healthcare systems emphasize early detection of bone loss conditions. The growing use of diagnostic screening technologies is encouraging earlier treatment initiation and expanding the number of patients entering long-term therapy programs. In addition, digital health tools designed to support patient monitoring and treatment adherence are gradually becoming part of routine osteoporosis management. These technologies contribute to better therapeutic outcomes and help healthcare providers track long-term treatment effectiveness.
| Market Scope | |
|---|---|
| Start Year | 2025 |
| Forecast Year | 2026-2035 |
| Start Value | $16.6 Billion |
| Forecast Value | $27.4 Billion |
| CAGR | 5.4% |
The primary osteoporosis segment held 78.6% share in 2025 and is expected to reach USD 22 billion by 2035 while growing at a CAGR of 5.6%. This segment maintains strong demand because bone density loss associated with aging represents the largest source of osteoporosis cases globally. As life expectancy increases across many countries, the number of individuals vulnerable to bone deterioration continues to grow. This demographic trend is generating sustained demand for long-term pharmaceutical interventions designed to preserve bone health. Expanding use of diagnostic screening technologies is also enabling healthcare professionals to detect bone loss at earlier stages, allowing treatment to begin before severe complications occur. Earlier identification of the condition is encouraging more proactive disease management and increasing the overall patient population receiving osteoporosis therapies.
The oral segment generated USD 9.1 billion in 2025 and is projected to grow at a CAGR of 5.2% throughout 2026-2035. Oral drug formulations remain widely used because they are convenient for patients and easily distributed through multiple healthcare channels. Their accessibility across both developed and developing healthcare systems ensures stable and consistent market demand. Healthcare professionals continue to prescribe oral osteoporosis medications due to their well-established therapeutic effectiveness in supporting bone health and lowering the likelihood of fracture-related complications. The extensive clinical history associated with oral treatments has strengthened physician confidence in these therapies and contributed to their continued adoption worldwide.
U.S. Osteoporosis Drugs Market reached USD 5.7 billion in 2025. Osteoporosis-related conditions remain common among the aging population in North America, contributing to the growing need for long-term pharmaceutical treatment. Rising life expectancy is expanding the number of patients who require continued management of bone health conditions. Increased awareness initiatives and physician-led screening programs have also improved early detection and encouraged the use of preventive treatment options. In addition, advanced healthcare infrastructure and strong availability of diagnostic technologies continue to support effective disease management across the region.
Prominent companies operating in the Global Osteoporosis Drugs Market include Amgen, Apotex, DAIICHI SANKYO COMPANY, Dr. Reddy's Laboratories, Eisai, Eli Lilly and Company, Merck & Co., Mylan, Novartis, Pfizer, Radius Health, Roche, Sanofi, Sun Pharmaceutical Industries, and Teva Pharmaceutical Industries. Companies competing in the Global Osteoporosis Drugs Market are strengthening their competitive position through a combination of product innovation, research investments, and strategic collaborations. Many pharmaceutical manufacturers are increasing funding for clinical research to develop next-generation therapies that improve treatment outcomes and support long-term bone health management. Organizations are also expanding their global distribution networks to increase product availability across emerging healthcare markets. Partnerships with healthcare providers and research institutions are helping companies accelerate drug development and improve patient access to therapies. Additionally, firms are focusing on digital health integration to support medication adherence and patient monitoring.
Table of Contents
Chapter 1 Research Methodology
- 1.1 Research approach
- 1.2 Quality commitments
- 1.2.1 GMI AI policy & data integrity commitment
- 1.2.1.1 Source consistency protocol
- 1.2.1 GMI AI policy & data integrity commitment
- 1.3 Research trail & confidence scoring
- 1.3.1 Research trail components
- 1.3.2 Scoring components
- 1.4 Data collection
- 1.4.1 Partial list of primary sources
- 1.5 Data mining sources
- 1.5.1 Paid sources
- 1.5.1.1 Sources, by region
- 1.5.1 Paid sources
- 1.6 Base estimates and calculations
- 1.6.1 Base year calculation for any one approach
- 1.7 Forecast model
- 1.7.1 Quantified market impact analysis
- 1.7.1.1 Mathematical impact of growth parameters on forecast
- 1.7.1 Quantified market impact analysis
- 1.8 Research transparency addendum
- 1.8.1 Source attribution framework
- 1.8.2 Quality assurance metrics
- 1.8.3 Our commitment to trust
Chapter 2 Executive Summary
- 2.1 Industry 3600 synopsis
- 2.2 Key market trends
- 2.2.1 Regional trends
- 2.2.2 Type trends
- 2.2.3 Drug class trends
- 2.2.4 Route of administration trends
- 2.2.5 Distribution channel trends
- 2.3 CXO perspectives: Strategic imperatives
Chapter 3 Industry Insights
- 3.1 Industry ecosystem analysis
- 3.2 Industry impact forces
- 3.2.1 Growth drivers
- 3.2.1.1 Increasing prevalence of osteoporosis
- 3.2.1.2 Technological advancements in drug development
- 3.2.1.3 Rising incidence of fractures
- 3.2.1.4 Growth in biologic and novel therapeutic adoption
- 3.2.2 Industry pitfalls and challenges
- 3.2.2.1 High cost of treatment
- 3.2.2.2 Side effects and safety concerns
- 3.2.3 Market opportunities
- 3.2.3.1 Development of next-generation anabolic agents
- 3.2.3.2 Biosimilar and biobetter entry
- 3.2.1 Growth drivers
- 3.3 Growth potential analysis
- 3.4 Regulatory landscape
- 3.4.1 North America
- 3.4.2 Europe
- 3.4.3 Asia Pacific
- 3.5 Technology landscape
- 3.5.1 Current technological trends
- 3.5.2 Emerging technologies
- 3.6 Reimbursement scenario
- 3.7 Future market trends
- 3.8 Pipeline analysis
- 3.9 Value chain analysis
- 3.10 Impact of AI and generative AI on the market
- 3.11 Porter's analysis
- 3.12 PESTEL analysis
- 3.13 Start-up scenarios
- 3.14 Gap analysis
Chapter 4 Competitive Landscape, 2025
- 4.1 Introduction
- 4.2 Company matrix analysis
- 4.3 Company market share analysis
- 4.3.1 Global
- 4.3.2 North America
- 4.3.3 Europe
- 4.3.4 Asia Pacific
- 4.4 Competitive positioning matrix
- 4.5 Competitive analysis of major market players
- 4.6 Key developments
- 4.6.1 Mergers & acquisitions
- 4.6.2 Partnerships & collaborations
- 4.6.3 New product launches
- 4.6.4 Expansion plans
Chapter 5 Market Estimates and Forecast, By Type, 2022 - 2035 ($ Mn)
- 5.1 Key trends
- 5.2 Primary osteoporosis
- 5.2.1 Postmenopausal osteoporosis
- 5.2.2 Senile osteoporosis
- 5.2.3 Idiopathic osteoporosis
- 5.3 Secondary osteoporosis
Chapter 6 Market Estimates and Forecast, By Drug Class, 2022 - 2035 ($ Mn)
- 6.1 Key trends
- 6.2 Bisphosphonates
- 6.3 RANK ligand inhibitors
- 6.4 Parathyroid hormone analogs
- 6.5 Hormone replacement therapy (HRT)
- 6.6 Selective estrogen receptor modulators (SERMs)
- 6.7 Other drug classes
Chapter 7 Market Estimates and Forecast, By Route of Administration, 2022 - 2035 ($ Mn)
- 7.1 Key trends
- 7.2 Oral
- 7.3 Injectable
- 7.4 Other route of administrations
Chapter 8 Market Estimates and Forecast, By Distribution Channel, 2022 - 2035 ($ Mn)
- 8.1 Key trends
- 8.2 Brick and mortar
- 8.3 E-commerce
Chapter 9 Market Estimates and Forecast, By Region, 2022 - 2035 ($ Mn)
- 9.1 Key trends
- 9.2 North America
- 9.2.1 U.S.
- 9.2.2 Canada
- 9.3 Europe
- 9.3.1 Germany
- 9.3.2 UK
- 9.3.3 France
- 9.3.4 Spain
- 9.3.5 Italy
- 9.3.6 Netherlands
- 9.4 Asia Pacific
- 9.4.1 China
- 9.4.2 Japan
- 9.4.3 India
- 9.4.4 Australia
- 9.4.5 South Korea
- 9.5 Latin America
- 9.5.1 Brazil
- 9.5.2 Mexico
- 9.5.3 Argentina
- 9.6 Middle East and Africa
- 9.6.1 South Africa
- 9.6.2 Saudi Arabia
- 9.6.3 UAE
Chapter 10 Company Profiles
- 10.1 Amgen
- 10.2 Apotex
- 10.3 DAIICHI SANKYO COMPANY
- 10.4 Dr. Reddy’s Laboratories
- 10.5 Eisai
- 10.6 Eli Lilly and Company
- 10.7 Merck & Co.
- 10.8 Mylan
- 10.9 Novartis
- 10.10 Pfizer
- 10.11 Radius Health
- 10.12 Roche
- 10.13 Sanofi
- 10.14 Sun Pharmaceutical Industries
- 10.15 Teva Pharmaceutical Industries
 骨质疏鬆症药物市场规模、份额和成长分析(按药物类别、给药途径、适应症和地区划分)-2026-2033年产业预测
 骨质疏鬆症治疗市场
 2025-2033年骨质疏鬆症药物市场报告(依产品类型、给药途径及地区)
 骨质疏鬆症药物市场-全球产业规模、份额、趋势、机会和预测(按给药途径、药物类型、地区和竞争细分,2020-2030 年)
 全球停经后骨质疏鬆症治疗市场:市场规模、份额和趋势分析(按药物类别、类型、分销管道和地区),按细分市场预测(2025-2030 年)骨质疏鬆症药物市场规模、份额、趋势分析报告:按药物类别、类型、分销管道、地区和细分市场预测,2025 年至 2030 年
 2032 年骨质疏鬆症药物市场预测:按药物类别、给药途径、分销管道、最终用户和地区进行的全球分析抗骨质疏鬆治疗和骨折癒合市场 - 全球产业规模、份额、趋势、机会和预测,按药物类型、给药途径、配销通路、地区和竞争细分,2020-2030 年预测
 骨质疏鬆症治疗市场:依药物类型、给药途径、通路及地区划分
 全球骨质疏鬆症治疗市场评估:依药物类型、药物类别、给药途径、通路、地区、机会、预测(2017-2031)