


 |
市场调查报告书
商品编码
1998777
可携式投影机市场机会、成长要素、产业趋势分析及2026-2035年预测Portable Projector Market Opportunity, Growth Drivers, Industry Trend Analysis, and Forecast 2026 - 2035 |
||||||
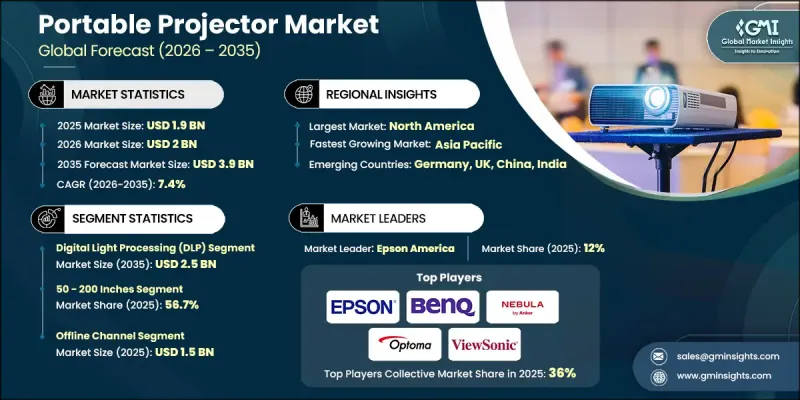
全球可携式投影机市场预计到 2025 年将价值 19 亿美元,预计到 2035 年将以 7.4% 的复合年增长率增长至 39 亿美元。
随着数位化学习和灵活演示技术在各个领域的广泛应用,全球可携式投影机产业正经历着稳定成长。教育机构越来越多地在教室部署可携式显示器解决方案,以支援互动式和协作式学习环境。随着人们对数位教育工具的兴趣日益浓厚,学校、大学和培训机构都在推广使用便于携带且可安装在各种教育环境中的紧凑型投影设备。支持教育领域数位转型的公共措施也促进了对可携式投影机的需求成长。除了教育领域,企业和组织也将可携式投影机应用于专业培训专案、研讨会和内部学习课程。这些设备使主讲人能够在各种环境中有效地呈现视觉内容,而无需进行永久性安装。投影系统的技术进步进一步推动了市场扩张,尤其是在消费者对更高解析度显示器和更高视觉清晰度的需求不断增长的情况下。随着用户对高品质观看体验的日益重视,能够提供更清晰影像和更高色彩准确度的先进影像技术的需求也日益增长。随着可携式娱乐系统和灵活工作模式的日益普及,可携式投影机预计将继续在全球可携式投影机市场中扮演重要角色,无论是在商用还是个人领域。
| 市场范围 | |
|---|---|
| 开始年份 | 2025 |
| 预测期 | 2026-2035 |
| 上市时的市场规模 | 19亿美元 |
| 预测金额 | 39亿美元 |
| 复合年增长率 | 7.4% |
数位光处理 (DLP) 投影机市场预计在 2025 年达到 12 亿美元,到 2035 年将达到 25 亿美元。凭藉其卓越的性能和紧凑的设计,DLP 技术在可携式投影机市场持续占据重要份额。采用此技术的投影机以其高对比度和快速的影像反应时间而广受认可,从而能够输出更清晰的影像。其紧凑的结构和轻巧的设计使其对追求高便携性的用户极具吸引力,方便用户随时随地携带。这些优势推动了 DLP 投影机在商用和个人中的广泛应用。此外,该技术支援高品质的图像再现,因此也深受寻求可靠影像性能以进行演示和娱乐应用的消费者的青睐。
到2025年,50-200吋投影机将占据56.7%的市场。中等尺寸的投影机因其在显示尺寸和便携性之间取得的实用平衡而备受消费者青睐。这些投影机保持了紧凑的外形规格,便于运输和安装,同时又能提供足够大的萤幕尺寸,带来沉浸式的观看体验。它们的柔软性使其对住宅和商用用户都极具吸引力,因为它们可以在各种环境中使用。许多消费者正在将这一尺寸范围的投影机纳入其个人娱乐系统,从而推动了产品需求的成长。此外,中等尺寸投影系统的多功能性也促使它们在需要灵活显示解决方案的各种环境中得到应用。
预计到2025年,美国可携式投影机市场份额将达到82.5%。美国可携式投影机产业受益于其强大的技术应用文化和对数位基础设施的持续投入。全国范围内为学习环境现代化和采用先进教育技术所做的努力,正在推动可携式投影系统在教育机构中的应用。网路连接的改善和数位学习平台的扩展也促进了可携式显示设备的普及。此外,混合办公室模式的兴起和数位协作工具的增加,也为可携式投影技术在工作场所的应用创造了新的机会。数位基础设施的改善使得线上内容的存取更加便捷,进一步促进了可携式投影机在教育机构和职场的应用。
目录
第一章:调查方法和范围
第二章执行摘要
第三章业界考察
- 生态系分析
- 供应商情况
- 利润率
- 每个阶段增加的价值
- 影响价值链的因素
- 影响产业的因素
- 促进因素
- 教育领域的数位化
- 可支配所得增加
- 线上市场的兴起
- 产业潜在风险与挑战
- 其他投影萤幕方案及已安装投影机的可用性
- 亮度和影像品质限制
- 机会
- 家庭娱乐和混合办公的需求日益增长。
- 智慧/物联网和人工智慧主导能力的集成
- 促进因素
- 成长潜力分析
- 未来市场趋势
- 科技与创新趋势
- 当前技术趋势
- 新兴技术
- 价格趋势
- 按类型
- 按地区
- 监理情势
- 北美洲
- 美国:消费品安全委员会(CPSC)联邦法规(CFR)第16篇第1512节
- 加拿大:国际标准化组织(ISO)4210
- 欧洲
- 德国:德国标准化协会 (DIN)、欧洲标准 (EN)、ISO 4210
- 英国:欧洲标准 (EN) ISO 4210 /英国合格评定 (UKCA)
- 法国:欧洲标准 (EN) ISO 4210
- 亚太地区
- 中国:国家标誌(GB)3565
- 印度:印度标准 (IS) 10613
- 日本:日本工业标准(JIS)D 9110
- 拉丁美洲
- 巴西:巴西技术标准协会 (ABNT)、巴西标准局 (NBR)、ISO 4210
- 墨西哥:国际标准化组织(ISO)4210
- 中东和非洲
- 南非:南非国家标准 (SANS) 311
- 沙乌地阿拉伯:沙乌地阿拉伯标准、计量和品质组织 (SASO)、海湾标准化组织 (GSO)、ISO 4210
- 北美洲
- 贸易数据分析
- 进出口数量和价值的变化趋势
- 主要贸易路线及关税的影响
- 人工智慧和生成式人工智慧对市场的影响
- 利用人工智慧改造现有经营模式
- Genai 各细分市场的应用案例与实施蓝图
- 风险、限制和监管考量
- 波特五力分析
- PESTEL 分析
- 消费行为分析
- 购买模式
- 偏好分析
- 消费行为的区域差异
- 电子商务对购买决策的影响
第四章 竞争情势
- 介绍
- 企业市占率分析
- 按地区
- 企业矩阵分析
- 主要市场公司的竞争分析
- 竞争定位矩阵
- 主要进展
- 併购
- 伙伴关係与合作
- 新产品发布
- 业务拓展计划
第五章 市场估计与预测:依技术划分,2022-2035年
- 数位光处理(DLP)
- 液晶显示器(LCD)
- 硅基液晶显示器(LOCOS)
- 其他的
第六章 市场估价与预测:依投影萤幕尺寸划分,2022-2035年
- 小于50英寸
- 50-200英寸
- 超过200英寸
第七章 市场估计与预测:以连结方式划分,2022-2035年
- 有线
- 无线的
第八章 市场估算与预测:依最终用途划分,2022-2035年
- 家庭娱乐
- 教育机构
- 商业专业人士
- 游戏
- 活动主办者
- 媒体製作/内容製作公司
- 其他设施(休息室、俱乐部、运动中心等)
第九章 市场估价与预测:依通路划分,2022-2035年
- 在线的
- 电子商务
- 企业网站
- 离线
- 专卖店
- 大型零售商店
- 其他的
第十章 市场估价与预测:依地区划分,2022-2035年
- 北美洲
- 我们
- 加拿大
- 欧洲
- 德国
- 法国
- 英国
- 义大利
- 西班牙
- 亚太地区
- 中国
- 印度
- 日本
- 韩国
- 澳洲
- 拉丁美洲
- 巴西
- 墨西哥
- 阿根廷
- 中东和非洲(MEA)
- 南非
- 沙乌地阿拉伯
- 阿拉伯聯合大公国
第十一章:公司简介
- AAXA Technologies
- Acer
- Anker(Nebula)
- ASUS
- BenQ
- Epson America
- JMGO
- LG Electronics
- Optoma
- Philips
- Samsung
- Sony
- ViewSonic
- Xiaomi
- XGIMI
The Global Portable Projector Market was valued at USD 1.9 billion in 2025 and is estimated to grow at a CAGR of 7.4% to reach USD 3.9 billion by 2035.
The global portable projector industry is witnessing steady growth as digital learning and flexible presentation technologies become more widely adopted across multiple sectors. Educational institutions are increasingly integrating portable display solutions into classrooms to support interactive and collaborative learning environments. The growing emphasis on digital education tools is encouraging schools, universities, and training institutions to adopt compact projection devices that can be easily transported and deployed in different teaching spaces. Public initiatives supporting digital transformation in education are also contributing to the rising demand for portable projectors. Beyond the education sector, businesses and organizations are incorporating portable projection devices into professional training programs, workshops, and corporate learning sessions. These devices allow presenters to deliver visual content efficiently in a variety of environments without requiring permanent installations. Technological improvements in projection systems are further supporting market expansion, particularly as consumers seek higher resolution displays and enhanced visual clarity. Demand for advanced imaging technologies capable of delivering sharper images and improved color accuracy is increasing as users prioritize high-quality viewing experiences. As portable entertainment systems and flexible work environments become more common, portable projectors are expected to remain an important tool for both professional and personal use across the global portable projector market.
| Market Scope | |
|---|---|
| Start Year | 2025 |
| Forecast Year | 2026-2035 |
| Start Value | $1.9 Billion |
| Forecast Value | $3.9 Billion |
| CAGR | 7.4% |
The digital light processing (DLP) segment generated USD 1.2 billion in 2025 and is expected to reach USD 2.5 billion by 2035. DLP technology continues to represent a significant portion of the portable projector market due to its strong performance capabilities and compact design. Projectors based on this technology are widely recognized for delivering high contrast ratios and fast image response times, which contribute to clearer visual output. Their compact structure and lightweight construction make them particularly attractive for users who require highly portable devices that can be transported easily between locations. These advantages have strengthened the adoption of DLP projectors across professional and personal use cases. The technology also supports high-quality image rendering, which appeals to consumers seeking reliable visual performance for presentations and entertainment applications.
The 50-200 inches segment held 56.7% share in 2025. Mid-range projection sizes remain highly popular among consumers because they offer a practical balance between display size and device portability. These projectors provide sufficient screen dimensions for immersive viewing experiences while still maintaining compact form factors that allow convenient transport and setup. Their flexibility allows them to be used across a variety of settings, making them appealing to both residential and professional users. Many consumers are adopting projectors within this size range as part of their personal entertainment setups, contributing to increased product demand. The versatility of mid-size projection systems also supports their use in different environments where adaptable display solutions are required.
United States Portable Projector Market accounted for 82.5% share in 2025. The US portable projector industry benefits from a strong technology adoption culture and ongoing investment in digital infrastructure. Nationwide efforts to modernize learning environments and incorporate advanced educational technologies are encouraging the use of portable projection systems in academic institutions. Increased connectivity and expanding digital learning platforms are also supporting the broader adoption of portable display devices. In addition, the growing prevalence of hybrid work arrangements and digital collaboration tools has created new opportunities for portable projection technologies across professional environments. Improvements in digital infrastructure have enabled greater access to online content, which further supports the use of portable projectors for both educational and workplace applications.
Major companies operating in the Global Portable Projector Market include AAXA Technologies, Acer, Anker (Nebula), ASUS, BenQ, Epson America, JMGO, LG Electronics, Optoma, Philips, Samsung, Sony, ViewSonic, Xiaomi, and XGIMI. Companies active in the Portable Projector Market are implementing several strategic initiatives to strengthen their competitive position and expand their market presence. Product innovation remains a central focus, with manufacturers investing in advanced display technologies that improve resolution, brightness, and overall image performance. Many companies are also developing compact designs that enhance portability while maintaining high visual quality. Strategic partnerships with technology distributors and retail networks help manufacturers increase product accessibility across global markets. In addition, companies are expanding their smart projector portfolios by integrating wireless connectivity, streaming capabilities, and mobile device compatibility. Continuous investment in research and development supports the introduction of improved projection systems that meet evolving consumer expectations.
Table of Contents
Chapter 1 Methodology & Scope
- 1.1 Market scope & definitions
- 1.2 Research design
- 1.2.1 Research approach
- 1.2.2 Data collection methods
- 1.3 Base estimates and calculations
- 1.3.1 Base year calculation
- 1.3.2 Market estimates & forecasts parameters
- 1.4 Forecast Model
- 1.4.1 Key trends for market estimates
- 1.4.2 Quantified market impact analysis
- 1.4.2.1 Mathematical impact of growth parameters on forecast
- 1.4.3 Scenario analysis framework
- 1.5 Primary research and validation
- 1.5.1 Some of the primary sources (but not limited to)
- 1.6 Data mining sources
- 1.6.1 Paid Sources
- 1.7 Primary research and validation
- 1.7.1 Primary sources
- 1.8 Research Trail & confidence scoring
- 1.8.1 Research trail components
- 1.8.2 Scoring components
- 1.9 Research transparency addendum
- 1.9.1 Source attribution framework
- 1.9.2 Quality assurance metrics
- 1.9.3 Our commitment to trust
- 1.10 Market Definitions
Chapter 2 Executive Summary
- 2.1 Industry 360° synopsis
- 2.2 Key market trends
- 2.2.1 Regional
- 2.2.2 Technology
- 2.2.3 Projector screen size
- 2.2.4 Connectivity
- 2.2.5 End use
- 2.2.6 Distribution channel
- 2.3 CXO perspectives: Strategic imperatives
- 2.3.1 Key decision points for industry executives
- 2.3.2 Critical success factors for market players
- 2.4 Future outlook and strategic recommendations
Chapter 3 Industry Insights
- 3.1 Industry ecosystem analysis
- 3.1.1 Supplier landscape
- 3.1.2 Profit margin
- 3.1.3 Value addition at each stage
- 3.1.4 Factor affecting the value chain
- 3.2 Industry impact forces
- 3.2.1 Growth drivers
- 3.2.1.1 Digitalization in education sector
- 3.2.1.2 Growing disposable income
- 3.2.1.3 Rise of online marketplaces
- 3.2.2 Industry pitfalls & challenges
- 3.2.2.1 Availability of alternative screen projection options and installed projectors
- 3.2.2.2 Brightness and image quality limitations
- 3.2.3 Opportunities
- 3.2.3.1 Rising demand across home entertainment & hybrid work
- 3.2.3.2 Integration of smart / IoT & AI-driven capabilities
- 3.2.1 Growth drivers
- 3.3 Growth potential analysis
- 3.4 Future market trends
- 3.5 Technology and innovation landscape
- 3.5.1 Current technological trends
- 3.5.2 Emerging technologies
- 3.6 Price trends
- 3.6.1 By type
- 3.6.2 By region
- 3.7 Regulatory landscape
- 3.7.1 North America
- 3.7.1.1 US: Consumer Product Safety Commission (CPSC) 16 Code of Federal Regulations (CFR) part 1512
- 3.7.1.2 Canada: International Organization for Standardization (ISO) 4210
- 3.7.2 Europe
- 3.7.2.1 Germany: Deutsches Institut fur Normung (DIN) European Norm (EN) ISO 4210
- 3.7.2.2 UK: European Norm (EN) ISO 4210 / United Kingdom Conformity Assessed (UKCA)
- 3.7.2.3 France: European Norm (EN) ISO 4210
- 3.7.3 Asia Pacific
- 3.7.3.1 China: Guobiao (GB) 3565
- 3.7.3.2 India: Indian Standard (IS) 10613
- 3.7.3.3 Japan: Japanese Industrial Standard (JIS) D 9110
- 3.7.4 Latin America
- 3.7.4.1 Brazil: Associacao Brasileira de Normas Tecnicas (ABNT) Norma Brasileira (NBR) ISO 4210
- 3.7.4.2 Mexico: International Organization for Standardization (ISO) 4210
- 3.7.5 Middle East & Africa
- 3.7.5.1 South Africa: South African National Standard (SANS) 311
- 3.7.5.2 Saudi Arabia: Saudi Standards, Metrology and Quality Organization (SASO) Gulf Standardization Organization (GSO) ISO 4210
- 3.7.1 North America
- 3.8 Trade data analysis
- 3.8.1 Import/export volume & value trends
- 3.8.2 Key trade corridors & tariff impact
- 3.9 Impact of AI & generative AI on the market
- 3.9.1 AI-driven disruption of existing business models
- 3.9.2 Genai use cases & adoption roadmap by segment
- 3.9.3 Risks, limitations & regulatory considerations
- 3.10 Porter's analysis
- 3.11 PESTEL analysis
- 3.12 Consumer behaviour analysis
- 3.12.1 Purchasing patterns
- 3.12.2 Preference analysis
- 3.12.3 Regional variations in consumer behaviour
- 3.12.4 Impact of e-commerce on buying decisions
Chapter 4 Competitive Landscape, 2025
- 4.1 Introduction
- 4.2 Company market share analysis
- 4.2.1 By region
- 4.2.1.1 North America
- 4.2.1.2 Europe
- 4.2.1.3 Asia Pacific
- 4.2.1.4 Latin America
- 4.2.1.5 Middle East and Africa
- 4.2.1 By region
- 4.3 Company matrix analysis
- 4.4 Competitive analysis of major market players
- 4.5 Competitive positioning matrix
- 4.6 Key developments
- 4.6.1 Mergers & acquisitions
- 4.6.2 Partnerships & collaborations
- 4.6.3 New product launches
- 4.6.4 Expansion plans
Chapter 5 Market Estimates & Forecast, By Technology, 2022 - 2035, (USD Billion) (Thousand Units)
- 5.1 Key trends
- 5.2 Digital light processing (DLP)
- 5.3 Liquid crystal display (LCD)
- 5.4 Liquid crystal on silicon (Locos)
- 5.5 Others
Chapter 6 Market Estimates & Forecast, By Projector Screen Size, 2022 - 2035, (USD Billion) (Thousand Units)
- 6.1 Key trends
- 6.2 Below 50 Inches
- 6.3 50 - 200 Inches
- 6.4 Above 200 Inches
Chapter 7 Market Estimates & Forecast, By Connectivity, 2022 - 2035, (USD Billion) (Thousand Units)
- 7.1 Key trends
- 7.2 Wired
- 7.3 Wireless
Chapter 8 Market Estimates & Forecast, By End Use, 2022 - 2035, (USD Billion) (Thousand Units)
- 8.1 Key trends
- 8.2 Home entertainment
- 8.3 Educational institutions
- 8.4 Business professionals
- 8.5 Gaming
- 8.6 Event organizers
- 8.7 Media production / content house
- 8.8 Others (lounges, clubs, sports center etc.)
Chapter 9 Market Estimates & Forecast, By Distribution Channel, 2022 - 2035, (USD Billion) (Thousand Units)
- 9.1 Key trends
- 9.2 Online
- 9.2.1 E-Commerce
- 9.2.2 Company websites
- 9.3 Offline
- 9.3.1 Specialty stores
- 9.3.2 Mega retail stores
- 9.3.3 Others
Chapter 10 Market Estimates & Forecast, By Region, 2022-2035 (USD Billion) (Thousand Units)
- 10.1 Key trends
- 10.2 North America
- 10.2.1 U.S.
- 10.2.2 Canada
- 10.3 Europe
- 10.3.1 Germany
- 10.3.2 France
- 10.3.3 UK
- 10.3.4 Italy
- 10.3.5 Spain
- 10.4 Asia Pacific
- 10.4.1 China
- 10.4.2 India
- 10.4.3 Japan
- 10.4.4 South Korea
- 10.4.5 Australia
- 10.5 Latin America
- 10.5.1 Brazil
- 10.5.2 Mexico
- 10.5.3 Argentina
- 10.6 MEA
- 10.6.1 South Africa
- 10.6.2 Saudi Arabia
- 10.6.3 UAE
Chapter 11 Company Profiles
- 11.1 AAXA Technologies
- 11.2 Acer
- 11.3 Anker (Nebula)
- 11.4 ASUS
- 11.5 BenQ
- 11.6 Epson America
- 11.7 JMGO
- 11.8 LG Electronics
- 11.9 Optoma
- 11.10 Philips
- 11.11 Samsung
- 11.12 Sony
- 11.13 ViewSonic
- 11.14 Xiaomi
- 11.15 XGIMI
 可携式投影机市场:按解析度、光源、连接方式、便携式类型、应用、最终用户和分销管道划分-2026-2032年全球市场预测
 可携式投影机市场分析及预测(至2035年):类型、产品、技术、组件、应用、外形尺寸、设备、最终用户、安装方式、模式
 携带式投影机市场 - 全球产业规模、份额、趋势、机会及预测(按产品类型、连接方式、销售管道、地区和竞争格局划分,2021-2031年)
 可携式投影机市场规模、份额和成长分析(按分销管道、技术、尺寸、流明、解析度、投影影像尺寸、应用和地区划分)—2026-2033年行业预测
 可携式投影机市场:按技术、尺寸、流明、解析度、投影影像尺寸、应用、地区划分 - 到 2029 年的预测