


 |
市场调查报告书
商品编码
1998820
频谱感测器市场:商业机会、成长要素、产业趋势分析及2026-2035年预测Spectral Sensor Market Opportunity, Growth Drivers, Industry Trend Analysis, and Forecast 2026 - 2035 |
||||||
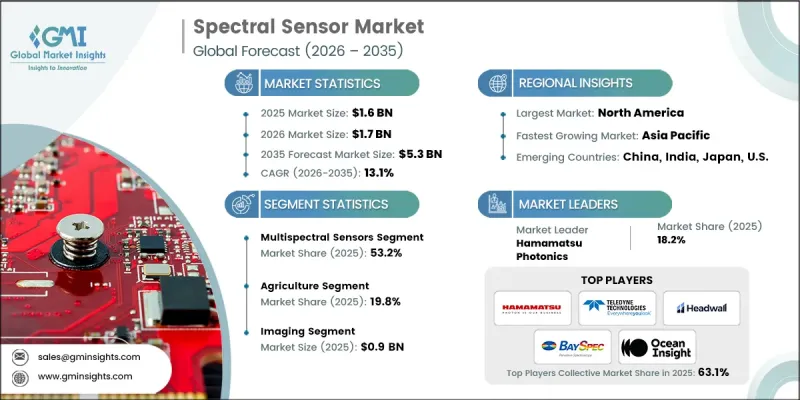
全球频谱感测器市场预计到 2025 年价值 16 亿美元,并将以 13.1% 的复合年增长率成长,到 2035 年达到 53 亿美元。
随着各行各业越来越多地采用先进的光学感测技术来提高测量精度并促进数据驱动的决策,频谱感测器市场呈现强劲成长势头。光谱感测解决方案能够利用不同波长的光详细分析材料、物质和环境状况,因此在多个领域备受关注。这种能力使企业和研究机构能够进行更精确的检测、改善品质监控并增强分析能力。此外,感测平台技术的快速发展使光谱感测器更加紧凑高效,从而适用于更广泛的应用。同时,对科学研究、自动化和数位监控技术的投资不断增加,正在加速先进感测系统在工业和研究领域的部署。随着企业越来越依赖先进的数据分析工具来提高营运效率和产品质量,光谱感测器正成为现代感测和诊断系统的重要组成部分。这些因素共同推动了全球光谱感测器市场的持续成长。
| 市场范围 | |
|---|---|
| 开始年份 | 2025 |
| 预测期 | 2026-2035 |
| 上市时的市场规模 | 16亿美元 |
| 预测金额 | 53亿美元 |
| 复合年增长率 | 13.1% |
频谱感测器市场也受惠于各行各业对先进监测技术日益增长的需求,这些技术能够实现更精确的数据收集。频谱感测技术透过测量不同波长的光与各种物质的相互作用,能够对材料进行精确的检测和分析。这种能力使频谱感测器成为监测生物状态、评估产品成分以及支持前沿科学研究的宝贵工具。此外,高光谱遥测和频谱感测技术的快速发展正在拓展这些系统的应用范围。随着各行业对更高分析精度和更快检测流程的需求不断增长,频谱感测解决方案正越来越多地整合到自动化监测平台和数据分析系统中。
预计到2025年,频谱感测器市场占有率将达到53.2%。这些感测器因其能够采集多个特定波段的信息,从而实现对材料和环境条件的详细分析,而已广泛应用。频谱感测器在性能、价格和运行效率之间的平衡,促使其在众多监测和检测应用中广泛采用。此外,它们与各种部署平台的兼容性支援大规模资料采集和即时监测功能。随着各行业越来越依赖先进的感测技术来提高营运效率和品质评估,频谱感测器在现代感测系统的发展中继续发挥核心作用。
受紧凑型光谱测量系统在分析和监测应用中日益普及的推动,预计2026年至2035年间,非成像光谱感测器市场将以14.5%的复合年增长率成长。非成像频谱感测器专注于获取精确的频谱数据,而无需生成空间影像,因此非常适合整合到携带式分析仪器和嵌入式感测平台中。其紧凑的尺寸和测量精度使其能够应用于实验室、製造工厂和现场作业中使用的各种检测和分析工具。随着业界对快速可靠的材料分析的需求不断增长,对紧凑型非成像频谱感测技术的需求预计将持续增长。
预计到2025年,北美光谱感测器市场份额将达到31.3%。该地区正经历稳定成长,这主要得益于先进感测技术在科学研究、工业检测和环境监测等领域的日益普及。强大的技术基础设施和对光学感测创新持续不断的投资,正推动先进光谱感测解决方案在各个领域的广泛应用。研究机构、技术开发公司和私人企业正积极投资于光电和先进感测技术,以增强分析能力并支持新的科学应用。这种持续的投资正在巩固该地区作为频谱感测器市场创新和发展领先中心的地位。
目录
第一章:调查方法和范围
第二章执行摘要
第三章业界考察
- 生态系分析
- 供应商情况
- 利润率
- 成本结构
- 每个阶段增加的价值
- 影响价值链的因素
- 中断
- 影响产业的因素
- 促进因素
- 扩大精密农业在作物健康监测的应用
- 利用频谱感测技术拓展食品安全检验领域
- 高光谱影像在医学诊断的应用日益广泛
- 利用频谱分析扩展工业品质检测
- 智慧环境监测网路的扩展
- 产业潜在风险与挑战
- 高光谱遥测感测器系统整合成本高昂
- 复杂的频谱资料处理需求
- 市场机会
- 与人工智慧驱动的频谱数据分析相结合
- 穿戴式非侵入式健康监测感测器的扩展
- 促进因素
- 成长潜力分析
- 监理情势
- 北美洲
- 欧洲
- 亚太地区
- 拉丁美洲
- 中东和非洲
- 波特五力分析
- PESTEL 分析
- 科技与创新趋势
- 当前技术趋势
- 新兴技术
- 价格趋势
- 按地区
- 副产品
- 定价策略
- 新经营模式
- 合规要求
- 专利和智慧财产权分析
- 人工智慧和生成式人工智慧对市场的影响
- 利用人工智慧改造现有经营模式
- 细分市场生成式人工智慧用例和实施蓝图
- 频谱数据的自动分析
- 人工智慧驱动的感测器校准和校正
- 光谱感测系统的预测性维护
- 生产能力和生产趋势(基于付费资料库)
- 按地区和主要製造商分類的装置容量
- 运转率和扩张计划
第四章 竞争情势
- 介绍
- 企业市占率分析
- 按地区
- 北美洲
- 欧洲
- 亚太地区
- 拉丁美洲
- 中东和非洲
- 市场集中度分析
- 按地区
- 主要企业的竞争标竿分析
- 财务绩效比较
- 销售量
- 利润率
- 研究与开发
- 产品系列比较
- 产品线宽度
- 科技
- 创新
- 区域扩张比较
- 全球扩张分析
- 服务网路覆盖
- 按地区分類的市场渗透率
- 竞争定位矩阵
- 领导者
- 挑战者
- 追踪者
- 小众玩家
- 战略展望矩阵
- 财务绩效比较
- 主要进展
- 併购
- 伙伴关係与合作
- 技术进步
- 扩张和投资策略
- 数位转型计划
- 新兴竞争对手和Start-Ups竞争对手的发展趋势
第五章 市场估算与预测:依产品类型划分,2022-2035年
- 频谱感测器
- 高光谱遥测感测器
第六章 市场估计与预测:依技术划分,2022-2035年
- 影像
- 非影像
第七章 市场估计与预测:依应用领域划分,2022-2035年
- 农业
- 环境监测
- 卫生保健
- 食品/饮料
- 航太/国防
- 工业製造
- 其他的
第八章 市场估计与预测:依地区划分,2022-2035年
- 北美洲
- 我们
- 加拿大
- 欧洲
- 德国
- 英国
- 法国
- 西班牙
- 义大利
- 荷兰
- 亚太地区
- 中国
- 印度
- 日本
- 澳洲
- 韩国
- 拉丁美洲
- 巴西
- 墨西哥
- 阿根廷
- 中东和非洲
- 南非
- 沙乌地阿拉伯
- 阿拉伯聯合大公国
第九章:公司简介
- 主要企业
- Teledyne Technologies
- Hamamatsu Photonics
- Corning Incorporated
- 按地区分類的主要企业
- 北美洲
- Ocean Insight
- Headwall Photonics
- Resonon Inc.
- 亚太地区
- TriEye
- 欧洲
- Avantes
- Photonfocus AG
- InfraTec GmbH
- 北美洲
- 特殊玩家/干扰者
- BaySpec
- Middleton Spectral Vision
- Brimrose Corporation of America
- Si-Ware Systems
- Spectral Engines
The Global Spectral Sensor Market was valued at USD 1.6 billion in 2025 and is estimated to grow at a CAGR of 13.1% to reach USD 5.3 billion by 2035.
The spectral sensor market is experiencing strong momentum as industries increasingly adopt advanced optical sensing technologies to improve measurement accuracy and data-driven decision-making. Spectral sensing solutions are gaining traction across multiple sectors because they allow detailed analysis of materials, substances, and environmental conditions using different wavelengths of light. This capability is enabling businesses and research institutions to conduct more precise inspections, improve quality monitoring, and enhance analytical capabilities. Rapid technological development in sensing platforms has also made spectral sensors more compact, efficient, and adaptable to a wide variety of applications. At the same time, growing investments in scientific research, automation, and digital monitoring technologies are accelerating the adoption of advanced sensing systems across industrial and research environments. As organizations continue to rely on sophisticated data analysis tools to improve operational performance and product quality, spectral sensors are becoming an essential component in modern sensing and diagnostic systems. These factors collectively support the sustained growth of the global spectral sensor market.
| Market Scope | |
|---|---|
| Start Year | 2025 |
| Forecast Year | 2026-2035 |
| Start Value | $1.6 Billion |
| Forecast Value | $5.3 Billion |
| CAGR | 13.1% |
The spectral sensor market is also benefiting from the growing need for advanced monitoring technologies that support more precise data collection across several industries. Spectral sensing technologies enable accurate detection and analysis of materials by measuring how different wavelengths of light interact with various substances. This capability makes spectral sensors valuable tools for monitoring biological conditions, evaluating product composition, and supporting advanced scientific research. In addition, rapid progress in hyperspectral and multispectral sensing technologies is expanding the range of applications where these systems can be deployed. As industries seek improved analytical accuracy and faster inspection processes, spectral sensing solutions are increasingly integrated into automated monitoring platforms and data analysis systems.
The multispectral sensors segment accounted for 53.2% share in 2025. These sensors remain widely adopted due to their ability to capture information across multiple specific wavelength bands, allowing detailed analysis of materials and environmental conditions. Multispectral sensors offer a balanced combination of performance, affordability, and operational efficiency, which has contributed to their widespread use across numerous monitoring and inspection applications. Their compatibility with various deployment platforms also supports large-scale data collection and real-time monitoring capabilities. As industries increasingly rely on advanced sensing technologies to improve operational efficiency and quality assessment, multispectral sensors continue to play a central role in the development of modern sensing systems.
The non-imaging segment is projected to grow at a CAGR of 14.5% during 2026-2035, supported by increasing adoption of compact spectral measurement systems in analytical and monitoring applications. Non-imaging spectral sensors focus on capturing precise spectral data without generating spatial images, making them suitable for integration into portable analytical devices and embedded sensing platforms. Their compact size and measurement accuracy allow them to be incorporated into a wide range of inspection and analytical tools used in laboratories, manufacturing facilities, and field operations. As industries continue to prioritize rapid and reliable material analysis, the demand for compact non-imaging spectral sensing technologies is expected to increase steadily.
North America Spectral Sensor Market accounted for 31.3% share in 2025. The region is experiencing steady growth as industries increasingly adopt advanced sensing technologies for scientific research, industrial inspection, and environmental monitoring applications. Strong technological infrastructure and continued investment in optical sensing innovation have encouraged widespread deployment of advanced spectral sensing solutions across various sectors. Research institutions, technology developers, and private organizations are actively investing in photonics and advanced sensing technologies to improve analytical capabilities and support emerging scientific applications. These ongoing investments are helping strengthen the region's position as a major hub for innovation and development in the spectral sensor market.
Key companies operating in the Global Spectral Sensor Market include Teledyne Technologies, Corning Incorporated, Hamamatsu Photonics, Ocean Insight, Headwall Photonics, Resonon Inc., Avantes, BaySpec, Spectral Engines, Middleton Spectral Vision, InfraTec GmbH, Photonfocus AG, Si-Ware Systems, Brimrose Corporation of America, and TriEye. Companies participating in the Global Spectral Sensor Market are implementing several strategic initiatives to strengthen their technological capabilities and expand their global presence. Many organizations are investing in research and development to enhance sensor sensitivity, improve spectral resolution, and reduce device size for easier integration into various applications. Expanding product portfolios with innovative sensing solutions designed for emerging industries is also a key priority. Strategic partnerships with research institutions, technology developers, and industrial companies allow sensor manufacturers to accelerate product innovation and broaden application opportunities. Businesses are also focusing on improving manufacturing efficiency and developing scalable production processes to meet increasing global demand.
Table of Contents
Chapter 1 Methodology and Scope
- 1.1 Market scope and definition
- 1.2 Research design
- 1.2.1 Research approach
- 1.2.2 Data collection methods
- 1.3 Data mining sources
- 1.3.1 Global
- 1.3.2 Regional/Country
- 1.4 Base estimates and calculations
- 1.4.1 Base year calculation
- 1.4.2 Key trends for market estimation
- 1.5 Primary research and validation
- 1.5.1 Primary sources
- 1.6 Forecast model
- 1.7 Research assumptions and limitations
Chapter 2 Executive Summary
- 2.1 Industry 360° synopsis, 2022 - 2035
- 2.2 Key market trends
- 2.2.1 Product type trends
- 2.2.2 Technology trends
- 2.2.3 Application trends
- 2.2.4 Regional trends
- 2.3 TAM Analysis, 2026-2035
- 2.4 CXO perspectives: Strategic imperatives
Chapter 3 Industry Insights
- 3.1 Industry ecosystem analysis
- 3.1.1 Supplier Landscape
- 3.1.2 Profit Margin
- 3.1.3 Cost structure
- 3.1.4 Value addition at each stage
- 3.1.5 Factor affecting the value chain
- 3.1.6 Disruptions
- 3.2 Industry impact forces
- 3.2.1 Growth drivers
- 3.2.1.1 Rising precision agriculture adoption for crop health monitoring
- 3.2.1.2 Rising food safety verification using spectral sensing
- 3.2.1.3 Growing hyperspectral imaging use in medical diagnostics
- 3.2.1.4 Increasing industrial quality inspection using spectral analysis
- 3.2.1.5 Expansion of smart environmental monitoring networks
- 3.2.2 Industry pitfalls and challenges
- 3.2.2.1 High hyperspectral sensor system integration costs
- 3.2.2.2 Complex spectral data processing requirements
- 3.2.3 Market opportunities
- 3.2.3.1 Integration with AI-driven spectral data analytics
- 3.2.3.2 Expansion of wearable non-invasive health monitoring sensors
- 3.2.1 Growth drivers
- 3.3 Growth potential analysis
- 3.4 Regulatory landscape
- 3.4.1 North America
- 3.4.2 Europe
- 3.4.3 Asia Pacific
- 3.4.4 Latin America
- 3.4.5 Middle East & Africa
- 3.5 Porter's analysis
- 3.6 PESTEL analysis
- 3.7 Technology and Innovation landscape
- 3.7.1 Current technological trends
- 3.7.2 Emerging technologies
- 3.8 Price trends
- 3.8.1 By region
- 3.8.2 By product
- 3.9 Pricing Strategies
- 3.10 Emerging Business Models
- 3.11 Compliance Requirements
- 3.12 Patent and IP analysis
- 3.13 Impact of AI & Generative AI on the Market
- 3.13.1 AI-Driven Disruption of Existing Business Models
- 3.13.2 GenAI Use Cases & Adoption Roadmap by Segment
- 3.13.2.1 Automated Spectral Data Interpretation
- 3.13.2.2 AI-Enhanced Sensor Calibration & Compensation
- 3.13.2.3 Predictive Maintenance for Spectral Sensing Systems
- 3.14 Capacity & Production Landscape (Based on Paid Databases)
- 3.14.1 Installed Capacity by Region & Key Producer
- 3.14.2 Capacity Utilization Rates & Expansion Pipelines
Chapter 4 Competitive Landscape, 2025
- 4.1 Introduction
- 4.2 Company market share analysis
- 4.2.1 By region
- 4.2.1.1 North America
- 4.2.1.2 Europe
- 4.2.1.3 Asia Pacific
- 4.2.1.4 Latin America
- 4.2.1.5 Middle East & Africa
- 4.2.2 Market concentration analysis
- 4.2.1 By region
- 4.3 Competitive benchmarking of key players
- 4.3.1 Financial performance comparison
- 4.3.1.1 Revenue
- 4.3.1.2 Profit margin
- 4.3.1.3 R&D
- 4.3.2 Product portfolio comparison
- 4.3.2.1 Product range breadth
- 4.3.2.2 Technology
- 4.3.2.3 Innovation
- 4.3.3 Geographic presence comparison
- 4.3.3.1 Global footprint analysis
- 4.3.3.2 Service network coverage
- 4.3.3.3 Market penetration by region
- 4.3.4 Competitive positioning matrix
- 4.3.4.1 Leaders
- 4.3.4.2 Challengers
- 4.3.4.3 Followers
- 4.3.4.4 Niche players
- 4.3.5 Strategic outlook matrix
- 4.3.1 Financial performance comparison
- 4.4 Key developments
- 4.4.1 Mergers and acquisitions
- 4.4.2 Partnerships and collaborations
- 4.4.3 Technological advancements
- 4.4.4 Expansion and investment strategies
- 4.4.5 Digital transformation initiatives
- 4.5 Emerging/ startup competitors landscape
Chapter 5 Market Estimates and Forecast, By Product Type, 2022 - 2035 (USD Million)
- 5.1 Key trends
- 5.2 Multispectral sensors
- 5.3 Hyperspectral sensors
Chapter 6 Market Estimates and Forecast, By Technology, 2022 - 2035 (USD Million)
- 6.1 Key trends
- 6.2 Imaging
- 6.3 Non-imaging
Chapter 7 Market Estimates and Forecast, By Application, 2022 - 2035 (USD Million)
- 7.1 Key trends
- 7.2 Agriculture
- 7.3 Environmental monitoring
- 7.4 Healthcare
- 7.5 Food & beverage
- 7.6 Aerospace & defense
- 7.7 Industrial manufacturing
- 7.8 Others
Chapter 8 Market Estimates and Forecast, By Region, 2022 - 2035 (USD Million)
- 8.1 Key trends
- 8.2 North America
- 8.2.1 U.S.
- 8.2.2 Canada
- 8.3 Europe
- 8.3.1 Germany
- 8.3.2 UK
- 8.3.3 France
- 8.3.4 Spain
- 8.3.5 Italy
- 8.3.6 Netherlands
- 8.4 Asia Pacific
- 8.4.1 China
- 8.4.2 India
- 8.4.3 Japan
- 8.4.4 Australia
- 8.4.5 South Korea
- 8.5 Latin America
- 8.5.1 Brazil
- 8.5.2 Mexico
- 8.5.3 Argentina
- 8.6 Middle East and Africa
- 8.6.1 South Africa
- 8.6.2 Saudi Arabia
- 8.6.3 UAE
Chapter 9 Company Profiles
- 9.1 Global Key Players
- 9.1.1 Teledyne Technologies
- 9.1.2 Hamamatsu Photonics
- 9.1.3 Corning Incorporated
- 9.2 Regional key players
- 9.2.1 North America
- 9.2.1.1 Ocean Insight
- 9.2.1.2 Headwall Photonics
- 9.2.1.3 Resonon Inc.
- 9.2.2 Asia Pacific
- 9.2.2.1 TriEye
- 9.2.3 Europe
- 9.2.3.1 Avantes
- 9.2.3.2 Photonfocus AG
- 9.2.3.3 InfraTec GmbH
- 9.2.1 North America
- 9.3 Niche Players/Disruptors
- 9.3.1 BaySpec
- 9.3.2 Middleton Spectral Vision
- 9.3.3 Brimrose Corporation of America
- 9.3.4 Si-Ware Systems
- 9.3.5 Spectral Engines
 薄膜感测器市场:依产品类型、技术、基板类型和最终用途产业划分-2026-2032年全球市场预测大气感测器市场:2026-2032年全球市场预测(按感测器类型、技术、安装方式、应用和最终用户划分)感测器市场:按感测器类型、技术类型、连接方式、最终用户产业和应用划分-2026-2032年全球市场预测
 钢材接近感测器市场报告:趋势、预测和竞争分析(至2035年)电导率仪市场:全球市场按产品类型、测量范围、电极类型、应用和最终用户分類的预测——2026-2032年
 2026年全球自由落体金属探测器市场报告互动式感测器市场:依技术、应用、最终用途、连接方式和外形规格-2026-2032年全球市场预测整合感测器市场:按技术、感测器类型、输出讯号和应用划分-2026-2032年全球市场预测消费级CP感测器市场:2026-2032年全球预测(依感测器技术、应用、最终用户和销售管道)重力感测器市场:按输出类型、轴数、技术类型、应用和分销管道划分-2026-2032年全球预测