


 |
市场调查报告书
商品编码
1998850
2026 年至 2035 年低功耗下一代显示器的市场机会、成长要素、产业趋势与预测。Low Power Next Generation Display Market Opportunity, Growth Drivers, Industry Trend Analysis, and Forecast 2026 - 2035 |
||||||
全球低功耗下一代显示器市场预计到 2025 年将价值 1.32 亿美元,并以 6.5% 的复合年增长率增长,到 2035 年达到 2.568 亿美元。
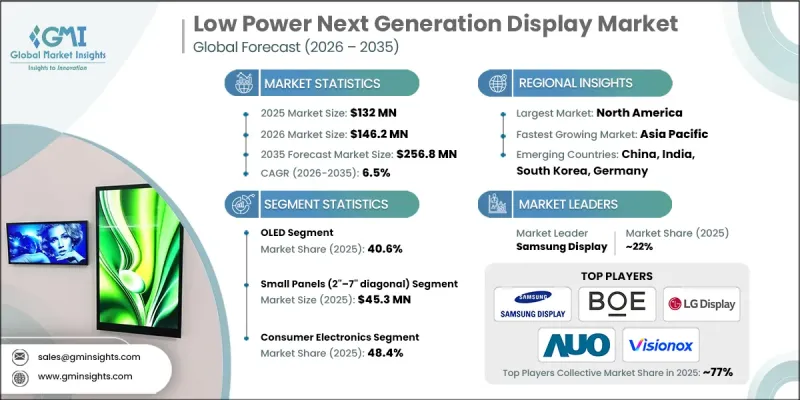
市场成长主要得益于节能型下一代显示技术(例如OLED和microLED)在家用电子电器、穿戴式装置和汽车数位驾驶座等领域的广泛应用。此外,对采用紧凑型、低功耗微型显示器的AR、VR和MR应用的需求不断增长,也推动了市场扩张。电子产业的节能倡议,以及行动装置和工业设备向常亮型高亮度显示器的转变,进一步促进了这些技术的普及。区域扩张,得益于消费性电子产品渗透率的提高、智慧汽车的普及以及节能显示技术在工业领域的集成,为超小型、高性能和环保面板的创新创造了机会。
| 市场范围 | |
|---|---|
| 开始年份 | 2025 |
| 预测期 | 2026-2035 |
| 上市时的市场规模 | 1.32亿美元 |
| 预计金额 | 2.568亿美元 |
| 复合年增长率 | 6.5% |
智慧型手机和平板电脑采用LTPO OLED技术显着提升了电池效率和效能,从而大大促进了市场发展。市场对AR/VR设备和配备常亮显示器的可穿戴设备的需求不断增长,推动了节能型微型显示器的发展,製造商们正致力于创新紧凑型、高亮度显示解决方案。新一代显示器在数位汽车仪錶板中的应用也促进了全球市场成长,这反映出整个产业在消费性电子、工业和汽车应用领域对节能环保技术的关注。
到2025年,OLED市占率将达到40.6%。 OLED显示器凭藉其自发光技术、卓越的亮度和高能效,在市场上占据主导地位,使其成为行动装置、平板电脑和车载显示器的理想之选。其支援自适应刷新率和最大限度降低能耗的能力,使其成为家用电子电器、汽车面板和工业应用领域的首选,并推动了其在全球范围内的普及。
预计到2025年,小尺寸面板(2-7吋对角线)市场规模将达到4,530万美元。这些面板广泛应用于智慧型手机、穿戴式装置和平板电脑,在紧凑的外形规格和显示性能之间实现了理想的平衡。节能型LCD和LTPO OLED的融合,实现了常亮显示功能和更长的电池续航时间,使得小尺寸面板成为对能源效率和视觉性能要求极高的消费性电子产品和行动装置的理想选择。
到2025年,北美低功耗下一代显示器市占率将达到36%。该地区市场成长的主要驱动力是家用电子电器、汽车、工业和智慧基础设施等应用领域对节能显示技术的强劲需求。 OLED、microLED和量子点显示器的普及应用是支撑该地区销售的关键因素,这些显示器在提供卓越影像品质的同时,还能比传统LCD降低功耗。主要显示器製造商的入驻以及对创新低功耗技术的早期应用,进一步巩固了该地区在北美市场的主导地位。
目录
第一章:调查方法和范围
第二章执行摘要
第三章业界考察
- 生态系分析
- 供应商情况
- 利润率
- 成本结构
- 每个阶段增加的价值
- 影响价值链的因素
- 中断
- 影响产业的因素
- 促进因素
- LTPO OLED在智慧型手机中的快速普及
- 在穿戴式健康监测设备的应用范围扩大
- 需要节能型微型显示器的AR/VR设备
- 支援低功耗电子设备的永续发展法规
- 汽车产业向数位化驾驶座显示器的转变
- 产业潜在风险与挑战
- 低温聚合物氧化物(LTPO)製造中产量比率优化的复杂性
- 微型LED的大规模量产受到限制。
- 市场机会
- 折迭式OLED面板,具备自适应刷新功能
- 适用于物联网边缘设备的低功耗显示器
- 促进因素
- 成长潜力分析
- 监理情势
- 北美洲
- 欧洲
- 亚太地区
- 拉丁美洲
- 中东和非洲
- 波特五力分析
- PESTEL 分析
- 科技与创新趋势
- 当前技术趋势
- 新兴技术
- 价格趋势
- 按地区
- 副产品
- 定价策略
- 新兴经营模式
- 合规要求
- 专利和智慧财产权分析
- 地缘政治和贸易趋势
第四章 竞争情势
- 介绍
- 企业市占率分析
- 按地区
- 北美洲
- 欧洲
- 亚太地区
- 拉丁美洲
- 中东和非洲
- 市场集中度分析
- 按地区
- 主要企业的竞争标竿分析
- 财务绩效比较
- 销售量
- 利润率
- 研究与开发
- 产品系列比较
- 产品线宽度
- 科技
- 创新
- 区域扩张比较
- 全球扩张分析
- 服务网路覆盖
- 按地区分類的市场渗透率
- 竞争定位矩阵
- 领导者
- 挑战者
- 追踪者
- 小众玩家
- 战略展望矩阵
- 财务绩效比较
- 主要进展
- 併购
- 伙伴关係与合作
- 技术进步
- 扩张和投资策略
- 数位转型计划
- 新兴竞争对手和Start-Ups竞争对手的发展趋势
第五章 市场估计与预测:依技术划分,2022-2035年
- OLED
- MicroLED
- 电子纸
- 先进的低功耗液晶显示器
第六章 市场估价与预测:依面板尺寸划分,2022-2035年
- 微型显示器(对角线小于2英吋)
- 小面板(对角线2-7吋)
- 中等尺寸面板(对角线7-17吋)
- 大尺寸面板(对角线17-43吋)
- 超大尺寸面板(对角线尺寸 43 吋或更大)
第七章 市场估计与预测:依外形规格,2022-2035年
- 刚性显示器
- 软性显示器
- 折迭式显示器
- 捲轴式/滑轨式显示器
第八章 市场估计与预测:依应用领域划分,2022-2035年
- 家用电子电器
- 汽车显示器
- 穿戴式装置
- AR/VR/XR 设备(扩增实境)
- 工业和商业用途
第九章 市场估计与预测:依地区划分,2022-2035年
- 北美洲
- 我们
- 加拿大
- 欧洲
- 德国
- 英国
- 法国
- 西班牙
- 义大利
- 俄罗斯
- 亚太地区
- 中国
- 印度
- 日本
- 澳洲
- 韩国
- 拉丁美洲
- 巴西
- 墨西哥
- 阿根廷
- 中东和非洲
- 南非
- 沙乌地阿拉伯
- 阿拉伯聯合大公国
第十章:公司简介
- 主要企业
- LG Display
- Samsung Display
- BOE Technology Group
- Universal Display Corporation(UDC)
- 按地区分類的主要企业
- 北美洲
- QUALCOMM Incorporated
- Nanosys
- Planar Systems
- 亚太地区
- AU Optronics Corporation
- AUO Corporation
- Sharp Corporation
- Sony Corporation
- Panasonic Corporation
- Tianma
- Visionox Technology
- Futaba Corporation
- Doosan Group
- 欧洲
- Novaled GmbH
- Philips
- 北美洲
- 特殊玩家/干扰者
- Dupont
- RitDisplay
The Global Low Power Next Generation Display Market was valued at USD 132 million in 2025 and is estimated to grow at a CAGR of 6.5% to reach USD 256.8 million in 2035.
Market growth is driven by the rising adoption of energy-efficient next-generation display technologies such as OLED and microLED across consumer electronics, wearable devices, and automotive digital cockpits. Increasing demand for AR, VR, and MR applications utilizing compact low-power microdisplays is also propelling expansion. Energy-saving initiatives in the electronics sector, coupled with the shift to always-on and high-brightness displays in mobile devices and industrial equipment, are further boosting adoption. Geographic expansion is supported by rising consumer electronics penetration, smart vehicle adoption, and industrial integration of energy-efficient display technologies, creating opportunities for innovation in ultra-compact, high-performance, and eco-friendly panels.
| Market Scope | |
|---|---|
| Start Year | 2025 |
| Forecast Year | 2026-2035 |
| Start Value | $132 Million |
| Forecast Value | $256.8 Million |
| CAGR | 6.5% |
The market is significantly benefiting from the adoption of LTPO OLED technology in smartphones and tablets, which enhances battery efficiency and performance. Growing demand for AR/VR devices and wearables with always-on displays is driving the development of energy-efficient microdisplays, encouraging manufacturers to innovate in compact, high-brightness display solutions. The integration of next-generation displays in digital automotive dashboards is also contributing to global market growth, reflecting the industry's focus on energy-saving, eco-friendly technologies across consumer, industrial, and automotive applications.
The OLED segment accounted for a 40.6% share in 2025. OLED displays dominate due to their self-emissive technology, superior brightness, and energy efficiency, making them highly suitable for mobile devices, tablets, and automotive displays. Their ability to support adaptive refresh rates and minimize energy consumption has made them a preferred choice in consumer electronics, automotive panels, and industrial applications, driving widespread adoption globally.
The small panel segment (2"-7" diagonal) reached USD 45.3 million in 2025. These panels are widely used in smartphones, wearables, and tablets, offering an ideal balance between compact form factor and display performance. Power-efficient LCD and LTPO OLED integration enables always-on functionality and extended battery life, positioning small panels as the most suitable option for consumer electronics and portable devices where energy efficiency and visual performance are critical.
North America Low Power Next Generation Display Market held a 36% share in 2025. Market growth in the region is driven by strong demand for energy-efficient display technologies in consumer electronics, automotive, industrial, and smart infrastructure applications. Adoption of OLED, microLED, and quantum dot displays, which deliver enhanced visual quality with lower power consumption compared to traditional LCDs, is a key factor supporting regional revenue. The presence of major display manufacturers and early adoption of innovative low-power technologies further reinforces North America's leading market position.
Leading players in the Global Low Power Next Generation Display Market include AU Optronics Corporation, AUO Corporation, BOE Technology Group, Doosan Group, DuPont, Futaba Corporation, LG Display, Nanosys, Novaled GmbH, Panasonic Corporation, Philips, Planar Systems, QUALCOMM Incorporated, RitDisplay, Samsung Display, Sharp Corporation, Sony Corporation, Tianma, Universal Display Corporation (UDC), and Visionox Technology. Companies in the Low Power Next Generation Display Market are adopting multiple strategies to strengthen their presence and expand market share. They are heavily investing in R&D to develop high-brightness, ultra-compact, and energy-efficient OLED, microLED, and LTPO technologies. Strategic partnerships with consumer electronics, automotive, and wearable device manufacturers ensure integration of their display solutions into next-generation devices. Firms are expanding production capacity and manufacturing footprints in key regions to meet growing global demand. Additionally, technology licensing, joint ventures, and targeted marketing campaigns emphasizing energy efficiency and sustainability are being leveraged to enhance brand visibility and maintain competitive advantage in this rapidly evolving market.
Table of Contents
Chapter 1 Methodology and Scope
- 1.1 Market scope and definition
- 1.2 Research design
- 1.2.1 Research approach
- 1.2.2 Data collection methods
- 1.3 Data mining sources
- 1.3.1 Global
- 1.3.2 Regional/Country
- 1.4 Base estimates and calculations
- 1.4.1 Base year calculation
- 1.4.2 Key trends for market estimation
- 1.5 Primary research and validation
- 1.5.1 Primary sources
- 1.6 Forecast model
- 1.7 Research assumptions and limitations
Chapter 2 Executive Summary
- 2.1 Industry 360° synopsis, 2022 - 2035
- 2.2 Key market trends
- 2.2.1 Technology trends
- 2.2.2 Panel size trends
- 2.2.3 Form factor trends
- 2.2.4 Application trends
- 2.2.5 Regional trends
- 2.3 TAM Analysis, 2026-2035
- 2.4 CXO perspectives: Strategic imperatives
- 2.4.1 Executive decision points
- 2.4.2 critical success factors
- 2.5 Future outlook and strategic recommendations
Chapter 3 Industry Insights
- 3.1 Industry ecosystem analysis
- 3.1.1 Supplier Landscape
- 3.1.2 Profit Margin
- 3.1.3 Cost structure
- 3.1.4 Value addition at each stage
- 3.1.5 Factor affecting the value chain
- 3.1.6 Disruptions
- 3.2 Industry impact forces
- 3.2.1 Growth drivers
- 3.2.1.1 Rapid adoption of LTPO OLED in smartphones
- 3.2.1.2 Expanding use in wearable health monitoring devices
- 3.2.1.3 AR/VR devices requiring energy-efficient microdisplays
- 3.2.1.4 Sustainability regulations favoring lower power electronics
- 3.2.1.5 Automotive shift toward digital cockpit displays
- 3.2.2 Industry pitfalls and challenges
- 3.2.2.1 LTPO fabrication yield optimization complexities
- 3.2.2.2 Limited large-scale microLED mass production
- 3.2.3 Market opportunities
- 3.2.3.1 Foldable OLED panels with adaptive refresh
- 3.2.3.2 Low-power displays for IoT edge devices
- 3.2.1 Growth drivers
- 3.3 Growth potential analysis
- 3.4 Regulatory landscape
- 3.4.1 North America
- 3.4.2 Europe
- 3.4.3 Asia Pacific
- 3.4.4 Latin America
- 3.4.5 Middle East & Africa
- 3.5 Porter's analysis
- 3.6 PESTEL analysis
- 3.7 Technology and Innovation landscape
- 3.7.1 Current technological trends
- 3.7.2 Emerging technologies
- 3.8 Price trends
- 3.8.1 By region
- 3.8.2 By product
- 3.9 Pricing Strategies
- 3.10 Emerging Business Models
- 3.11 Compliance Requirements
- 3.12 Patent and IP analysis
- 3.13 Geopolitical and trade dynamics
Chapter 4 Competitive Landscape, 2025
- 4.1 Introduction
- 4.2 Company market share analysis
- 4.2.1 By region
- 4.2.1.1 North America
- 4.2.1.2 Europe
- 4.2.1.3 Asia Pacific
- 4.2.1.4 Latin America
- 4.2.1.5 Middle East & Africa
- 4.2.2 Market concentration analysis
- 4.2.1 By region
- 4.3 Competitive benchmarking of key players
- 4.3.1 Financial performance comparison
- 4.3.1.1 Revenue
- 4.3.1.2 Profit margin
- 4.3.1.3 R&D
- 4.3.2 Product portfolio comparison
- 4.3.2.1 Product range breadth
- 4.3.2.2 Technology
- 4.3.2.3 Innovation
- 4.3.3 Geographic presence comparison
- 4.3.3.1 Global footprint analysis
- 4.3.3.2 Service network coverage
- 4.3.3.3 Market penetration by region
- 4.3.4 Competitive positioning matrix
- 4.3.4.1 Leaders
- 4.3.4.2 Challengers
- 4.3.4.3 Followers
- 4.3.4.4 Niche players
- 4.3.5 Strategic outlook matrix
- 4.3.1 Financial performance comparison
- 4.4 Key developments
- 4.4.1 Mergers and acquisitions
- 4.4.2 Partnerships and collaborations
- 4.4.3 Technological advancements
- 4.4.4 Expansion and investment strategies
- 4.4.5 Digital transformation initiatives
- 4.5 Emerging/ startup competitors landscape
Chapter 5 Market Estimates and Forecast, By Technology, 2022 - 2035 (USD Million)
- 5.1 Key trends
- 5.2 OLED
- 5.3 MicroLED
- 5.4 E-paper
- 5.5 Advanced low-power LCD
Chapter 6 Market Estimates and Forecast, By Panel Size, 2022 - 2035 (USD Million)
- 6.1 Key trends
- 6.2 Microdisplays (< 2 inches diagonal)
- 6.3 Small panels (2" - 7" diagonal)
- 6.4 Medium panels (7" - 17" diagonal)
- 6.5 Large panels (17" - 43" diagonal)
- 6.6 Extra large panels (≥ 43" diagonal)
Chapter 7 Market Estimates and Forecast, By Form Factor, 2022 - 2035 (USD Million)
- 7.1 Key trends
- 7.2 Rigid displays
- 7.3 Flexible displays
- 7.4 Foldable displays
- 7.5 Rollable / slidable displays
Chapter 8 Market Estimates and Forecast, By Application, 2022 - 2035 (USD Million)
- 8.1 Key trends
- 8.2 Consumer electronics
- 8.3 Automotive displays
- 8.4 Wearable devices
- 8.5 AR / VR / XR devices (extended reality)
- 8.6 Industrial & commercial applications
Chapter 9 Market Estimates and Forecast, By Region, 2022 - 2035 (USD Million)
- 9.1 Key trends
- 9.2 North America
- 9.2.1 U.S.
- 9.2.2 Canada
- 9.3 Europe
- 9.3.1 Germany
- 9.3.2 UK
- 9.3.3 France
- 9.3.4 Spain
- 9.3.5 Italy
- 9.3.6 Russia
- 9.4 Asia Pacific
- 9.4.1 China
- 9.4.2 India
- 9.4.3 Japan
- 9.4.4 Australia
- 9.4.5 South Korea
- 9.5 Latin America
- 9.5.1 Brazil
- 9.5.2 Mexico
- 9.5.3 Argentina
- 9.6 Middle East and Africa
- 9.6.1 South Africa
- 9.6.2 Saudi Arabia
- 9.6.3 UAE
Chapter 10 Company Profiles
- 10.1 Global Key Players
- 10.1.1 LG Display
- 10.1.2 Samsung Display
- 10.1.3 BOE Technology Group
- 10.1.4 Universal Display Corporation (UDC)
- 10.2 Regional key players
- 10.2.1 North America
- 10.2.1.1 QUALCOMM Incorporated
- 10.2.1.2 Nanosys
- 10.2.1.3 Planar Systems
- 10.2.2 Asia Pacific
- 10.2.2.1 AU Optronics Corporation
- 10.2.2.2 AUO Corporation
- 10.2.2.3 Sharp Corporation
- 10.2.2.4 Sony Corporation
- 10.2.2.5 Panasonic Corporation
- 10.2.2.6 Tianma
- 10.2.2.7 Visionox Technology
- 10.2.2.8 Futaba Corporation
- 10.2.2.9 Doosan Group
- 10.2.3 Europe
- 10.2.3.1 Novaled GmbH
- 10.2.3.2 Philips
- 10.2.1 North America
- 10.3 Niche Players/Disruptors
- 10.3.1 Dupont
- 10.3.2 RitDisplay


